

Introduction
Materials and methods
Study site
Data collection
Econometric model
Results and discussion
Socio-demographic characteristics of farmers
Climate change and agricultural yields
Climate variables and adoption of CSA
Adoption of CSA
Determinants of adoption of CSA
Conclusion
Introduction
The shifting climate in many regions of the world is one of the most significant environmental concerns confronting humanity today (Datta, 2013). Climate change has the potential to have a negative influence on the yield of most agricultural products, including vegetables, and this impact cannot be understated (Kemausuor et al., 2011; Kotir, 2011). As a result of rising temperature extremes, erratic rainfall patterns, and a lack of modern technology adoption, climate variability and change has resurfaced as a key barrier to food security in Sub-Saharan Africa (SSA) (IPCC, 2007).
Despite the fact that, most farmers have a little knowledge of rainfall patterns in Cameroon, especially in the Southwest Region, they are however being cut off by changes in the ‘normal’ rainfall routines (Molua, 2006). These enormous uncertainties, however, have shifted the focus of scholars’ attention to regional and national implications (Deressa et al., 2005; Gbetibouo and Hassan, 2005; Mendelsohn and Dinar, 2003). Moreover, the effects of climate change, especially in developing countries like Cameroon whose economy is predominantly agrarian, are an important concept that shouldn’t be undermined.
In Cameroon, located in rural settlements are family farms who occupy a large portion in the agricultural sector (ECAM 3, 2007). They play an immense role in agricultural development as they make provision of nearly 95% of food products (cocoyam, sweet potato, maize, etc.) which are consumed on-farm, and about 80% of production is retained (ACDIC, 2008). With such efforts proven by farmers, they still face a decline in farm productivity as a result of current climate change and fluctuation that tends to increase the risk on their output (Cline, 2008). Moreover, approaches to overcome climate variability and change need to demonstrate that they can increase food production and present multiple benefits capable of enhancing resilience.
As a result, one of the most prominent approaches for sustainable agricultural development are Climate-smart agriculture (CSA) strategies which increases output while also improving adaptive capability (Bradshaw et al., 2004; Lipper et al., 2014). CSA technologies and practices give options to solve climate change problems while also bolstering the agriculture sector’s growth and development. Practices are designated CSA for this profile if they maintain or generate increases in productivity while also achieving at least one of the other CSA objectives (adaptation and/or mitigation). Hundreds of technological developments and approaches in the agriculture industry around the world are said to fall under the title of climate-smart agriculture (CSA) according to FAO (2013).
Farmers in Cameroon, especially in the Southwest Region have adopted CSA practices such as multiple cropping, terracing, irrigation, agroforestry, intercropping, use of improved seeds, crop rotation, minimum tillage practices, animal droppings as well as the use of synthetic fertilizers (Molua, 2003; Molua, 2005). Many Sub-Saharan African countries, on the other hand, have implemented climate-smart agriculture as part of their sustainable agricultural development policy (Lipper and Zilberman, 2018). However, actual evidence reveals that smallholder farmers have a low adoption rate (Arslan et al., 2015; Barnard et al., 2015).
Understanding farmer behaviour and how it influences farm-level decisions in the deployment of climate-smart technology in agriculture is therefore critical to the introduction of climate-smart agricultural innovations to Cameroon’s farmers. Moreover, a principal obstacle to the successful introduction of agricultural technologies in the highly risky production agriculture of Sub-Saharan Africa is inefficient understanding of farmer behaviour (Spencer, 1985). Therefore, this study seeks to evaluate how sequential decision making under conditions of uncertainty for smallholder farmers in Buea, Southwest Region of Cameroon affects adoption of climate-smart agricultural innovations.
Materials and methods
Study site
This study was conducted in Buea Sub division in Fako division of the South West Region of Cameroon. It is located on the Eastern slope of Mt. Cameroon, 900 m above sea level, on latitude 4 ͦ and longitude 9° East of the Equator. It shares boundaries with other sub divisions like Mutengene to the East, Ekona to the North, Limbe to the South and the Mt. Cameroon to its West. It comprises 67 villages, each headed by a chief. Its location at the foot of the mountain gives it a humid climate, with mean annual temperatures of 27°C even though, recently, the lower elevations are getting hotter and hotter. Rainfall ranges between 1,500 mm to 3,000 mm annually, with extended periods of rainfall characterized by incessant drizzle, which lasts for weeks, being a common phenomenon in the rainy season.
Though rocky, due to volcanic eruption of the mountain, Buea has a fertile volcanic soil which makes it an agrarian zone with common food crops like yam, cocoyam, cassava, maize, bananas, plantains, potatoes, green leafy vegetables, cabbage, tomatoes, pepper, watermelon, fruit trees and cash crops like tea, cocoa and coffee, e.tc. Majority of the farmers are small scale and subsistent farmers with little surpluses which they sell to raise income to meet their basic needs. Agriculture here is typically traditional hence outputs are lower than expected.
Data collection
A simple random sampling technique was employed to select and interview 150 farm households from five villages, that is, Bova, Bokova, Bojongo, Tole and Boana under Buea sub-division. Data collected was primary data using structured questionnaires and interviews were scheduled for non-literate. The collected data were analyzed by using Excel 2016 and STATA 13.
Econometric model
Given that the dependent Variable is categorical in nature, a probabilistic choice model is most appropriate. Specifically, the dependent variable has more than one category. According to Wooldridge (2010), when the dependent variable has more than one category and nominal in nature, a multinomial logit model is most appropriate. Moreover, the multinomial logit model does not assume normality, linearity and homoscedasticity. Given that it is an extension of the logistic model, the Multinomial logit involves simultaneously estimating separate individual logistic models and as such, it is given as follows:
where 1…K-1 refers to the categories and the βs are the parameters to be estimated.
The multinomial logit model is generally given as follows:
where Yi is the vector of the choice of CSA technique; X’ij is the vector of factors that influence farmers’ decision to adopt CSA techniques. These factors can generally be grouped into farm specific, asset-specific, climatic and socio-demographic factors; Βj is vector of parameters to be estimated.
The multinomial logit model only predicts the probability of a farmer adopting a CSA technique. To have the effect of each explanatory variable, the marginal effects of each independent variable are estimated as follows:
where each βj represents the influence of selected independent variables on the chosen alternatives j to m.
The multinomial logit model is based on the assumption of Independence of irrelevance alternatives.
To estimate the effect of adoption of CSA on production, the Heckman two-stage model was employed. The Heckman model is a two-stage model in which the first stage is the selection model while the second stage is the outcome model (Heckman, 1977). The Heckman model is the less restrictive form of the Tobit model in that it allows different factors to affect the two stages unlike the Tobit model where both stages have the same drivers (Birhanu et al., 2017).
In this study, the first stage involves a specification of a probit model to evaluate the probability of a farmer choosing a technique. In the second stage, a multiple linear regression model was specified to evaluate the effect of CSA on farm production. Given that only some observations will be considered in the second stage, there is a possibility of the problem of sample selection or incidental truncation which makes the Heckman model appropriate. Heckman models are used in situations of incidental truncation. According to Wooldridge (2010), when a dataset suffers from incidental truncation, the Heckman model produces consistent estimates. However, this will be confirmed by the inverse mills ratio.
The Heckman model is generally given as follows:
The probit model is given as
where the right-hand side is the probability of choosing a CSA technique, is the vector of covariates that influence choice of CSA technique and γ is the vector of parameters to be estimated while Φ is the cumulative density function.
The outcome model is given as:
where Y is observable only for households that choose sectors, is the vector of parameters that affect production, α is the parameters to be estimated and λ is the inverse mills ratio.
Results and discussion
Socio-demographic characteristics of farmers
Five variables are considered as the socio-demographic characteristics of farmers (Table 1). For gender, seventy-nine respondents out of 150 are male while fifty-three are females. This is contrary to studies conducted in the Southwest region where the number of females engaged in farming exceeds the number of males. About 95% of total respondents are ranged in the age groups of 20-59, mainly with those of 30-49. This finding is contrary to Tabe-Ojong and Molua (2017) which shows most farmers are old, with average age of about 59 years old.
Table 1.
Socio-demographic characteristics
Four levels of education being considered, 41% of the respondents had attained secondary education, 31% primary education, and 20% tertiary education. Surprisingly, only 8% had not attained any formal education. This result is quite surprising as several studies have shown that most farmers had only attained primary education as their highest level of education. This implies that farmers in this area are relatively more educated as many of them have attained secondary education. This high level of education may have implications on their decisions to adopt CSA. For cooperative membership, however, about 36.67% of the farmers belong to cooperatives while about 63.33% of the farmers do not belong to cooperatives. This indicates that only a few farmers belong to cooperatives despite the huge roles the cooperative play in disseminating information among farmers.
About 38.67% of farmers have access to extension service while their 61.33% do not have its access. This is quite startling since extension has a great role to play in dissemination and adoption of CSA. Its result is supported by Anderson and Feder (2001) whose findings revealed that the farmer-to-extension agent ratio in most developing nations exceeds 1,000:1. Since fewer extension agents have to attend to many farmers, they cannot access all these farmers and as such, only a few farmers have access to extension services, which may limit their adoption.
Several sources of credit exist for farmers. The ‘Njangi’ constitutes the most used source of finance as about 30% of the respondents rely on this source of credit. About 29% of the respondents rely on private loans as a source of credit. Cooperatives and credit unions serve as a source of credit to 16% and 9% of the respondents, respectively. Government institutions and commercial banks on their part serve as sources of credit to 7% and 1% of the respondents respectively. Some farmers rely on more than one source of finance and such farmers constitute about 3% of the sample. Njangi refers to rotatory savings where farmers contribute money and share among each other in turns. It’s a non-formal source of credit and this may explain why most farmers rely on it as a source of finance, most especially because it requires no collateral. Similarly, private loans are equally non-formal and may not require collateral and these accounts for its high use by respondents. Formal sources of credit such as commercial banks are seldom used by farmers due to their bureaucratic nature and demand for collateral.
Climate change and agricultural yields
Fig. 1 shows the effect of different climate variables on agricultural yields as perceived by the farmers. By high temperatures, reported is that agricultural yields decreased (95 farmers, 63.33%) and increased (44 farmers, 29.33%) with no effect (11 farmers, 7.33%). Given that high temperatures provide a favourable environment for pests, especially insect pest, this may account for a high number of respondents reporting a decrease in yield. Due to low temperatures, agricultural yields increased their yields (85 famers, 56.67%) and decreased (39 farmers, 26.00%) with no effect (26 famers, 17.33%). It might be explained that high temperatures favor pests, especially insects, and consequently, low temperatures disfavor pests, probable reason why many farmers reported an increase in yield.
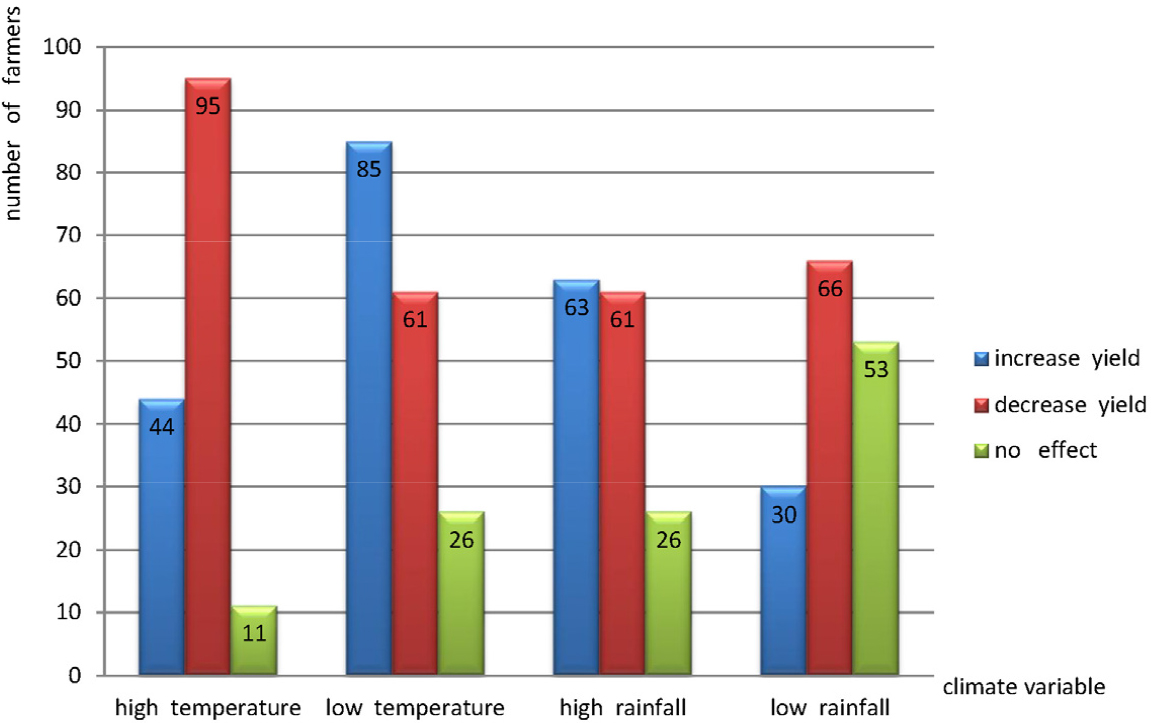
Rainfall is another climate variable that affects yields. Reported is that high rainfall caused to increase their yields by 58 farmers (38.67%) and to decrease them by 83 farmers (55.33%), with no effect of 9 farmers (6.00%). With low rainfalls, the result shows that 63 and 61 farmers reported an increase and a decrease in yield, in turn, respectively, with no effect of 26 farmers. The predictability of rainfall also affects yields. With unpredictable rainfall, the results, 30 and 66 farmers reported an increase and a decrease in their yields, in turn, respectively, with no effect of 53 farmers.
Climate variables and adoption of CSA
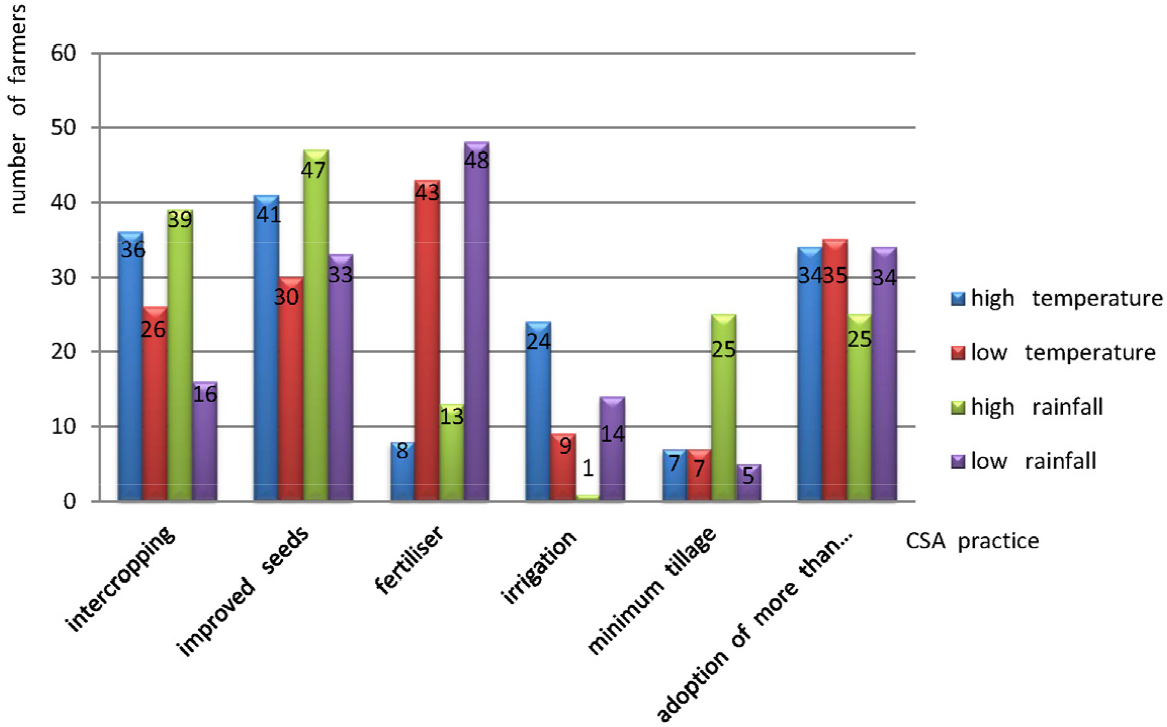
Fig. 2 shows how climatic factors influence the CSA. High temperatures influence the choice of CSA adopted. As a result of high temperatures, 41 of the farmer’s resorts to use of improved seeds while 36 resort to intercropping. About 34, 24, 8 and 7 farmers resort to adoption of more than one CSA, irrigation, fertiliser and minimum tillage, respectively. As a result of low temperature, a majority of the farmers, about 43 resorts to the use of fertiliser while about 35 adopt more than one CSA technique. About 30 farmers resort to improved seeds, 26 resorts to intercropping while 9 and 7 resort to irrigation and minimum tillage. Due to high rainfall, about 47 farmers resort to improved seeds while 39 resort to intercropping. About 25 of the farmers resort to minimum tillage and adoption of more than CSA. Fertiliser and irrigation are adopted by 13 and 1 farmers respectively. Low rainfall also influences adoption of CSA. As a result of low rainfall, about 48 farmers resort to fertilizer while 34 and 33 farmers resort to adopting more than one CSA and improved seeds. Intercropping, irrigation and minimum tillage are adopted by 16, 14 and 5 farmers respectively.
Adoption of CSA
With the analytical results that farmers took adoption of more than one CSA (54%), intercropping (19%), fertilizer (14%), improved seeds (9%), and minimum tillage (3%), irrigation (1%), in turn, Fig. 2 shows how climatic factors influence the CSA. High temperatures influence the choice of CSA adopted. For high temperatures, farmers appeared to resort to use of improved seeds (41), intercropping (36), adoption of more than one CSA (34), irrigation (24), fertilizer (8), and minimum tillage (7), in turn. for low temperature, farmers turned out to resorts to the use of fertilizer (43), 35 adoption of more than one CSA (35), improved seeds (30), intercropping (26), irrigation (9), and minimum tillage (7), in turn.
Due to high rainfall, 47 farmers reported to resort to improved seeds (47), intercropping (39), minimum tillage (25) and adoption of more than CSA (25), fertilizer (13), and irrigation (1), in turn. For low rainfall, farmers resort to fertilizer (48), adoption of more than one CSA (34), improved seeds (33), intercropping (16), irrigation (14), and minimum tillage (5), in turn.
Determinants of adoption of CSA
The results of multinomial logit model of the determinants of choice of CSA are shown in Table 2. The base category is adoption of more than one CSA. The standard errors are displayed in the parentheses. The results partly contradict with previous research in some aspects and partly conformed or are consistent with other previous findings.
Table 2.
Econometric results of multinomial logit model: determinants of CSAs adoption
| Variables | Intercropping | Fertiliser | Irrigation | Improved seeds | Minimum tillage | More than one CSA |
| Land size per family | -1.796** | 0.661 | 3.872*** | -0.395 | -0.532 | |
| member | (0.882) | (0.580) | (1.801) | (0.796) | (1.533) | |
| Age | -0.0343 | 0.0318 | 0.0230 | 0.0126 | -0.0409 | |
| (0.0250) | (0.0256) | (0.101) | (0.0290) | (0.0559) | ||
| Level of education | 0.220 | -0.302 | -1.692 | 0.115 | -0.352 | |
| (0.252) | (0.299) | (2.020) | (0.330) | (0.603) | ||
| Cooperative Membership | 1.087 | 0.548 | 0.451 | 2.087*** | 0.730 | |
| (0.790) | (0.806) | (4.962) | (1.044) | (1.584) | ||
| Access to Extension Service | -0.387 | -1.030 | 0.704 | -1.513** | 0.358 | |
| (0.739) | (0.819) | (5.027) | (0.852) | (1.586) | ||
| Source of credit | -0.109 | -0.137 | -1.458 | 0.227 | -0.0480 | |
| (0.110) | (0.121) | (1.069) | (0.152) | (0.219) | ||
| Constant | 0.798 | -2.182** | -4.939 | -3.764*** | -1.123 | |
| (1.289) | (1.325) | (4.902) | (1.689) | (2.868) | ||
| Observations | 150 | 150 | 150 | 150 | 150 | 150 |
|
Number of observaion = 150 LR (30) = 42.87 Prob > = 0.060 Log likelihood = -172.503 Pseudo R2 = 0.221 | ||||||
From the results, land size per family member exhibits an inverse relationship with adoption of intercropping. That is, the larger the land size per family member, the less likely a farmer will adopt intercropping as opposed to adopting more than one CSA. This coefficient of land size per family member is statistically significant at the 5% level of probability as indicated by its p-value (p < 0.05). This implies that land size per family member influences adoption of intercropping as a CSA. This result is not surprising, however, given that intercropping requires that farmers have access to land.
Moreover, intercropping requires intensive cropping on the same piece of land. As such, farmers with larger farm sizes may be discouraged to adopt such. Also, to cultivate large farm sizes, there is need to use improved seeds as well as fertilisers to boost yields. To this end, farmers with larger farm sizes will prefer to adopt more than one CSA which involves adoption of fertilisers, improved seeds and even irrigation.
Again, land size per family member exhibits a positive relationship with adoption of irrigation. That is, the larger the land size per family member, the more likely a farmer will adopt irrigation as opposed to adopting of more than one CSA. The positive coefficient of land size per family member is statistically significant at the 5% level as indicated by its p-value (p < 0.05). This implies that land size per family member influences adoption of irrigation as a CSA. This study is in line with Yilma et al. (2021) who found out that participation in irrigation is positively determined by land size among other factors.
Cooperative membership and access to extension service are the major drivers of adoption of improved seeds as a CSA. Cooperative membership in its part exhibits a positive relationship with improve seeds. This implies that farmers who belong to cooperative societies are more likely to adopt improved seeds over more than one CSA as opposed to their counter parts who are not members of cooperatives. The positive coefficient of cooperative membership is statistically significant at the 5% level as indicated by its p-value (p < 0.05).
More so, Farmers participate in cooperative organizations because they perceive them as institutions that can help them to reduce production costs and marketing risks, ultimately enhancing their chances of expanding their business operations and raising their income levels. This positive result of cooperative member is in line with (Olagunju et al., 2021) whose result revealed that farmers who belong in cooperative society had consistently higher levels of technical efficiency (TE) than non-members.
Furthermore, an inverse relationship rather exists between access to extension service and adoption of improved seeds. This implies that farmers with access to extension services are less likely to adopt improved seeds over adoption of more than one CSA. Their statistical significance at the 10% (p < 0.1) level implies that they are drivers of adoption of improved seeds. These findings are in line with findings from Abegunde et al. (2019) who found that among other factors, access to extension and access to credit are major drivers of CSA.
Despite the important role of extension service in the agricultural sector, the negative coefficient explains the reality of extension service to farmers in Buea. This is supported by Anderson and Feder (2001) whose findings revealed that the farmer-to-extension agent ratio in most developing nations exceeds 1,000:1. Inadequate funding, poor logistic support for field staff, inadequate training of extension personnel, ineffective agricultural research and extension linkages, insufficient and inappropriate agricultural technologies for farmers, disproportionate number of extension agents to farm family ratio, and lack of clientele participation in program development face the Cameroonian agricultural extension service (Amungwa, 2018).
Furthermore, in Cameroon, extension services are completely controlled by the government, rather than both the private and public sectors, and the government is unable to finance extension programs in all of their forms. As a result, the private sector must become increasingly involved in both funding and the physical transfer of better technologies.
Table 3 shows the Heckman twostep estimation of the effect of CSA on farm production. Stage 1 shows the drivers of adoption of CSA. For simplicity sake, the CSA were considered into two broad groups - the individual choices taking the value 1 and 0 for more than one CSA. To this end, an incidental truncation ensued and as such, the Heckman could be employed. That is, farmers could either adopt either of the individual CSA or none at all.
Table 3.
Econometric results of Heckman two-step model: effect of CSAs on production
| VARIABLES |
Farm production (output) (Stage 2) |
CSA adoption (Stage 1) | mills |
| Land size |
228,462*** (38,064) | ||
| Family size |
-9,579 (20,658) | ||
| Level of education |
3,984 (60,762) |
-0.0237 (0.115) | |
| Cooperative Membership |
-150,675 (151,163) |
0.664** (0.322) | |
| Source of credit facilities |
46,289* (24,697) | ||
| Land size per family member |
-0.118 (0.257) | ||
| Age |
0.00130 (0.010) | ||
| Access to Extension Service |
-0.562* (0.322) | ||
| Lambda |
99,582 (423,50) | ||
| Constant |
-87,144 (487,463) |
-0.149 (0.530) | |
| Observations | 150 | 150 | 150 |
The results indicate that access to extension services and cooperative membership are the major drivers of adoption of CSA. Specifically, there exists an inverse relationship between access to extension and adoption of CSA as farmers with access to extension will be more likely to adopt more than one CSA unlike independent CSA. The coefficient of access to extension is statistically significant at the 10% level of probability as indicated by its p-value (p < 0.1). A positive relationship exists between cooperative membership and adoption of CSA. The coefficient of cooperative membership is statistically significant at the 5% level of probability as indicated by its p-value (p < 0.05). That is, those who belong to cooperatives are more likely to adopt independent CSA opposed to more than one CSA. Interestingly, these results are similar to those obtained by multinomial logit model.
The second stage shows the drivers of farm production. The results indicate that land size and source of credit facilities are the major drivers of farm output. A positive relationship exists between land size and farm output. The coefficient of land size is statistically significant at the 1% level of probability as indicated by its p-value (p < 0.01). This implies that the larger the farm size, the higher the output. This study is in line with studies conduct by (Luu, 2020; Salisu et al., 2017) whose significant results show that land size increased farmers output. A probable explanation is that most smallholder farmers still rely on expansion of farm lands as a means to increase production. This is because they lack means to acquire some key inputs such as improved seeds and fertilisers needed for intensive production.
Again, a positive relationship exists between source of credit and farm output. The coefficient of source of credit facilities is statistically significant at 10% level of probability as indicated by its p-value (p < 0.1). This implies that an increase in source of credit by one unit, increases farm output by 46,289. This study is in line with studies conducted by Salisu et al. (2017) and Luu (2020) whose significant results show that access to credit facilities increased farmer’s output.
The inverse mills ratio on the third column shows the effect of adoption of CSA on farm output. The coefficient of the inverse mills ratio is positive which implies that there exists a positive relationship between adoption of CSA and farm output. That is, farmers who adopt CSA record an increase in farm production. However, given that the coefficient of the inverse mills ratio is not statistically significant, this implies that among the farmers sampled, adoption of CSA does not affect their farm output.
Conclusion
Climate variability and change are here to stay. As a result, CSA adoption is arguably one of the most reliable solutions to this challenge. According to the findings of the multinomial logit model employed in this study, access to extension services, cooperative membership, and land size per family member are the drivers for CSA innovation uptake. The Heckman two-step model, which incorporated two steps, was the second model employed in this investigation. Stage one revealed that cooperative membership and availability to extension services are factors of CSA innovation adoption. This result, however, appears to be identical to that of the multinomial logit model. The second stage revealed that the size of the farm and availability to credit had a beneficial impact on farm output. As a coping mechanism against climate change, farmers are encouraged to switch to CSA in order to enhance their production, productivity, and welfare.
Based on the findings of the study, the recommendations are made as follows:
First, more extension offices should be deployed in the field to increase their coverage of farmers and increase farmers’ access. This will help in spreading the various CSA techniques and even provide some hands-on training on the techniques which may improve the adoption of the CSA.
Second, farmers should be granted more access to credit, especially informal credit. Given that some CSA such as fertilizer, improved seeds inter alia require financial resources to be implemented, access to finance will increase the adoption rate of such CSA.
Third, farmers are encouraged to be members of cooperatives so as to gain access to information benefit from social networks and equally gain access to finance for their agricultural endeavours. Lastly, older farmers should be the focus of extension services given that they mostly suffer from inertia. Focusing on them will increase adoption of CSA as youths are initially more receptive to adoption of CSA.
