

Introduction
Agriculture plays a pivotal role in many economies, with crop yield estimation being fundamental to agricultural planning and policy development. Within North Korea, understanding crop yields becomes even more crucial given the nation’s distinct political, economic, and climatic scenarios. This research emphasizes rice and corn, two crops integral to North Korea’s food security and socio-economic landscape.
In North Korea, rice and corn are not just food items. They are deeply linked to the country’s socio-economic and cultural narrative. A comprehensive understanding of the determinants of their yields is vital for food security, economic resilience, and the promotion of sustainable agricultural practices.
The climate of North Korea, marked by its cold winters and warm, humid summers, has a pronounced effect on its agricultural patterns and, consequently, crop yields. The intricate relationship between climatic conditions and rice and corn yields necessitates a detailed examination.
The motivation for this research stems from several pivotal considerations. Precise crop yield estimations are essential for North Korea, given its history of food shortages. Moreover, with agriculture being a substantial sector in the North Korean economy, any variation in rice and corn yields can have broad economic repercussions. Additionally, discerning the influence of climatic variables on these yields is vital for future agricultural strategies and adapting to climate change.
Numerous studies have delved into agricultural productivity, exploring various influencing factors such as labor, capital, weather conditions, and technological advancements (Butler and Huybers, 2013; Cho et al., 2013). The repercussions of extreme weather on crop yields have also been extensively researched (Schlenker and Roberts, 2009).
Vogel et al. (2019) analyzed the impacts of climate extremes on yield anomalies of maize, soybeans, rice, and spring wheat at the global scale using sub-national yield data and machine-learning algorithms. The study found that growing season climate factors explained 20%-49% of the variance of yield anomalies, with 18%-43% of the explained variance attributable to climate extremes. Their findings underscored the significance of accounting for climatic extremes in agricultural forecasting, especially in key production regions.
Chen et al. (2018) evaluated the effects of climate change on the growth and productivity of major crops (maize, wheat, rice) in China under warming scenarios of 1.5 and 2.0°C. The study presented spatial patterns of changes in crop growth duration, yield, and the impacts of heat and drought stress. The results showed major negative impacts on crop production, particularly for wheat in north China and rice in south China, due to a decrease in crop growth duration and an increase in extreme events.
Tan et al. (2021) examine the impact of climate change on rice yields in Malaysia using panel data from 1987 to 2017. The results indicate varying effects of temperature on yield during different seasons, with projections showing both positive and negative trends in rice yield by 2040.
In the context of North Korea, the literature is relatively sparse due to the lack of publicly available data. However, some studies have attempted to estimate North Korean agricultural productivity using indirect methods. For instance, Haggard and Noland (2007) used satellite imagery to estimate North Korean crop yields. Similarly, Yeom et al. (2018) used a study aimed to accurately simulate paddy rice yield in North Korea by employing a grid-based crop simulation model integrated with geostationary satellite images.
In previous studies such as those by Choi et al. (2021), Lee (2023a), and Lee (2023b), several issues have been identified as structural problems in North Korean agriculture or factors affecting food production in North Korea. These include vulnerability to natural disasters with low resilience, insufficient supply of agricultural machinery, and sluggish agricultural reforms. These issues are also documented in the Voluntary National Review (VNR) submitted by the North Korean authorities. Such discussions have largely remained qualitative due to the lack of statistical data.
This study uniquely leverages empirical analysis to scrutinize the determinants of agricultural productivity in North Korea, a topic previously limited to qualitative discussions. By focusing on the underexplored dimension of climate impacts, including extreme weather variables not fully investigated in preceding studies, it seeks to fill a significant research gap. Utilizing econometric methods, the research estimates the yields of primary crops in North Korea, offering potentially transformative insights for policymakers and stakeholders aiming to bolster agricultural output and food security. This endeavor to bridge the existing knowledge void stands as the study’s pivotal contribution, promising to guide informed strategies in enhancing North Korea’s agricultural sector.
North Korea shares similar characteristics with other least developed countries, including those pertaining to the agricultural sector such as outdated infrastructure, low technological levels, insufficient farmer capabilities, and low investment. However, North Korea requires special attention from the international community as it remains a largely undisclosed region where the general populace is feared to be facing severe food shortages. This study also aims to bring a refreshing perspective to this aspect.
Materials and Methods
To determine crop production in North Korea, it’s essential to have a production function. However, given the limited availability of public data on inputs by region and crop, we focus on estimating productivity (yield) as an output component. By integrating changes in cultivated areas, we can deduce output through yield estimation. This analysis centers on rice and corn due to their significance in North Korea’s food security, economic stability, and available data.
We employed a panel linear model to gauge the productivity of North Korea’s primary crops. Given that our data is panel data with yearly series for each North Korean region, either fixed-effect or random-effect models are suitable. In the preliminary analysis, we rejected the null hypothesis that the fixed-effects model and the random-effects model are not statistically different using the Hausman specification test (Hausman, 1978), so we utilized the fixed-effects model to provide consistent estimates.
We utilized two different fixed effects models. The first is a conventional Fixed Effects (FE) model, which takes into account the time-invariant characteristics of regions. The second is the Fixed Effects with Individual Slope (FEIS) model, which separately accounts for specific trends in individual regions. For example, one region may experience faster or slower advances in technology levels than another (Wooldridge, 2005). In fact, North Korea is allocating more resources such as agricultural machinery and fertilizers to its grain-producing regions through a strategy of selection and concentration (Choi et al., 2021). The explanatory variables included follow previous studies such as Cho et al. (2013) and Butler and Huybers (2013).
Equation (1) represents the FE model, and equation (2) represents the FEIS model. In both equations, is the logarithm of crop yield (production/area planted) in year in province , and is the explanatory variables that affect crop yield, such as growing degree days, precipitation, extreme weather, fertilizer inputs, and technology (trend). In addition, 𝛽 is the estimation coefficients, and represents the error term. in equation (1) and in equation (2) are time-invariant constant terms that vary by panel member, in equation (2) is the trend (year), and is the specific trend for each panel member (province).
Weather data for North Korea was sourced from the World Meteorological Organization (WMO) via the Korea Meteorological Administration’s Open MET Data Portal (Korea Meteorological Administration, 2021). This dataset encompasses daily metrics on temperature, precipitation, wind, barometric pressure, humidity, clouds, and visibility from 27 observation points.
Given the limited observation points, Thiessen polygons, as proposed by Sung et al. (2019), were employed to construct regional data. Using the intersection areas of each polygon and province as weights, province-specific data was formulated. Fig. 1 visualizes these observation points with dots, provinces with gray lines, and Thiessen polygons with black lines. Each non-overlapping Thiessen polygon shares a consistent value, and weighted averages are calculated for provinces intersecting multiple polygons.
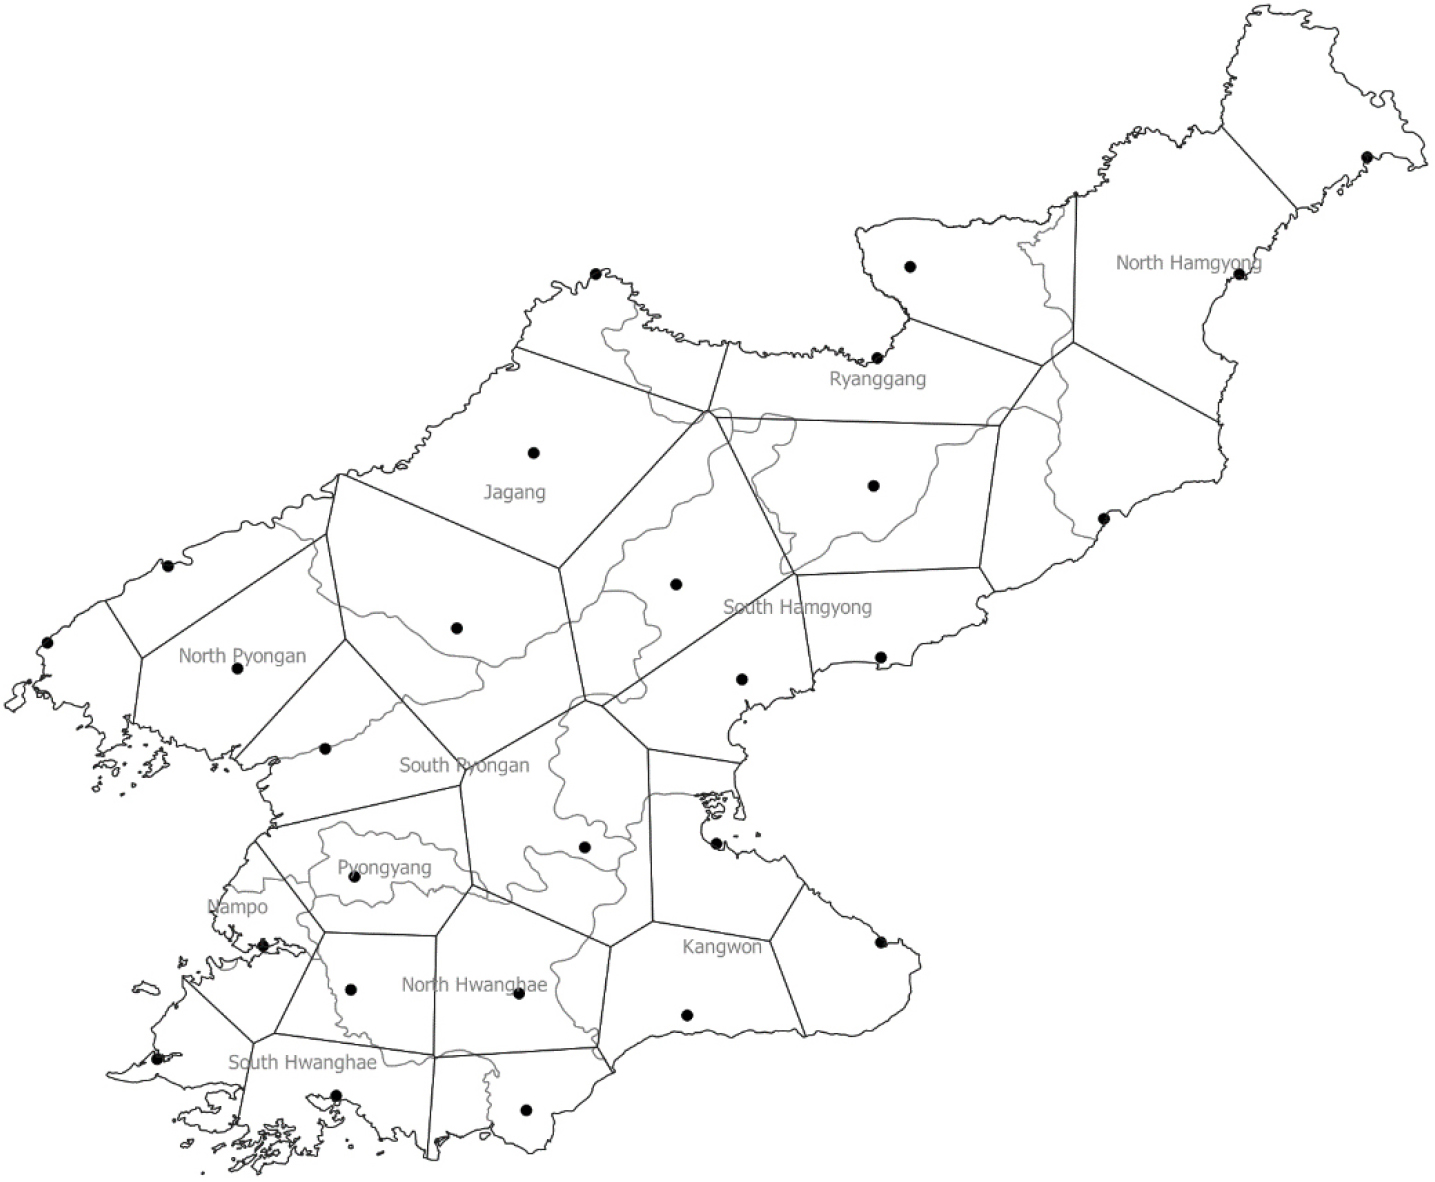
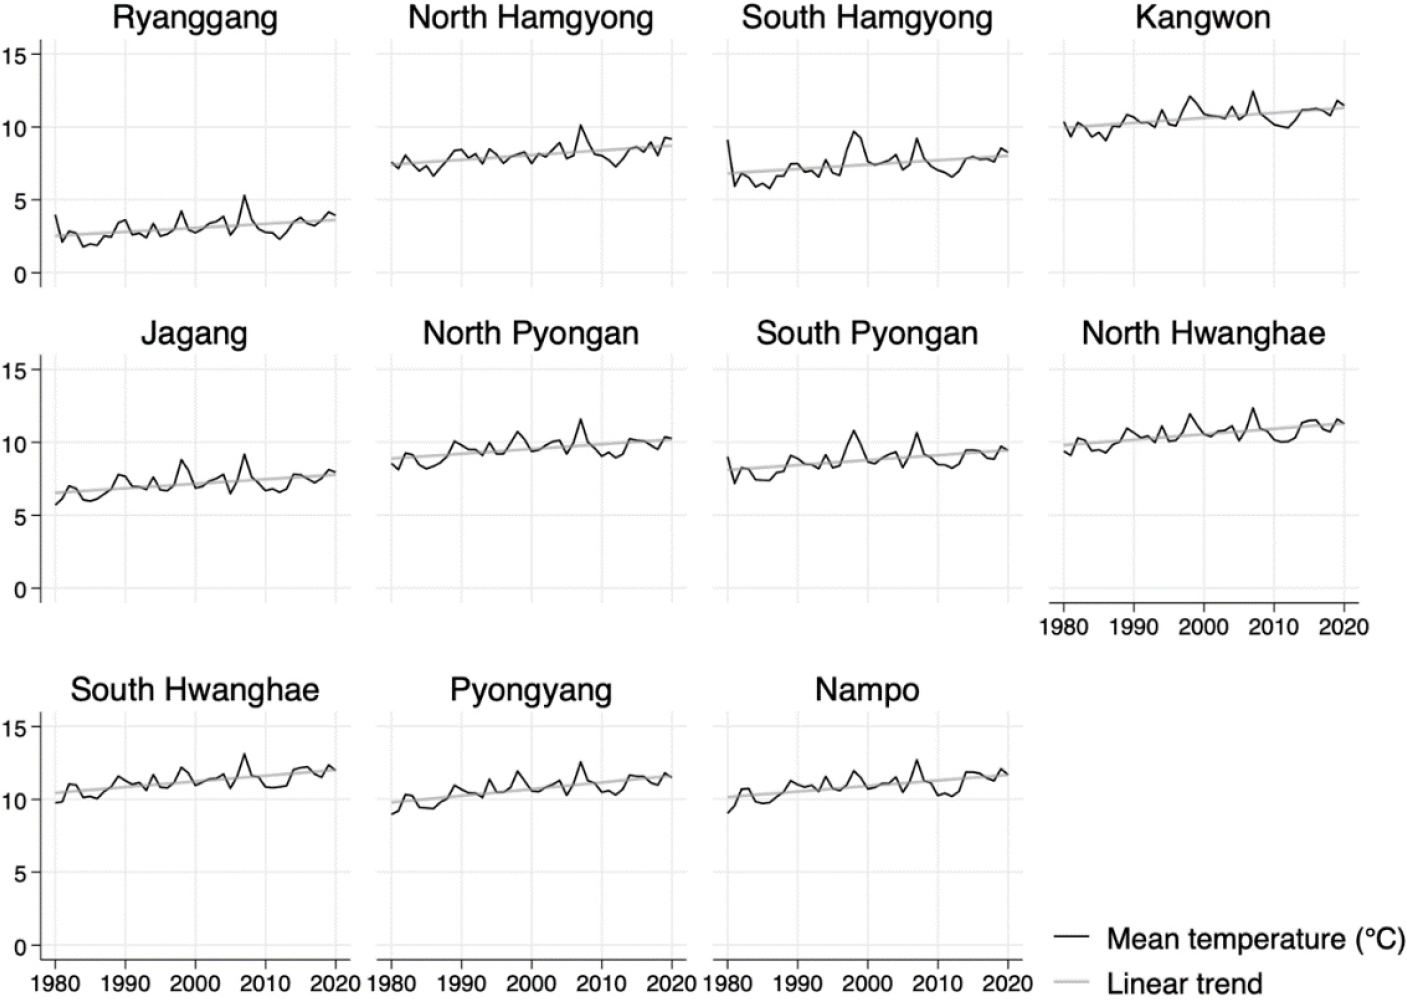
The administrative division of North Korea, based on OCHA (2021), consist of 11 provinces. Weather variables were structured by province and daily data was converted to monthly and subsequently to annual data based on the estimation method of the Korea Meteorological Administration. Fig. 2 displays the trends of average annual temperatures across provinces from 1980 to 2020, indicating a general increase. This trend potentially impacts crop growing conditions and the frequency of extreme weather events. Fig. 3, conversely, showcases cumulative annual precipitation, which, unlike temperature, doesn’t exhibit a pronounced increase.

Growing degree days per period are calculated cumulatively by taking values above the minimum temperature at which crops can be active as . In this equation, , the base temperature, is set to 10 degrees Celsius for the rice and corn analysis. The choice of 10 degrees is due to its relevance to the physiological temperature threshold for active growth in these crops, as indicated in research such as McMaster and Wilhelm (1997) for corn and Song et al. (2021) for rice. and represent the maximum and minimum temperatures for the day , respectively.
For example, if the daily mean temperature is 30 degrees, the accumulated temperature for the day is max(30-10, 0), which is calculated as 20. Conversely, if the average daily temperature is 5 degrees, the accumulated temperature for the day is max(5-10, 0), which is calculated as 0 and is not added to the GDD.
In North Korea, the number of growing degree days (GDDs) with a base temperature of 10 degrees Celsius is mostly greater than zero between April and October, and particularly high between May and September where average temperatures are high as shown in Table 1.
Table 1.
Average monthly growing degree days by province in North Korea (1991–2020) (Unit: degree days)
To analyze the effects of extreme weather events, this study utilized the Standardized Precipitation Index (SPI) and killing degree days (KDD). To examine extreme weather events, previous studies used several different methods. For instance, Cho et al. (2013) used heavy rainfall dummies (above +2σ of the mean) that affect rice yields in South Korea (Cho et al., 2013), and Butler and Huybers (2013) used the killing degree days (KDD) variable for corn in the United States.
The SPI, a drought index, is derived from cumulative precipitation, with the SPI1 index used here to assess short-term precipitation effects. The SPI1 index was formulated using DrinC software, based on monthly cumulative precipitation and assuming a gamma distribution (Tigkas et al., 2015). For our analysis, the SPI index is derived from the cumulative precipitation in a given month over a 40-year period (1981-2020), and the distribution is then standardized to indicate the degree of dryness or humidity as shown in the Table 2. If the SPI is within the range of -1.5 to 1.5, precipitation is moderate, and if it is outside this range, it indicates very dry or wet conditions.
Table 2.
Classification of the standardized precipitation index (SPI)
Source: Tigkas et al. (2015)
To reflect the impact of extreme levels of precipitation (e.g., heavy rains, floods, etc.) on crop production, we calculated a heavy rain dummy (HR = 1 if SPI ≥ 2, 0 otherwise) as a proxy variable using the SPI1 index, i.e., the dummy variable takes the value of 1 for months in which the SPI index indicates extreme wetness and 0 otherwise.
To gauge the effect of heatwaves (exceeding 34 degrees Celsius) on crop production, we generated killing degree days (KDD) calculated as , similar to growing degree days. This means that the difference between 34 degrees and the daily maximum temperature continues to accumulate from day to day and can reflect the extent of high-temperature events over a given period.
For productivity estimation, we include weather variables, extreme weather, and fertilizer input per area (log(FERT)) as explanatory variables. For weather and extreme weather, we calculated monthly growing degree days (GDD), monthly accumulated precipitation (PSUM), heat wave degree days (KDD), and heavy rain dummies (HR) based on the aforementioned data for each province and year in North Korea. The timing of these variables was adjusted for each crop based on their sowing, growing, and harvest seasons, as outlined by the Food and Agriculture Organization of the United Nations and Global Information and Early Warning System on Food and Agriculture (FAO/GIEWS) crop calendar for North Korea in Fig. 4. The sowing season for rice is generally in May, the growing season is from June to September, and the harvest season is in October, and the sowing season for corn is in April, the growing season is from May to August, and the harvest season is in September.

Data on production, planted area, and yield were sourced from various FAO and World Food Program (FAO/WFP) reports and the United States Department of Agriculture (USDA) publications (FAO, 2015, 2021; FAO/WFP, 1999, 2001, 2004, 2008, 2010, 2011, 2012, 2013; USDA FAS, 2020). Given the inconsistent nature of these reports, we meticulously compiled regional data on North Korea’s primary crop production, planted areas, and yields. Fertilizer input data was similarly sourced and averaged the regional distributions of fertilizer use for some years as a regional share of total fertilizer use. Assuming that most of the fertilizer use by province is applied to rice and corn, which occupy the largest areas, we derived the fertilizer use per area as “fertilizer use / (rice area + corn area)”.
Our analysis covered 12 available years (1999, 2001, 2002, 2004, 2008, 2010-2013, 2015, 2017, 2018) and 11 provinces in North Korea. Kaesong City was excluded due to lack of data in certain years.
Table 3 provides a detailed breakdown of regional crop production in North Korea from 1999 to 2018. The average planted area of rice during the period is the largest in South Hwanghae Province, followed by North Pyongan Province. The smallest rice planted area is in Ryanggang Province, followed by Jagang Province. The largest corn planted areas were in South Hwanghae and North Pyongan, while the smallest were in Ryanggang and Nampo.
Table 3.
Average production of primary crops by region in North Korea (1999–2018) (Units: 1,000 ha, 1,000 tonne, tonne/ha)
The size of production generally follows the size of planted area. Rice yields are highest in Pyongyang City, followed by South Pyongan Province, Nampo City, North Pyongan Province, and South Hwanghae Province, but Pyongyang City and Nampo City have smaller areas and yields, so South and North Pyongan Provinces are considered the most productive. Corn yield is highest in Pyongyang City, followed by Nampo City, North Pyongan Province, South Pyongan Province, South Hamgyong Province, and South Hwanghae Province. Similarly, Pyongyang City and Nampo City have the highest productivity due to their small area and production, while North and South Pyongan Provinces have the highest productivity.
Table 4 offers descriptive statistics for the variables used in our analysis. With 12 years and 11 panels (provinces), we had 132 observations. However, due to missing data for Nampo City in two years, the total observations were 130. In the analysis, rice yield averages 3.9 tons/ha and corn yield averages 3.5 tons/ha, which are included as dependent variables in the estimation equation as logarithmic values. Growing degree days (GDD) and killing degree days are in degrees and precipitation is in mm. Fertilizer inputs per area in kg/ha are included in the explanatory variables as logarithmic values.
Table 4.
Descriptive statistics of variables (N = 130)
Results and Discussion
The estimation results in Table 5 reveal significant associations between weather variables, extreme weather events, fertilizer inputs, and crop yields. Notably, models (3) and (6), which incorporate fixed effects with individual slopes, are preferred as they account for unique linear technological trends by region, offering a deeper understanding of regional differences. The adjusted R2 values for models (3) and (6) are higher than those of other models, indicating a better fit.
Table 5.
Yield estimation results of rice and corn in North Korea
| Covariates | Dep. Var.: log(Rice yield) | Dep. Var.: log(Corn yield) | |||||
| (1) | (2) | (3) | (4) | (5) | (6) | ||
| GDDsow | 0.0007 | -0.0007 | -0.0005 | 0.0006 | 0.0006 | 0.0004 | |
| (0.0006) | (0.0006) | (0.0006) | (0.0006) | (0.0006) | (0.0005) | ||
| GDDgrow | 0.0020 | 0.0016 | 0.0017 | 0.0007 | 0.0002 | 0.0003 | |
| (0.0003)*** | (0.0003)*** | (0.0003)*** | (0.0001)*** | (0.0002) | (0.0002) | ||
| GDDharv | -0.0036 | -0.0016 | -0.0010 | -0.0047 | -0.0029 | -0.0029 | |
| (0.0009)*** | (0.0007)** | (0.0008) | (0.0005)*** | (0.0006)*** | (0.0007)*** | ||
| PSUMsow | -0.0001 | -0.0001 | -0.0003 | 0.0020 | 0.0005 | 0.0006 | |
| (0.0007) | (0.0005) | (0.0004) | (0.0003)*** | (0.0002)* | (0.0002)** | ||
| PSUMgrow | 0.0006 | 0.0004 | 0.0004 | 0.0002 | -0.0000 | -0.0000 | |
| (0.0001)*** | (0.0001)*** | (0.0001)*** | (0.0001)** | (0.0001) | (0.0001) | ||
| PSUMharv | -0.0012 | -0.0008 | -0.0011 | 0.0000 | 0.0002 | 0.0002 | |
| (0.0005)** | (0.0004)* | (0.0004)** | (0.0001) | (0.0001)* | (0.0001) | ||
| KDDgrow | -0.0090 | -0.0147 | -0.0131 | -0.0043 | -0.0101 | -0.0102 | |
| (0.0039)** | (0.0031)*** | (0.0038)*** | (0.0044) | (0.0041)** | (0.0038)** | ||
| HRgrow | -0.1719 | -0.1285 | -0.1407 | 0.0732 | 0.0582 | 0.0556 | |
| (0.0702)** | (0.0602)* | (0.0582)** | (0.0595) | (0.0541) | (0.0484) | ||
| log(FERT) | 0.2046 | 0.3708 | 0.4515 | 0.0961 | 0.2365 | 0.2147 | |
| (0.0371)*** | (0.0457)*** | (0.0509)*** | (0.0517)* | (0.0385)*** | (0.0479)*** | ||
| Trend | 0.0217 | 0.0226 | |||||
| (0.0028)*** | (0.0044)*** | ||||||
| F.E. | Yes | Yes | Yes | Yes | Yes | Yes | |
| Trend | No | Yes | Yes | No | Yes | Yes | |
| Ind. Slopes | No | No | Yes | No | No | Yes | |
| Adj. R2 | 0.6273 | 0.7251 | 0.7556 | 0.5579 | 0.6644 | 0.7232 | |
| Within R2 | 0.5374 | 0.6619 | 0.5524 | 0.4436 | 0.5814 | 0.3434 | |
Notes: Clustered robust standard errors are in parentheses. *, **, and *** indicate statistical significance at the levels 10%, 5%, and 1%, respectively. Models (1) and (4) include time-constant panel fixed effects without trend terms, models (2) and (5) include fixed effects with trend terms, and models (3) and (6) include fixed effects with individual slopes as trends.
For rice yields, across models (1), (2), and (3), the coefficient for GDD during the growing season (GDDgrow) consistently exhibited a significantly positive impact at the 1% level, implying that a one-unit increase in GDDgrow is associated with a 0.17% increase in rice yield in model (3), when controlling for other factors. This underscores the importance of optimal temperatures during the growing season for rice cultivation.
However, the GDD during the harvesting season (GDDharv) showed a statistically significant negative relationship with rice yield in models (1) and (2) at the 5% level and corn yield at the 1% level. The coefficients suggest that a one-unit increase in GDDharv is associated with 0.36% and 0.16% decreases in rice yield in models (1) and (2) and 0.47% decrease in corn yield in model (4). These findings suggests that while warmer temperatures benefit the growing season, they might be detrimental during the harvesting period.
Precipitation during the growing season (PSUMgrow) was positively associated with rice yield across all three models at the 1% significance level, indicating that a one-unit increase in PSUMgrow is associated with a 0.04% increase in rice yield in model (3). This highlights the importance of adequate water supply during the growing season. However, precipitation during the harvesting season (PSUMharv) showed a statistically significant negative relationship with rice yield in models (1), (2), and (3), implying that a one-unit increase in PSUMharv is associated with 0.11% decrease in rice yield in model (3). This suggests that precipitation during the growing season is critical for rice cultivation but higher precipitation during the harvesting season might decrease rice yield.
The effects of heatwaves, captured by the KDD during the growing season (KDDgrow) showed a negative impact on rice yield across models (1), (2), and (3) at the 5% significance level, implying that a one-unit increase in KDDgrow is associated with a 1.3% decrease in rice yield in model (3). This suggests that extreme temperatures can adversely affect rice yields.
Fertilizer input consistently showed a positive impact across all three models. This suggests that a 1% increase in fertilizer input is associated with a 0.45% increase in rice yield and 0.21% increase in corn yield, reflecting the critical role of fertilizer in crop productivity.
The trend term, included in models (2) and (5), showed a positive and significant effect on yields, with coefficients of 0.0217 and 0.0226 at the 1% significance level. This suggests that over the years, technological advancements over the years have contributed positively to rice and corn yields.
Table 6 shows the individual slopes from models (3) and (6), offering insights into variations in each province’s agricultural practices, technological advancements, and other unobservable factors. For rice, Jagang province shows the steepest positive slope, indicating rapidly improving rice yields. South Hwanghae, however, has a slight negative slope, suggesting stagnation or decline in rice yields. For corn, Nampo exhibits the steepest positive slope, indicating rapid improvements in corn yields. Ryanggang and South Hwanghae show minimal slopes, suggesting stagnant corn yields over time. These variations in slopes across provinces highlight the varying rates of technological adoption and improvements in agricultural practices. Provinces with steeper positive slopes likely benefit from advanced agricultural innovations and practices.
Table 6.
Individual slopes (technology advances) by region
The estimation results of this study provide valuable insights with significant policy implications for agricultural practices, resource allocation, and climate adaptation strategies in North Korea. The findings underscore the complex interplay between weather variables, extreme weather events, fertilizer inputs, and crop yields, particularly for rice and corn.
The positive association between growing degree days (GDD) during the rice growing season and rice yield, and the negative impact of increased precipitation during the harvest season, highlight the need for targeted crop management strategies. Policymakers and agricultural practitioners should consider implementing seasonal planning strategies that align with weather patterns to optimize growing conditions for rice and developing adaptive harvest timing strategies to mitigate the negative effects of precipitation during the harvest season.
The negative impact of heatwave days during the growing season on both crop yields and heavy rainfall on rice yields emphasizes the importance of investing in climate-resilient agricultural practices and infrastructure to mitigate the effects of extreme weather events and establishing early warning systems to provide timely information on extreme weather events, enabling farmers to take preventive measures.
The positive association between fertilizer inputs per unit area and increased yields for both rice and corn suggests that implementing fertilizer optimization strategies of balancing the need for increased productivity with environmental sustainability and enhancing extension services to educate farmers on the efficient use of fertilizers in combination with appropriate rainfall. It is well known that North Korea faces a severe shortage in fertilizer supply, both in terms of quantity and quality. This result demonstrates the importance of fertilizer supply, alongside climatic factors.
The fixed effects with individual slopes provide a nuanced understanding of rice and corn yields across North Korean provinces. While some provinces exhibit inherently higher yields, others show rapid improvements over time. These insights can guide policymakers in identifying provinces that require targeted interventions and those that can serve as models for agricultural best practices.
Conclusions
This research offers an in-depth examination of the determinants of rice and corn yields in North Korea, revealing significant associations between weather variables, extreme weather events, fertilizer inputs, and crop yields. The findings offer valuable insights for policymakers, researchers, practitioners, and participants in aid to North Korea.
The positive effects of increased GDD during the rice growing season, increased precipitation during the corn sowing season, and fertilizer inputs per unit area on yields underscore the potential for enhancing crop productivity in North Korea. Conversely, the negative impacts of increased precipitation during the rice harvest season, heatwave days, and heavy rainfall during the growing season highlight the challenges posed by weather extremes.
The policy recommendations derived from this study stress the importance of tailored interventions, encompassing seasonal planning, harvest timing strategies, resilience against climate change, efficient fertilizer use, technological adoption, and province-specific strategies. These measures can improve sustainable agricultural practices, ensuring food security and economic stability in North Korea.
In conclusion, this research enriches the existing literature on North Korean agriculture, offering empirical insights that can guide policy and practical decisions. The study underscores the need for a multifaceted understanding of the interplay between climate, technology, inputs, and yields, setting the stage for innovative solutions tailored to North Korea’s unique circumstances. Continued research and international collaboration are essential to deepening our understanding of this vital topic. In future research, a more detailed analysis of the factors contributing to yield improvements will significantly enhance the implications for North Korea’s agricultural policy, particularly by focusing on regions that have experienced advancements in agricultural yields.
This study has limitations that should be acknowledged. The reliance on limited public data might have restricted the analysis’s depth. The province-level focus might not capture the full spectrum of agricultural practices within provinces. Future research should aim for more extensive data collection, possibly through collaborations with local and international entities. Delving into micro-level analyses, such as farm or community studies, can offer a more granular understanding of the factors influencing crop yields.
