

Introduction
Experimental method
Recall questionnaire experiment through online survey
Analysis of differences in the utilization rate of food labeling according to the content of knowledge provided
Analysis of differences in food labeling utilization rates according to the characteristics of items
Estimation method and data
Analysis of differences in food labeling utilization rates according to the content of prior knowledge
Analysis of differences in food labeling utilization rates according to the characteristics of items
Analysis result
Analysis of differences in food labeling utilization rates according to the content of prior knowledge
Analysis of differences in food labeling utilization rates according to the characteristics of items
Conclusion
Introduction
Information asymmetry in the market economy can be one of the factors that negatively affect consumers (Kim et al., 2014). The food labeling system is a system that provides food information necessary to consumers to resolve this information asymmetry. The use of the food labeling system enables consumers to easily grasp the attributes of food and at the same time exercise the right to know, one of the sovereignty of the people.
However, the purpose of the food labeling system may not be fully realized due to the complicated method of providing food information and the lack of awareness of consumers. In this respect, the lack of consumer awareness of food labeling and poor use of food labeling can be pointed out as a problem of the food labeling system. If consumers do not confirm or do not understand the food labeling system, it may be difficult to assess that the food labeling system has fulfilled its intended purpose, and it may be difficult to create additional economic value. Therefore, the use of food labels by consumers has very important economic and policy implications, and research on the use of food labels by consumers is required.
To find out whether consumers actually use food labeling, many previous studies have used a survey method asking consumers whether to use food labeling. However, due to the limitations of the survey method, there can be biased results in the utilization rate of food labels in these studies. In previous studies on the utilization rate of food labeling (Bleich et al., 2015; Zhang et al., 2017; Christoph et al., 2018; Bonanni et al., 2013; Grunert et al., 2010), the utilization rate of food labeling showed a wide difference from 24.5% to 76%.
These differences in the degree of use of food labels may vary depending on the country, product, and social factors, but may occur due to the limitations of the investigation method due to the inaccuracy of the virtual experiment. The hypothetical situation can make the possibility or incentive to give an artificial response in the direction the subject wants than the actual situation (Lee et al., 2015). This means that there is a possibility that the subject will respond positively if the given situation is perceived as good, and respond negatively if it is perceived as bad. Therefore, the results of hypothetical experiments can lead to biased results.
Therefore, in order to accurately evaluate whether the original purpose of the food labeling system is being properly achieved, a method that can reduce the measurement bias of the existing questionnaire survey method and measure the utilization rate of food labeling more precisely will be needed. If we can more accurately measure how much consumers actually use food labeling, it will be of great help in understanding and improving the utilization rate of food labeling from a policy perspective.
Therefore, in order to understand the utilization rate of food labeling by reducing the measurement bias compared to the existing research, this study attempts to measure the utilization rate of food labeling through simple purchase situation experiment and recall questionnaire experiment. The recall question here refers to the experimenter asking the participant to respond to the question by reminding the situation given at the time of the action after the participant has performed a specific action. At this time, as the time point of questioning the participant is far from the time point of action, the reliability of the data obtained through the recollection questioning experiment is likely to decrease (Philip et al., 2008). Therefore, this study first conducted a purchase situation experiment in which the participant can use the food label, and immediately used a recall questionnaire experiment in which the participant was asked to confirm whether or not the food label was used.
Using this purchase situation experiment and recall questionnaire experiment, this study aims to measure the utilization rate of food labeling by reducing the measurement bias, and to derive implications for promoting the food labeling system from the perspective of consumers. To this end, the analysis performed in this study along with the purchase situation experiment and recall questionnaire experiment are as follows. First, in order to find out what kind of knowledge provision is useful to increase the utilization rate of food labeling by consumers, this study analyzed the food labeling utilization rate according to the difference in prior knowledge. Second, this study analyzed whether there is a difference in the food label utilization rate of consumers according to the characteristics of the item.
The reason this study proceeds with such an analysis is that there have been no studies on the types of knowledge provided and the characteristics of items that have an effect on the use of food labeling in previous studies. Existing studies have analyzed the relationship between specific information or knowledge and the use of food labeling, but no analysis has been made on how different the use of food labeling depends on the type of knowledge. For example, Cavaliere et al. (2017) studied the relationship between the Italian health guide program and consumers’ use of food and nutrition information labeling, and it was analyzed that the health guide program was an effective factor in enhancing the consumer’s use of food labeling. In addition, Cho and Yoo (2007) studied the nutritional knowledge and food nutrition labeling of high school girls, and found that there was a significant correlation between the level of nutrition labeling confirmation and nutritional knowledge. However, there is a limit to grasping what kind of knowledge is more useful to increase the utilization rate of food labels by consumers from these studies. On the other hand, it was found that no research on the relationship between the characteristics of items and the use of food labels has been conducted. In a study on middle school students’ preference for processed foods and the use of food nutrition labeling (Park et al., 2008), they investigated the processed foods that middle school students prefer and analyzed whether middle school students use the food labeling of the item. The analysis of whether consumers’ use of food labeling is different according to the characteristics of items has not been conducted.
In complementing the limitations of these preceding studies, the results of this study are considered to provide additional useful information in terms of government food-related policy establishment and corporate market analysis.
Experimental method
Recall questionnaire experiment through online survey
The purchase situation experiment and the recall questionnaire experiment in this study are an experiments in which the participant responds to the question by reminding the subject about the situation given at the time of the purchase action after the participant has made a purchase action in a given situation. This study was conducted in August 2018 in an online survey of consumers across the country.
In this study, first, a product picture was provided on the screen and the product purchase decision was made. In order to reduce the bias that occurs when there is no actual payment in the purchase situation and when the purpose of the experiment is recognized by the experiment participant in advance, this study encourages subjects to participate in the purchase situation experiment without any prior mention of food labeling. The experiment was designed so that 10% of randomly selected participants actually purchase the product. The actual purchase cost of the product was paid by subtracting the product price from the participation fee (10,000 won), and the product was mailed to the participants.
In this study, the product photos disappeared on the screen after the experiment participants made a purchase choice for a product. When the product picture disappears, a question is provided. The recall question experiment was designed to display all the information (brand, country of origin, price, nutrition labeling, organic certification labeling, GMO labeling, etc.) remembered about the presented product in the purchase selection situation. This recall questionnaire experiment allows participants to grasp how much food labeling is perceived by participants in the purchasing selection process.
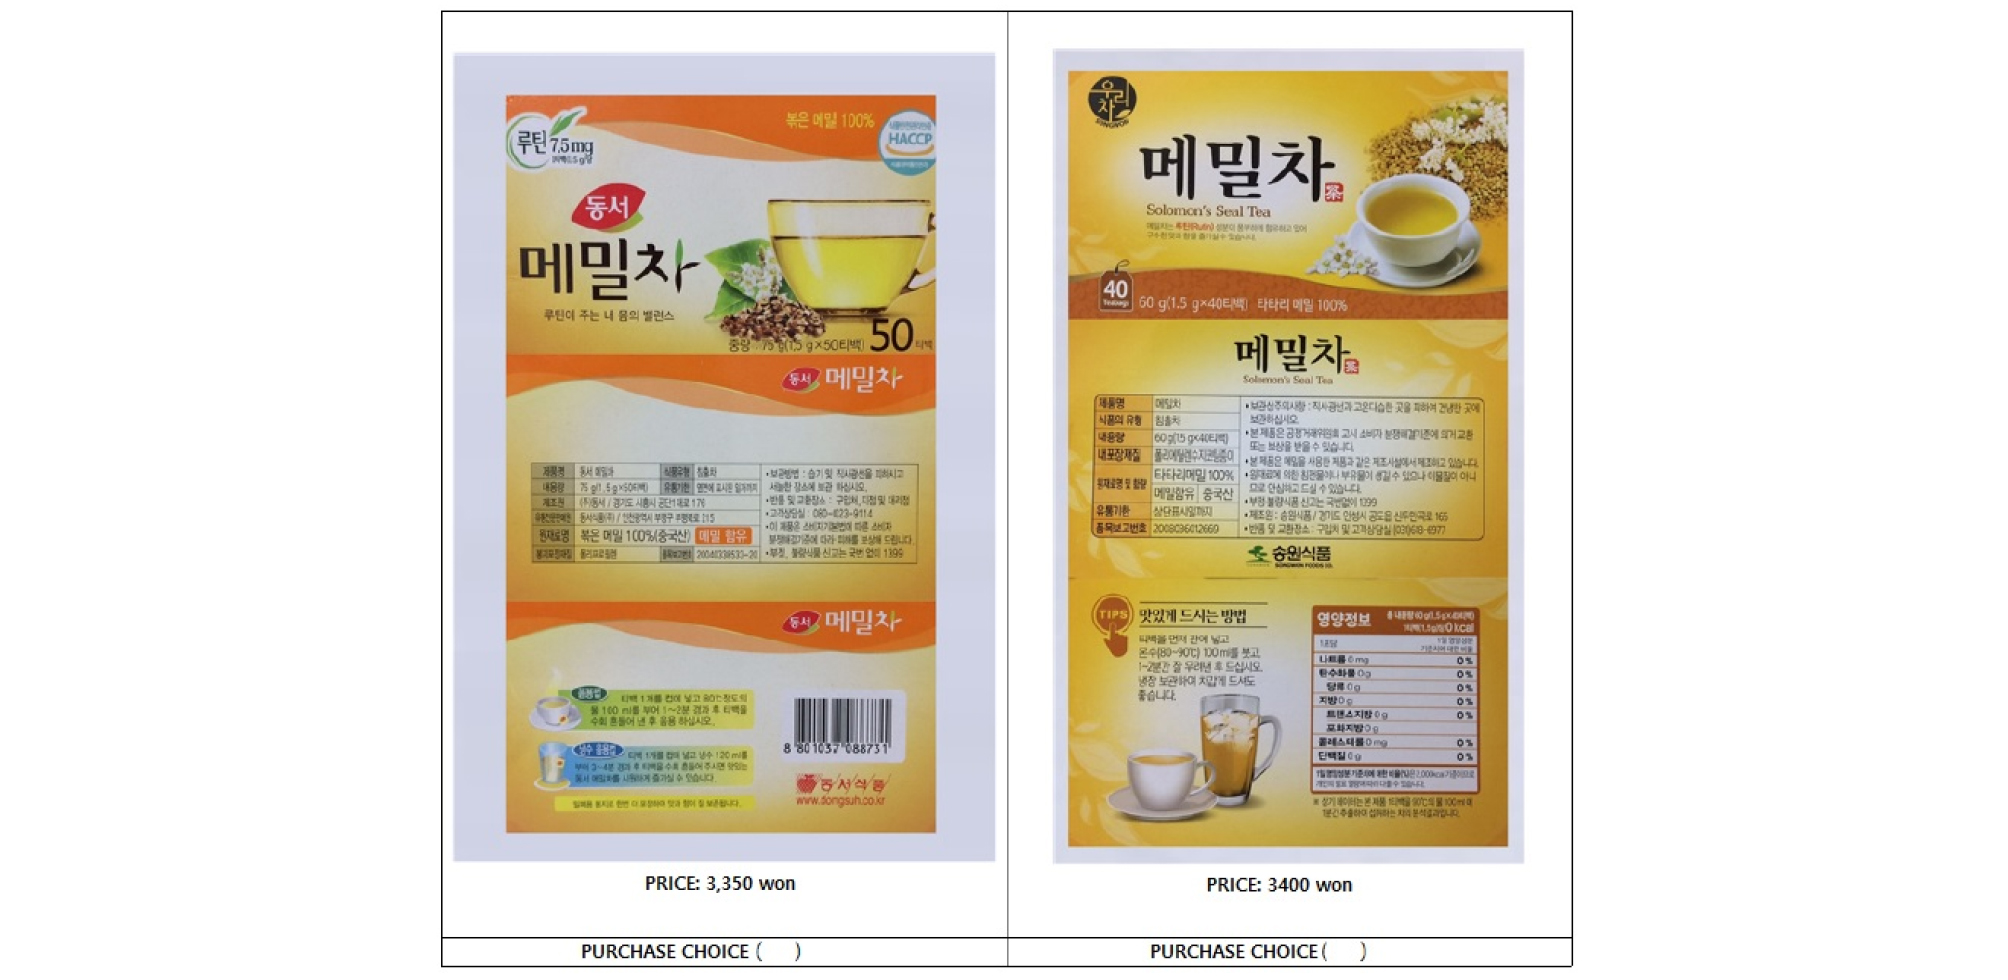
On the other hand, if only one product with a food label on the screen is provided, participants can recognize the food label more easily than when actually purchasing the product. Therefore, this study designed an experiment providing pictures of various products with different brands, designs, prices, and food labeling so that participants can choose whether to purchase under conditions similar to the actual purchasing environment. All products used in the experiment consist of products that can be encountered in the actual market, and actual price information of each product is provided together.
Also, whether or not food labeling is used in product selection may be related to consumers’ preferences toward time. Therefore, this study included a questionnaire that measures the preference of the experiment participants to the time in order to analyze the food label utilization rate by grasping consumers’ preference toward time. In this study, participants were presented with the amount that they could receive after 1 month and the amount that they could receive after 13 months as 20 options, whose discount rate decreases as the order goes backward, and make the participant selects 20 options. This study evaluated the participant’s preference toward time at the point where the participant’s choice changed during the participant’s sequential selection of options. In other words, a participant whose choice was changed at a point close to the last one of the 20 options was considered as a participant with low value for time.
This study was organized by dividing the online survey into three parts. The first part of the survey consisted of a participant’s selection of purchased products and a recall questionnaire, and the second part consisted of a survey of participants’ demographic information, and the last part consisted of a questionnaire that measures the participants’ preference toward time.
Analysis of differences in the utilization rate of food labeling according to the content of knowledge provided
In order to find out what kind of knowledge provision is useful to increase the utilization rate of food labeling, this study provided promotional videos for certification labeling, medical knowledge, and health knowledge and asked participants to choose whether to purchase one product among multiple products. In the next step, a recall questionnaire experiment was conducted to find out which food label participants remembered.
Before presenting product photos to participants, this study randomly classified participants into four groups. Among the four groups, the first group provided health-related knowledge, the second group provided medical-related knowledge, the third group provided a promotional video for the certification label, and the fourth group provided no knowledge. The contents of knowledge provided to participants in this study are shown in <Table 1>.
Table 1.
Information provided by the groupThis study focused on the use of certification labels (antibiotics and HACCP) of participants in this experiment. It was measured whether the indication was accurately memorized. At this time, if the participant correctly memorized the certification label on the purchased product, this study considered it as the participant used the food certification label. On the other hand, if the participant answered that they remembered the information that was not in the actual product, the participant was treated as not using the food label. In addition, this study recorded the number of times participants accurately indicated each product’s certification label for each participant.
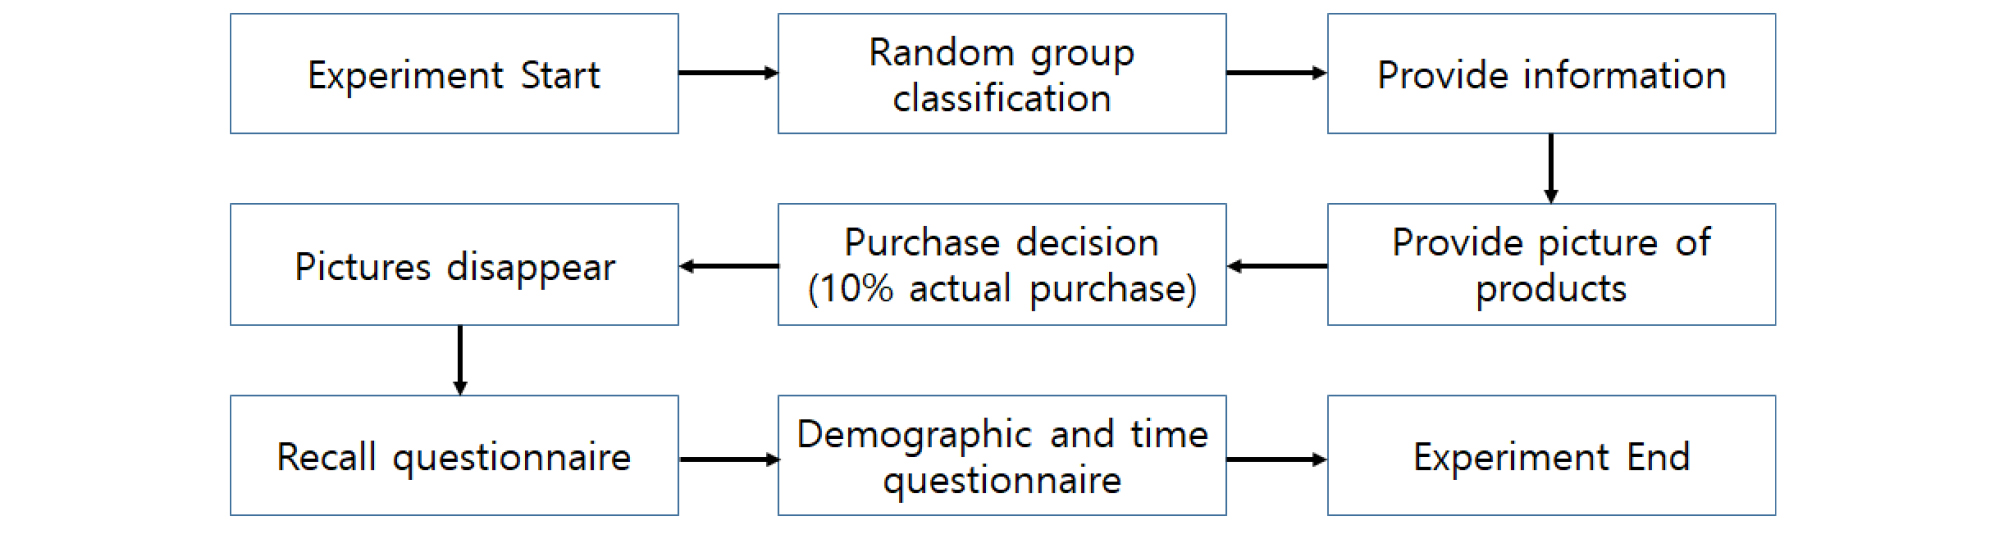
After the participant’s purchase choice and recall questionnaire experiment, this study presented participants a questionnaire consisting of questions about demographic information and questions that measure their preference toward time. The development of the experiment designed in this study to analyze the difference in the utilization rate of food labeling according to the content of knowledge provided is summarized as shown in <Fig. 2>.
Analysis of differences in food labeling utilization rates according to the characteristics of items
In order to find out whether there is a difference in the utilization rate of food labeling among consumers according to the characteristics of the item, this study first asked the participants of the experiment to choose whether to purchase or not purchase various products by item. After the participants selected whether or not to purchase a product, this study conducted a recall questionnaire experiment to find out whether or not they remember a specific certification label (antibiotic-free, HACCP).
This study established the following three hypotheses as it was determined that consumers’ use of the certification label may differ depending on the characteristics of the item. The first hypothesis is that in the case of products that are repeatedly purchased frequently, the utilization rate of the certification label is low, and the second hypothesis is that the utilization rate of the certification label is high for fresh food, and the last hypothesis is that the utilization rate of the certification label is low for cheap products.
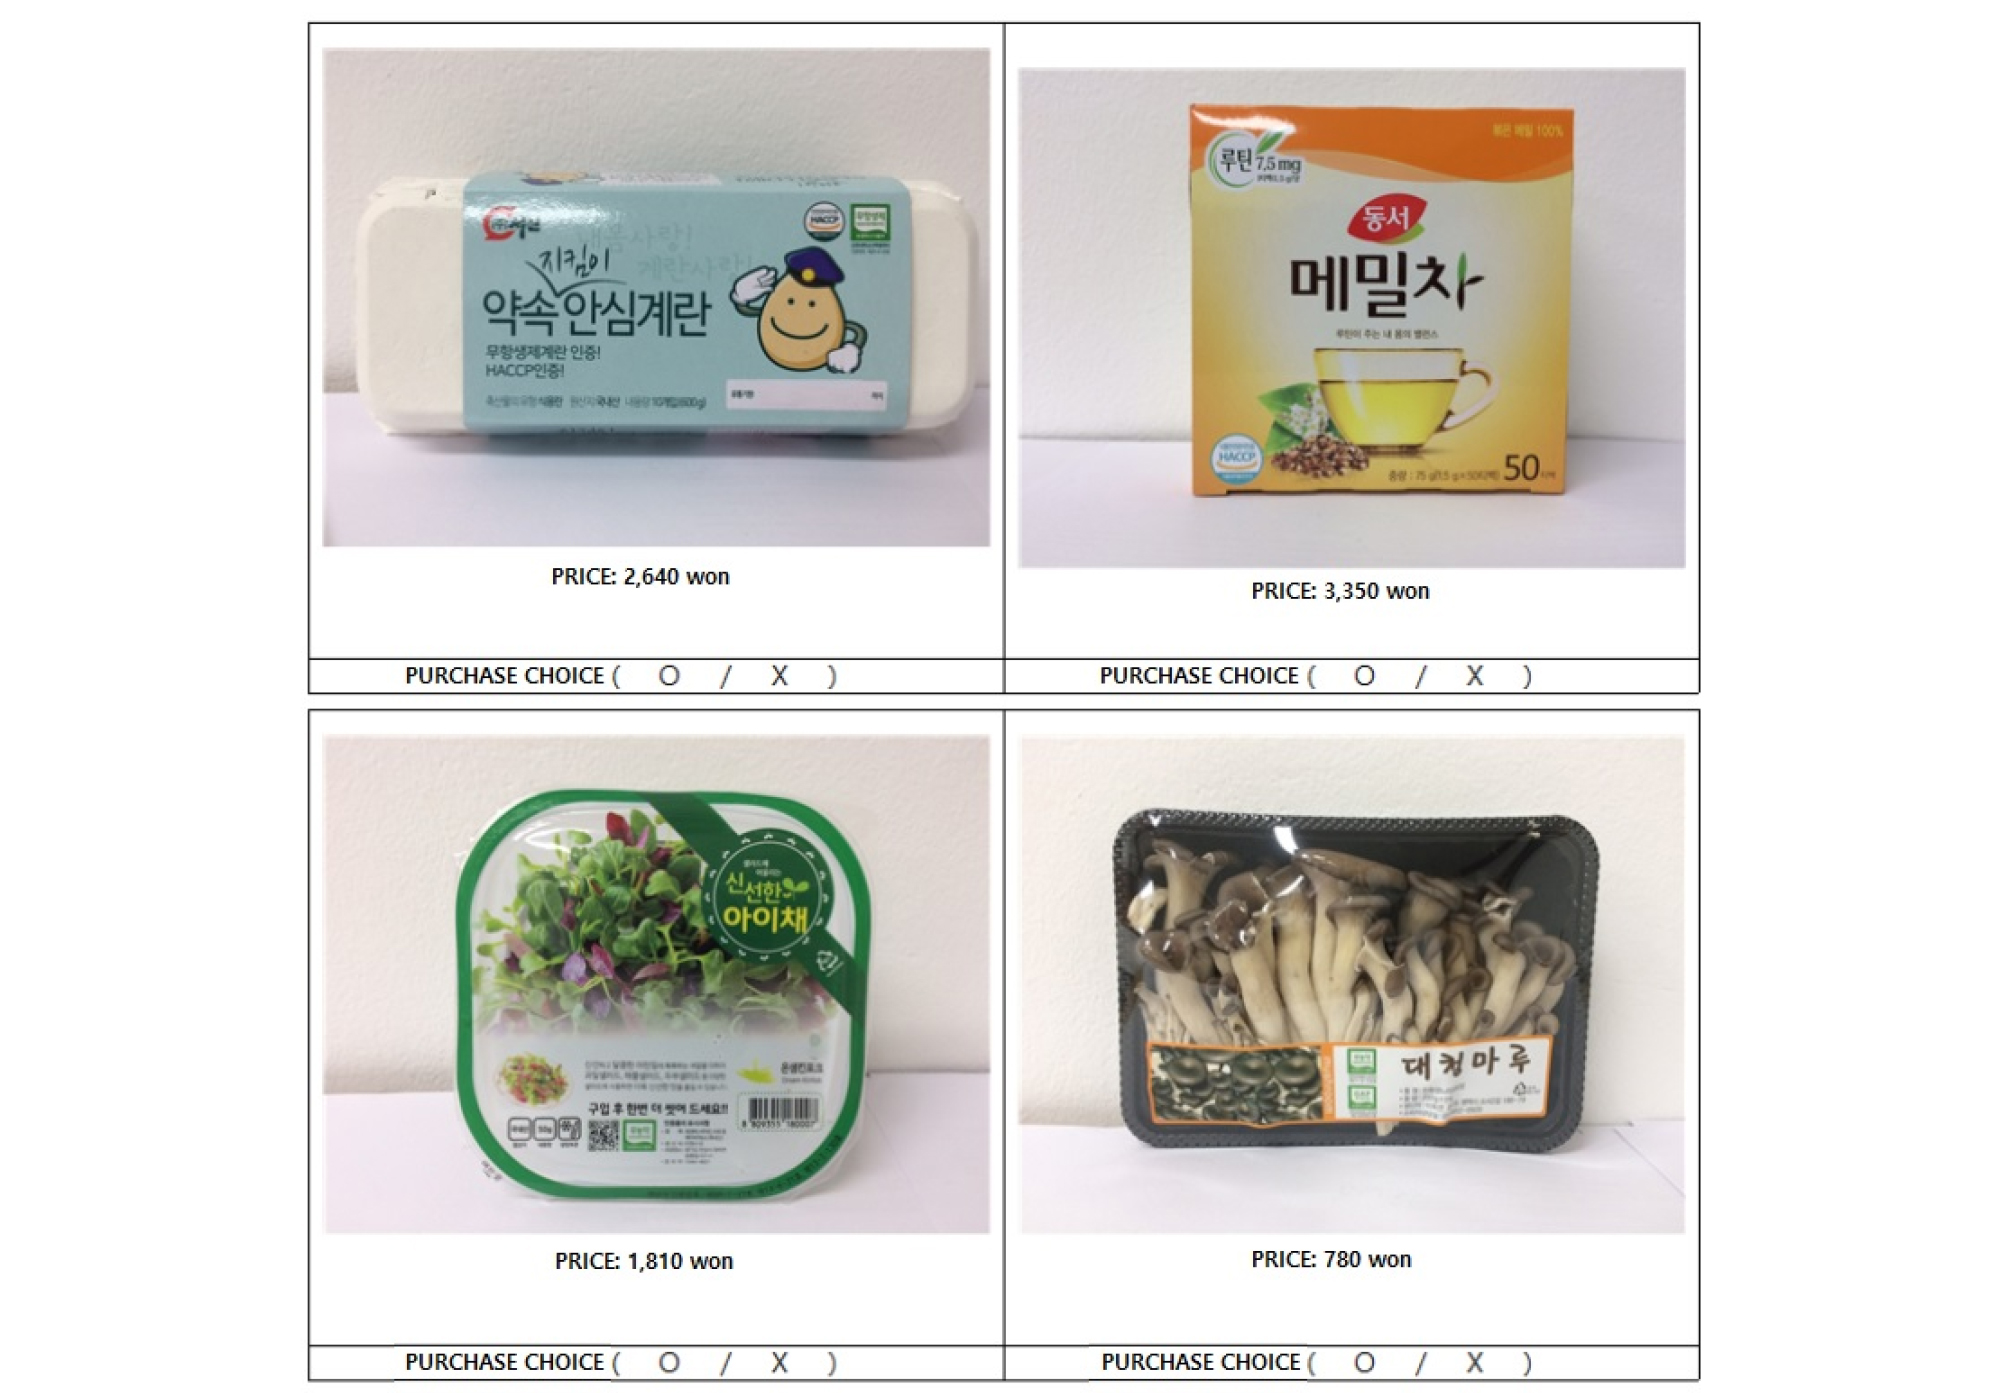
For the experiment, in this study, actual products were photographed and tested by selecting eggs, buckwheat tea, young leaf vegetables, oyster mushrooms, bean sprouts, cheese, sesame leaves, sesame oil, and acorn jelly, which are representative products suitable for the experiment and have many products marked with the certification label. Those products were presented to the participants as <Fig. 3>.
In addition, in order to verify the first hypothesis that the label utilization rate is low in the case of products that are frequently purchased repeatedly, this study investigated the purchase frequency of each item through a questionnaire.
This study measured whether participants remember the certification label actually displayed on each product through a recall questionnaire experiment. First, this study showed participants pictures of products with different product characteristics for 10 seconds. Each participant chose whether or not to purchase for three products randomly selected from a total of nine different products. After the purchase selection was completed and the product picture on the screen disappeared, this study required participants to display information (brand, country of origin, price, nutrition labeling, organic certification labeling, GMO labeling, etc.) they remember about the product given in the selection situation set. Through this, this study will be able to determine how much the participants perceive the certification label in the purchase selection process and whether there are significant differences for each product.
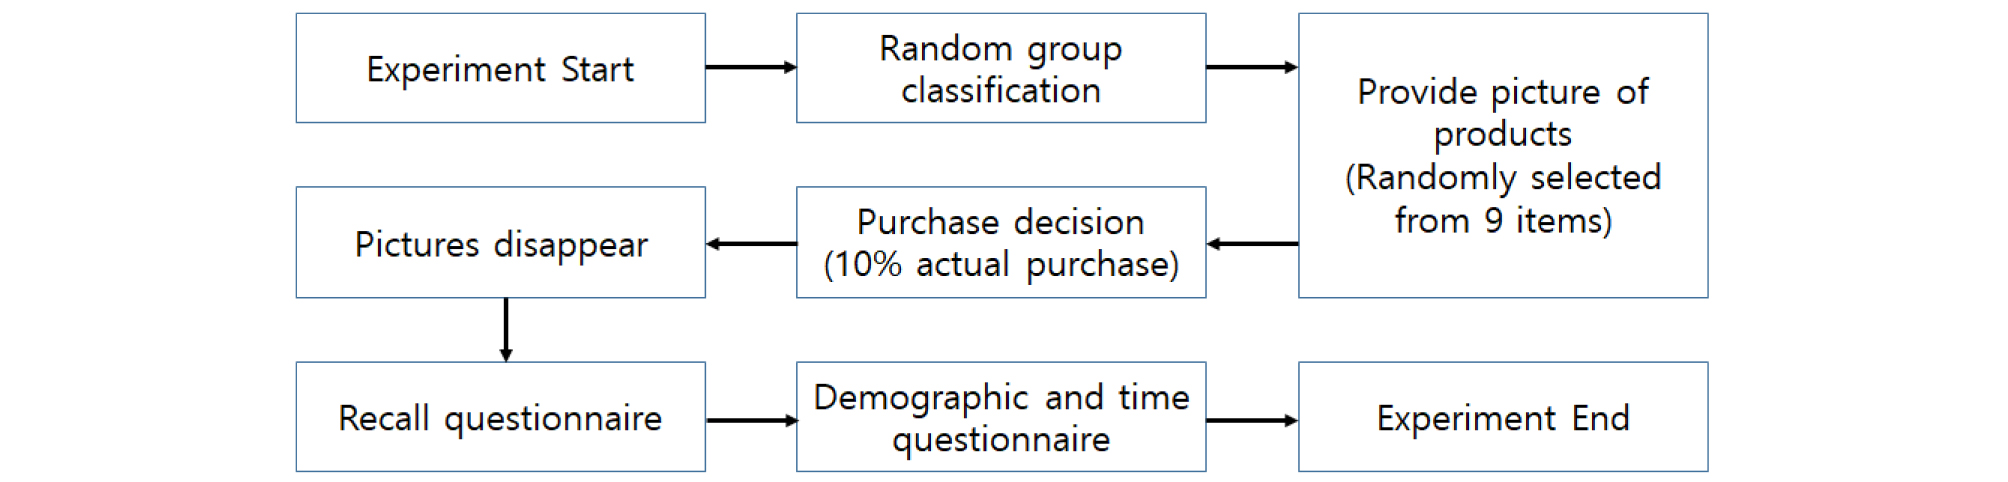
In this experiment, if the participant accurately remembered the food certification label displayed on each product presented to the participant, it was considered that the participant used the food certification label. The experimental development of the analysis of the difference in the utilization rate of food labeling according to the characteristics of items performed in this study can be summarized as shown in <Fig. 4>.
Estimation method and data
Analysis of differences in food labeling utilization rates according to the content of prior knowledge
Estimation method
In the analysis of the difference in the utilization rate of food labeling according to the content of prior knowledge, the dependent variable has a value ranging from 0 to 3 as many as the number of each product’s certification labels remembered by each participant. Since the dependent variable has left and right cutoff values of 0 and 3, a two-limit tobit model can be used as an analysis model. Also, because the dependent variable has a ranking, an ordered logit model also can be considered.
First, in the two-limit tobit model, the continuous latent variable consists of an explanatory variable vector , a coefficient vector , and an error term . Here, the error term is set to . The value that we can observe considering the latent variable in the two-sided truncation of 0 and 3 can be expressed as Equation (1).
Here, li and ui refer to the left-censoring limit and the right-censoring limit, respectively. From Eq. (1), the likelihood function L, consisting of β and the standard deviation σ of the error term, is obtained as Eq. (2) (Qingbin et al., 1997).
In Equation (2), and refer to the standard normal cumulative distribution function and the standard normal density function. To estimate the Tobit model, a log likelihood function is created from Equation (2), and parameter estimates are obtained through the maximum likelihood estimation method that maximizes the log likelihood function. At this time, the coefficient β estimated in the Tobit model represents the marginal effect on the mean of the latent variable (Signe et al., 2008).
| $$\frac{\vartheta E(y_i^\ast\vert x_i)}{\vartheta x_i}=\beta$$ | (3) |
In addition, the ranking logit model can also be used for analysis because the order between the dependent variables has meaning. When j is selected within a certain range, the relationship between the continuous latent variable that cannot be observed and the observable yi can be expressed as Equation (4).
In Equation (4), β and xi refer to the coefficient vector and the explanatory variable vector, and the error term is assumed to be a logistic distribution. to indicate the cutoff point of . In the ranking logit model, the probability that consumer i chooses j is expressed as follows.
In Equation (5), means the cumulative logit distribution function of the error term . The likelihood function for estimating the ranking logit model can be less as shown in Equation (6) (Baek and Kang, 2008).
| $$L(\delta,\beta)=\prod_j\prod_{y_i=j}\;\Pr(y_i=\;j\;\left|\;x_i)\right.\\\;\;\;\;\;\;\;\;\;=\prod_j\prod_{y_i=j}\left[F(\delta_j-\beta'x_i)-F(\delta_{j-1}-\beta'x_i\right]$$ | (6) |
For ranking logit model estimation, after obtaining the log likelihood function from Equation (6), the parameters are estimated through the maximum likelihood estimation method that maximizes the log likelihood function. Meanwhile, the marginal effect of explanatory variable xi on the probability that consumer i will choose j in the ranking logit model estimation can be expressed as Equation (7).
Here, means the logit distribution function, which is the first derivative of . Meanwhile, the sign of the marginal effect of the explanatory variable may appear opposite to the estimation coefficient E depending on the value of . However, if is estimated to be a positive (+) sign, the probability that is in the lowest category () decreases as increases by 1 unit, and the probability that is in the highest category () increases as increases by 1 unit.
This study assumes that consumers’ use of the certification label will differ according to their prior knowledge (treatment effect), age, gender, income, and preference toward time, and the model is set up as shown in Equation (8).
| $$Y_i^\ast=\beta_0+\beta_1age_i+\beta_2sex_i+\beta_3icm_i+\beta_4time_i+\beta_5Tmedical_i+\beta_6Thealth_i+\beta_7Tvideo_i+\varepsilon_i$$ | (8) |
Here, is age, is gender, is average monthly personal income, is preference toward time, and , , and are variables representing medical knowledge, health knowledge, and promotional video treatment effects, respectively.
Data
<Table 2> summarizes the survey results obtained from participants in the food labeling utilization rate experiment according to the content of prior knowledge. When looking at the ratio of male and female participants out of 617 participants, it was found that male participated slightly more than female at 52.8%. In addition, 29.5% of participants in age 40s participated in the survey, which was 10.4%p higher than those in age 20s. When looking at the participants in terms of monthly average personal income, the proportion of participants with incomes ranging from 2 million won to 2,99 million won was the highest at 22.4%. As a result of measuring the preference toward time of the experimental participants, 54.3% of the participants were considered as participants with relatively low value for time.
Table 2.
Participant (Sample) statistics Unit: persons,%Analysis of differences in food labeling utilization rates according to the characteristics of items
Estimation method
Participants in the food labeling utilization rate experiment according to the characteristics of the item may remember only a part of each certification label on the three products, may remember all, or may not remember all. Therefore, although there are both explanatory variables unique to each individual and explanatory variables unique to each alternative, the dependent variable cannot be divided into mutually exclusive categories, so in this analysis, the logit model was used rather than a polynomial model.
Assuming that there is a continuous latent variable that determines whether consumer i uses the certification label of product j, the dependent variable can be expressed as follows.
| $$y_{ij}^\ast=\beta'x_{ij}+\varepsilon_{ij}\\y_{ij}=1\;\mathrm{if}\;y_{ij}^\ast>0\\y_{ij}=0\;\mathrm{if}\;y_{ij}^\ast\leq0$$ | (9) |
In Equation (9), is an explanatory variable vector that affects consumer i’s use of the certification label of j product, is a coefficient vector, and is an error term. At this time, it is assumed that the error term follows a logistic distribution. Consumers’ use of certification labels is expressed as Equation (10) assuming logistic distribution.
| $$p_{ij}=\Pr(y_{ij}=1\vert x_{ij})=\frac1{1+e^{-(\beta'x_{ij})}}$$ | (10) |
Here, means the probability that consumer i uses the certification mark of product j, and H means that consumer i has used (remembered) the certification label of product j. Conversely, the probability that consumer i does not use the certification label of product j is as shown in Equation (11).
| $$1-p_{ij}=\Pr(y_{ij}=0\vert x_{ij})=\frac1{1+e^{(\beta'x_{ij})}}$$ | (11) |
On the other hand, the likelihood function of the logit model can be written as follows.
| $$L(\beta)=\prod_{ij}(p_{ij})^{y_{ij}}(1-p_{ij})^{1-y_{ij}}$$ | (12) |
For logit model estimation, the log-likelihood function is obtained from Equation (12), and the coefficient that maximizes the log-likelihood function is obtained through the maximum likelihood estimation method. On the other hand, the probability that consumer i uses the certification mark of j product against the probability that consumer i does not use the certification mark of j product is as Equation (13).
| $$\frac{p_{ij}}{1-pij}=\frac{1+e^{(\beta x_{ij})}}{1+e^{-(\beta x_{ij})}}=e^{(\beta x_{ij}^{})}$$ | (13) |
If we take the logarithm of both sides of Equation (13), it is summarized as Equation (14).
| $$\mathrm{In}\left(\frac{p_{ij}}{1-p_{ij}}\right)=\beta'x_{ij}$$ | (14) |
Equation (14) shows the relationship between the case where the probability of using the certification label is higher than that of the consumer i not using the certification label of product j and the explanatory variables that affect it. On the other hand, the marginal effect of explanatory variable on the probability p _{ij} that consumer i uses the certification label of product j may be small as shown in Equation (15).
This study assumes that consumers’ use of the certification label differs according to their age, gender, income, and preference toward time and the characteristics of the product (purchase frequency, price, whether or not processed food), and the model is set as shown in Equation (16).
| $$\ln\frac{p_{ij}}{1-p_{ij}}=\beta_0+\beta_1age_{ij}+\beta_2sex_{ij}+\beta_3icm_{ij}+\beta_4time_{ij}+\beta_5often_{ij}+\beta_6price_{ij}+\beta_7processed_{ij}+\varepsilon_{ij}$$ | (16) |
Here, is the age of participant i in the experiment in which the product was used, is the gender, is the average monthly personal income, and is the preference toward time. In addition, is the frequency of purchase, is the price of the product, and is a variable indicating whether or not processed foods are processed.
Data
Sample statistics of participants in the food labeling utilization rate experiment according to the characteristics of the item are shown in <Table 3>. Looking at the ratio of male and female participants out of the total 620 participants, it was found that male participated slightly more than female at 52.6%. In addition, in terms of age distribution, participants in 40s participated in this experiment the most with 27.6%. When looking at the average monthly personal income of the participants in the experiment, the proportion of participants with incomes ranging from 2 million won to 2.99 million won out of the total participants was the highest at 21.6%. As a result of measuring the preference toward time of the experiment participants, the proportion of participants with a high value for time and those with a low value for time out of the total participants showed similar levels.
Table 3.
Participant (Sample) statistics Unit: persons,%Analysis result
Analysis of differences in food labeling utilization rates according to the content of prior knowledge
<Table 4> shows the results obtained through the recall question experiment of the food label utilization rate experiment according to the contents of prior knowledge. The memory level refers to the number of certification marks that the participants of each experiment correctly memorize among the certification marks displayed on the products (eggs, buckwheat, cheese) presented in three selection situations, 0 is the value when not remembering any, and 3 is the value when remembering all of them.
Table 4.
Utilization rate of certification label according to differences in prior knowledge Unit: persons, % in parenthesesIn the case of memory level of 3, the group that provided the food certification label promotional video was greater than the group that provided medical and health information. And when the memory level is 0, the group that provided the food certification label promotional video was smaller than the group that provided medical information and health information.
<Table 5> is the result of estimating the data obtained through the experiment on the utilization rate of food labeling according to the content of prior knowledge by the two-limit tobit model and the ranked order logit model. As a result of the estimation, it was found that the use of certification labels was higher for female than for male. In the case of female, it can be interpreted that when purchasing food, they look at the product more carefully than male.
Table 5.
Estimated coefficients and marginal effects of the two-limit Tobit and ordered logit modelsIn the case of providing medical knowledge and health knowledge, it was analyzed that it did not have an effect on improving the utilization rate of the certification label. This is interpreted as having insufficient aspects for stimulating consumers to actually use food labeling through these medical and health knowledge provided in the short term. However, in the case of providing promotional video, there was a significant positive (+) relationship with the certification label utilization rate. This means that it is necessary to provide more direct and visual information to improve the utilization rate of certification labels. Therefore, it seems necessary to find a way to allow consumers to be more exposed to promotional videos related to food labeling.
Analysis of differences in food labeling utilization rates according to the characteristics of items
<Table 6> shows the participants’ food certification label utilization rate obtained from the recall questionnaire experiment of the food label utilization rate experiment according to the characteristics of the item. In the case of sesame oil and acorn jelly, the utilization rate of the certification label was relatively low compared to other items. In particular, eggs showed the highest utilization rate of the certification label compared to other items. In terms of the use of the certification label for other items except buckwheat tea and salad, the use rate of the certification label by female was higher than that of male. In addition, the utilization rate of the certification label for fresh food was slightly higher than that of the processed food.
Table 6.
Statistics on the utilization rate of certification labels according to the characteristics of the items Unit: KRW, %<Table 7> shows the results of estimating the data obtained through the experiment on the utilization rate of food label according to the characteristics of the item. As a result of the estimation, it was found that the older consumers, the higher the tendency to use the certification label. This is a different result from the analysis of the utilization rate of food label according to the content of prior knowledge. Therefore, it is necessary to take a cautious approach to interpreting the estimation results as examining food in more detail by older consumers than younger consumers. However, if there is no prior knowledge, it can be inferred that older consumers tend to look at food in more detail when purchasing food. On the other hand, female have a higher tendency to use certification labels than male. This is the same result as the result of analyzing the utilization rate of the certification label according to the difference in prior knowledge.
Table 7.
Estimated coefficients and marginal effects of the logit modelThis study established three hypotheses by judging that there is a possibility that consumers’ use of the certification label may differ depending on the characteristics of the item. As a result of the verification of the three hypotheses, it was found that the use of the certification label was low in the case of products that are repeatedly purchased frequently. This can be interpreted as the fact that consumers already have sufficient confidence in the products they purchase frequently, so that consumers do not carefully look at food labels than products that they do not purchase often. In addition, processed foods were analyzed to have a lower utilization rate of the certification label compared to fresh foods. In the case of fresh food product brands, there are aspects that are less well known to consumers than processed food brands, so when purchasing fresh food, consumers purchase using certification labels or other food labels rather than the tendency to purchase products by trusting only the brand of fresh food. Therefore, the estimation result of this study can be interpreted that the utilization rate of the certification label appears higher in the case of fresh food than that of processed food. On the other hand, it was analyzed that the relationship between the price of the product and the utilization rate of the certification label was not significant.
Conclusion
This study attempted to investigate the utilization rate of food label with reduced measurement bias using recall questionnaire experiments, and to derive implications for promoting the food labeling system from the perspective of consumers. To this end, this study analyzed the food label utilization rate according to the difference in prior knowledge and whether there was a difference in the food labeling utilization rate of consumers according to the characteristics of the item.
As a result of the study, it was analyzed that female use food certification more often than male. In addition, female participants were found to remember food certification labels relatively more accurately than male participants. This is consistent with the results of the Korea Rural Economic Research Institute (2018) that male check food labels less than female.
In the case of medical knowledge and health knowledge, it was analyzed that they did not have an effect on improving the utilization rate of the food certification label. This is interpreted as having insufficient aspects for consumers to actually use food label through this knowledge as medical and health knowledge provided in the short term. On the other hand, in the case of the certification label promotional video, there was a significant positive (+) relationship with the utilization rate of the food certification label. This means that it is necessary to provide more direct and visual information to improve the utilization rate of food certification labels. Therefore, it seems necessary to find a way to allow consumers to be more exposed to promotional videos related to food labeling..
In the case of products that are repeatedly purchased frequently, the utilization rate of food certification label was found to be low. This can be interpreted as the fact that consumers already have sufficient confidence in the products they purchase frequently, so that consumers do not carefully look at food labels than products that they do not purchase often.
In addition, processed foods were analyzed to have a lower utilization rate of food certification labels than fresh foods. In the case of fresh food product brands, there are aspects that are less well known to consumers than processed food brands, so when purchasing fresh food, consumers purchase using certification labels or other food labels rather than the tendency to purchase products by trusting only the brand of fresh food. You may have a tendency to decide whether or not. Therefore, the estimation result of this study can be interpreted that the utilization rate of the certification label appears higher in the case of fresh food than that of processed food.
In summarizing the results of this study, it is judged that the rate of use of food labels is significantly different depending on how important consumers are to use food labels. In this regard, raising the level of awareness of the importance of using food labels by directly promoting the importance of food labeling to consumers is expected to be an effective way to improve the utilization rate of food labels by consumers.
According to the Korea Rural Economic Institute (2018), it was found that adult household members obtain information on food quality or dietary life mainly through ‘the people around’ or ‘broadcasting’. In particular, it was found that adult household members who responded that they obtain food-related information through “broadcasting” mainly obtain information through “TV or radio news programs”. Therefore, it is judged that the promotion of food labeling system through broadcasting media or internet that provides direct and visual information can have a good effect of achieving safe and rational food choice for consumers.
Meanwhile, if the information to be considered by the consumer exceeds a certain level, the consumer may not be able to use some food information. In other words, due to excessive provision of food information, the utilization rate between food labels may be mutually affected. The failure to consider the interaction between food labels in this study may be a limitation of this study. It will be a future research task to study how the food label utilization rate is affected by the interaction between food labels. Despite the limitations of these studies, this study is expected to provide useful information in terms of government food-related policy establishment and corporate market analysis.
