

Introduction
Materials and Methods
Plant and sample preparation
Genomic DNA extraction
Binary mixture sample
Blind samples
Cloning of the PCR amplicons and DNA sequencing
Sequence analysis and specific primer design
Quantitative real-time PCR assay
Standard curve analysis for real-time PCR
Results and Discussion
Development of DNA markers according to species
Evaluation of efficiency and reproducibility of the target-specific primer sets
Estimation of the sensitivity and specificity of the developed qPCR assay
Reliability verification of the developed primers using blind samples
Introduction
Herbal plants have long been used in medicine to prevent and treat various human diseases. Recently, interest in and demand for herbal medicines have surged tremendously in developing and developed countries (Ekor, 2013). According to a report by the World Health Organization (WHO), most developing countries depend on herbal medicines to treat human diseases (WHO, 2007). Owing to the increased demand for herbal medicines, interest in the safety of herbal medical products has increased; however, the effects of many plants used as medicinal herbs on human health have not been examined, and concerns regarding potential side effects are increasing (WHO, 2002). Therefore, the use of medicinal herbs, verified by their effect and origin, has been important in the protection of consumer rights in the medical herb market.
The Rosaceae family is a flowering plant family comprising 4,828 species in 91 genera; these species are particularly found in Europe, North America, and Asia. Plants belonging to Rubus, the genus to which R. coreanus and R. occidentalis belong, are widely cultivated as fruit trees and medicinal crops. When used as a medicinal crop, Rubus plants are reported to have antioxidant, antinociceptive, anti-inflammatory, and antipruritic effects (Patel et al., 2004; Seo and Ahn, 2004). Among them, R. coreanus is a plant native to Korea, and its unripe fruit corresponds to the original plant of a medicinal material called “Bokbunja” (MFDS, 2022). R. coreanus is a plant with traditional medicinal properties in Korea and is mainly used to treat diabetes, asthma, and allergies. In contrast, R. occidentalis is called “black raspberry” in North America and is widely used as a raw material for various processed foods (Kim et al., 2014). R. occidentalis, whose fruits are morphologically similar to those of R. coreanus, is cultivated in most regions of Korea since its introduction from North America in the late 1960s. R. coreanus extracts have been reported to have higher anti-inflammatory activity than those of R. occidentalis (Yang et al., 2007). Although both species have different medicinal effects in different origins, they have been used confusedly due to the common name, “Bokbunja,” in Korea (MFDS, 2022).
Various techniques have been developed to identify impurities in processed food products, including morphological, physicochemical, DNA-based, chromatographic, and spectroscopic methods (Hong et al., 2017). Among them, DNA-based analysis can detect only the target components in processed food products with high accuracy and efficiency compared to other methods (Kane and Hellberg, 2016). Representative DNA-based molecular markers, such as multiplex PCR and quantitative real-time PCR (qPCR), have been developed and are widely used to detect counterfeit ingredients in processed food products. However, multiplex PCR is difficult to optimize owing to cross-reactivity between combined primers and low sensitivity in complex food products (Xu et al., 2012). In contrast, qPCR is highly sensitive to complex food products and can quickly detect only the target species. Generally, qPCR can be designed as either dye-based qPCR (e.g., SYBR Green assay) or probe-based qPCR (e.g., TaqMan assay) (Arya et al., 2005). However, it is more difficult to optimize the TaqMan method than the SYBR Green-based qPCR method because more SNPs and InDels are required by the TaqMan method to distinguish the target species (Safdar and Junejo, 2015; Şakalar and Kaynak, 2016). As the SYBR Green-based qPCR assay can discriminate target species without the use of probes, it can be conveniently optimized even with a small number of SNPs and InDels between target and nontarget species and is associated with a low manufacturing cost (Safdar and Junejo, 2015).
Although the anti-inflammatory effects (Yang et al., 2007) and antioxidant effects (Kim et al., 2014) of both extracts of R. coreanus and R. occidentalis have been reported, the discrimination of both plants based on molecular markers has not been reported. In this study, molecular markers were developed to distinguish the two species, which have been confusedly called "Bokbunja,” using an inexpensive and convenient SYBR Green-based qPCR assay. In addition, the specificity and reliability of the developed molecular markers were verified through specificity and blinding tests.
Materials and Methods
Plant and sample preparation
R. coreanus and R. occidentalis leaves were provided by the Forest Life Resources Research Department of the National Academy of Forest Sciences (Suwon, Korea). The samples used to evaluate the specificity of the developed primers were purchased from the local market and stored in sealed containers at (20-21°C). Genomic DNA (gDNA) was extracted from the ground powder of fresh or dried leaves using a mortar and pestle in liquid nitrogen.
Genomic DNA extraction
To isolate gDNA from small samples of R. coreanus and R. occidentalis leaves, the DNeasy Plant Pro Kit (Qiagen, Hilden, Germany) was employed. In contrast, large-scale gDNA extraction, such as using binary mixing tests, was performed using a modified large-scale CTAB-based method (Minas et al., 2011). The obtained gDNA was purified using the Wizard DNA Clean-up System (Promega, Madison, WI, USA) to obtain high-quality gDNA. The extracted gDNA was measured using a SPECTROstar Nano Leader (BMG Labtech, Otenberg, Germany), and the purity of the extracted DNA was between 1.7 and 2.0.
Binary mixture sample
Quantitative reference binary mixtures were generated to assess the applicability of the developed discrimination method to commercial products. The binary mixture was obtained by combining the R. coreanus and R. occidentalis powders, and a quantitative binary mixing model was developed at ratios of 0.1% (2 mg), 1% (20 mg), 10% (200 mg), and 100% (2 g), respectively. In addition, impurities at concentrations less than 0.1% are generally not considered due to unintentional illegal reasons. The Real-Time PCR cycle threshold (Ct) for the target species of all binary mixtures was applied with a cutoff value of 0.1% according to a previous report (Oh and Jang, 2020).
Blind samples
The blind mixtures were obtained from the Ministry of Food and Drug Safety, National Food and Drug Administration (Cheongju, Korea). The mixtures were randomly divided into 25 samples with different ratios of R. coreanus and R. occidentalis. A final dose of approximately 300 mg of the mixture was obtained from the leaf powders of R. coreanus and R. occidentalis.
Cloning of the PCR amplicons and DNA sequencing
Conventional PCR was performed using a VeritiProTM Thermal Cycler (Thermo Fisher Scientific, Massachusetts, USA) to obtain accurate sequences of the target genes of R. coreanus and R. occidentalis. PCR mixtures were prepared using TaKaRa Ex Taq DNA polymerase (Kusatsu, Shiga, Japan) with 10 ng of gDNA and 10 pmol of each primer. The PCR cycling program consisted of 35 cycles of pre-denaturation at 95°C for 5 min, denaturation at 95°C for 10 s, annealing at 58-64°C (depending on primer set) for 30 s, and extension at 72°C for 1 min, and a final extension step at 72°C for 5 min. The PCR products were then cloned using the RBC T&A cloning vector (Real Biotech Corporation, Taipei, Taiwan), and plasmid DNAs were extracted using a DokDo-Prep Plasmid Mini-Kit (ELPISB, Daejeon, Korea). The extracted plasmid DNAs were sequenced by a commercial company (Macrogen, Seoul, Korea).
Sequence analysis and specific primer design
To design species-specific primer sets for the two target species, sequences of R. coreanus [atpA (NC_042715.1), rpoC2 (NC_042715.1), and matK (LC515928.1)], and sequences of R. occidentalis [matK (MK520558), rpoB (NC_060646.1), and the internal transcribed spacer (ITS) (MT078686.1)] were downloaded from the National Center for Biotechnology Information (NCBI) database. The nucleotide sequences were subjected to multiple alignments using ClustalW2 (www.ebi.ac.uk). Species-specific markers were designed based on SNPs in the aligned sequences. The designed primers were synthesized by a commercial company (Macrogen).
Quantitative real-time PCR assay
Quantitative real-time PCR was performed using the AccuPower® 2X GreenStar qPCR Master Mix (Bioneer, Daejeon, Korea). The real-time PCR reaction mixture contained 10 µL of 2X GreenStar Master Mix; 0.5 µL of 10 pmol each primer; 1 µL of 10 ng・µL-1 genomic DNA; 0.25 µL of ROX Dye; and distilled water up to final volume of 20 µL. Real-time PCR was performed using the QuantStudio 3 Real-Time PCR System (Applied Biosystems, Foster City, CA, USA). After 10 min of pre-denaturation at 95°C, 40 cycles of denaturation for 30 s at 95°C, annealing for 20 s at 58-64°C (depending on the melting temperature of each target primer), and extension for 30 s at 72°C were carried out. All real-time PCRs were performed in triplicate.
Standard curve analysis for real-time PCR
The efficiency and sensitivity of the developed primer set were evaluated using standard curves with a subsequent series (10 ng-1 pg/µL) of target and non-target gDNA. The standard curve was defined as the number of cycle thresholds (Ct) observed in qPCR experiments at threshold levels of log-based fluorescence in five series of 10-fold dilutions of extracted gDNA (Yuan et al., 2006). Correlations between standard curves and diluted DNA were estimated using default parameters. The standard curve was calculated as:
where a is the standard curve slope and b is the y-intercept.
The percentage efficiency was determined using:
The reaction efficiency (E) was determined using. (ENGL, 2008; Lo and Shaw, 2018)
Interlaboratory validation was performed in two different laboratories to validate the reproducibility and accuracy of the developed primer sets for the discriminant method. Interlaboratory validation was performed using an Applied Biosystems 7500 Fast Real-Time PCR Instrument System (Applied Biosystems, Foster City, CA) and a Step 1 Plus Real-Time PCR System (Applied Biosystems), with the application of identical qPCR conditions. All real-time PCRs were performed in triplicate.
Results and Discussion
Development of DNA markers according to species
Species-specific primer sets were designed to differentiate between the raw materials of R. coreanus and R. occidentalis, which can be misused in medicinal herb markets. The primer set was designed based on the SNPs found in chloroplast genes, such as matK, atpA, rpoC2, and rpoB and the ITS region of the nuclear genome between both genomes. Chloroplast genes and the ITS region are well-conserved regions among plants and are commonly used to design species-specific markers (Kim et al., 2022; Oh et al., 2022; Uh and Jang, 2022). After downloading the sequences of matK, atpA, rpoC2, and ITS of R. coreanus and R. occidentails from NCBI, we designed cloning primers to confirm the sequences of reference samples, such as the leaves of R. coreanus and R. occidentalis obtained from national institutes. The identity of both sequences from the database and the references was 100% (data not shown). Based on the obtained sequences, alignments were performed using the software programs, ClustalW2 and BioEdit 7.2. All species-specific primers were designed based on the SNP between the two species (Fig. 1). Generally, the processes of medicinal herb markers involve drying, heating, and cutting, which can affect the quality of DNA in complex food products (Lo and Shaw, 2018). Therefore, we amplified relatively short amplicons from 92 to 184 bp, as low-quality DNA can reduce the efficiency of qPCR (Table 1).
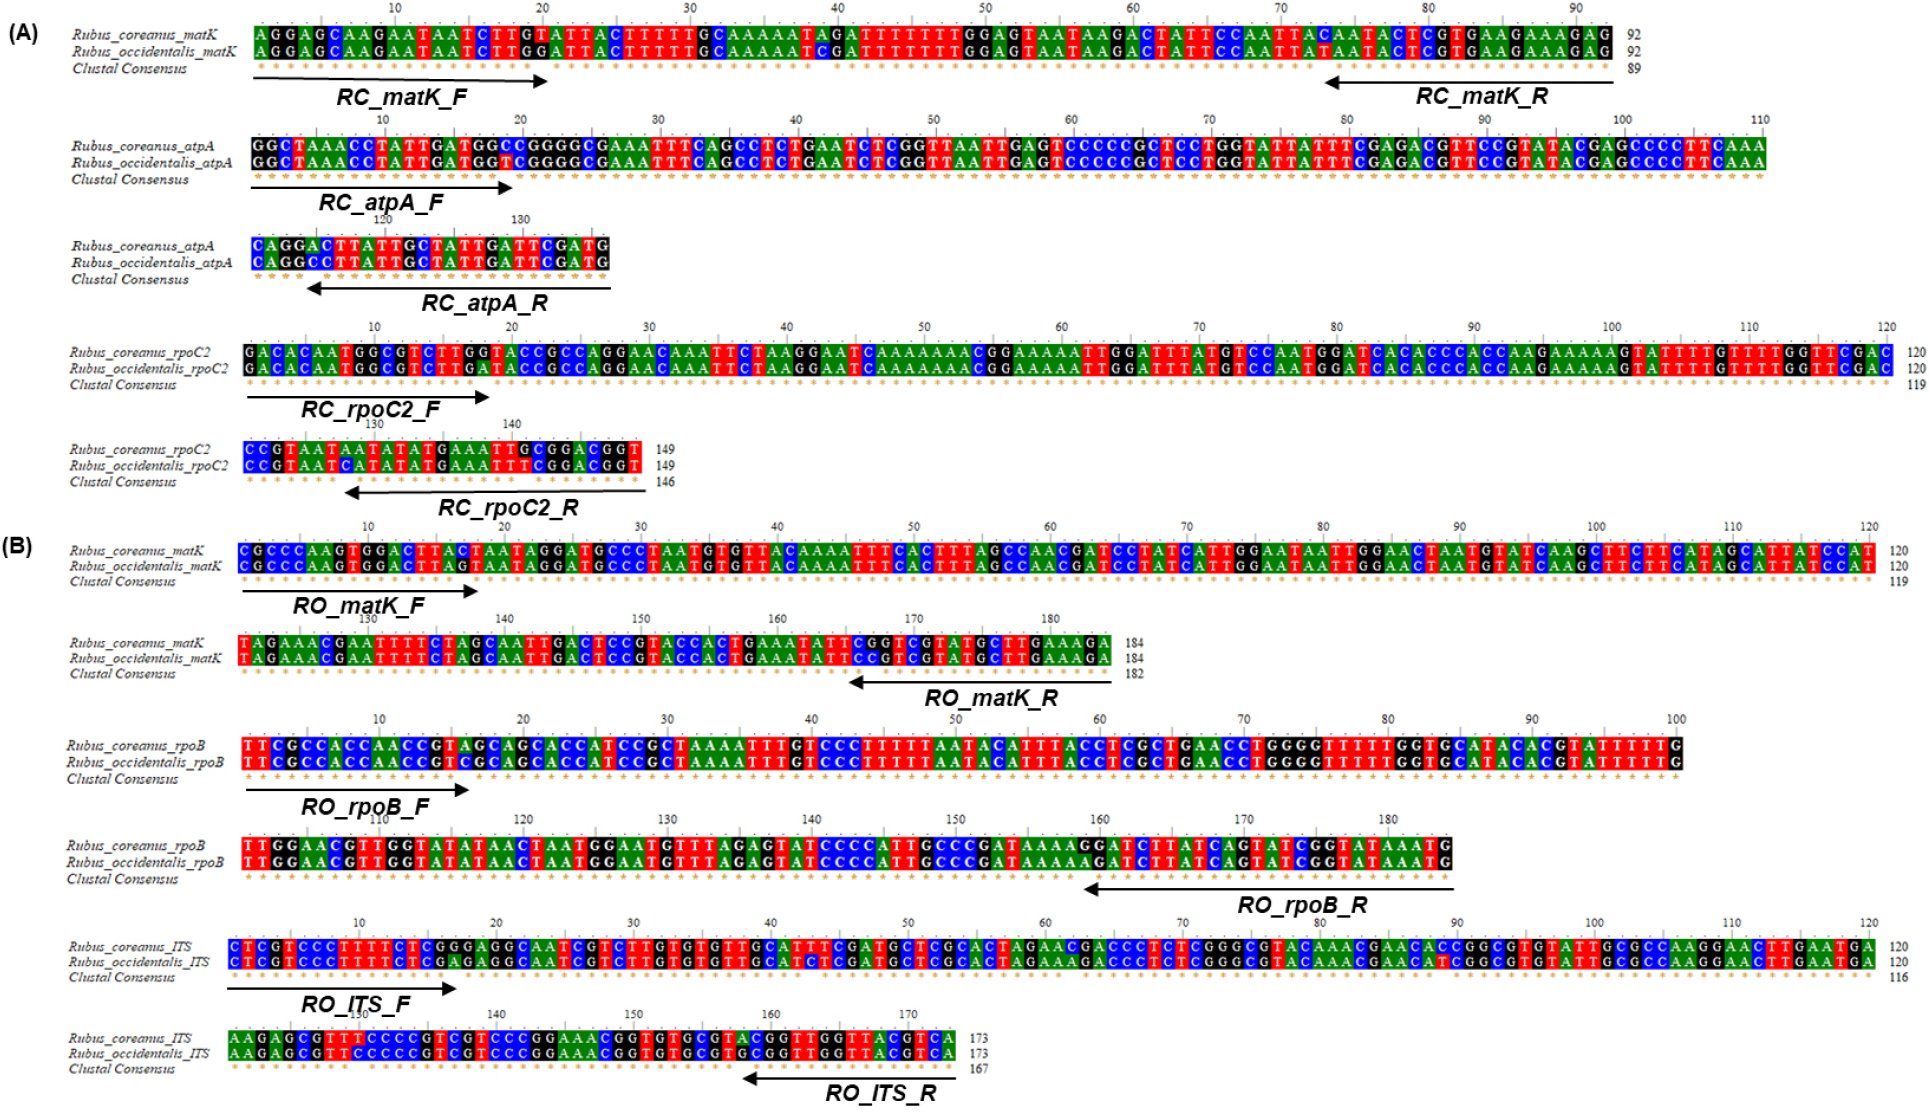
Fig. 1.
Standard curve of the designed species-specific primer sets based on the efficiency and correlation coefficient (R2) for 10-fold serially diluted gDNA of the target species. Navy and gray dots indicate the target and non-target species, respectively. The x-axis represents log DNA concentration (ng), and the y-axis represents mean Ct value ± SD. All reactions were performed in triplicate (n = 3).
Table 1.
Information of the target-specific primer sets developed in the present study
Evaluation of efficiency and reproducibility of the target-specific primer sets
The efficiency and reproducibility of the six pairs of primer sets (RC_matK, RC_atpA, RC_rpoC2, RO_matK, RO_rpoB, and RO_ITS) were examined in R. coreanus and R. occidentalis. For efficiency, regression analysis was performed using serially diluted 10-fold samples (10-10-3 ng/µL) of genomic DNA extracted from the leaves of the target species. The slopes of the six primer sets were between -3.18 and -3.55, and the efficiencies according to the slope were between 91.10 and 106.27%. In addition, the correlation coefficients (R2) were higher than 0.99 (Fig. 2). The range of primer amplification efficiency satisfied the guidelines of the European Network of GMO Laboratories (ENGL) (R2 > 0.98, Slope -3.1 to -3.6, efficiency 90.0 to 110.0%). The reproducibility of the developed primers was then verified in independent laboratories using different real-time equipment. The test was conducted in a total of two laboratories, and the results revealed a slope of -3.11 to -3.49, and an efficiency according to the slope of 93.55 to 109.57%. The correlation coefficient (R2) was 0.98 or more (Table 2). Therefore, the developed primer sets were suitable for detecting target species in complex food products.

Fig. 2.
Standard curve of the designed species-specific primer sets based on the efficiency and correlation coefficient (R2) for 10-fold serially diluted gDNA of the target species. Navy and gray dots indicate the target and non-target species, respectively. The x-axis represents log DNA concentration (ng), and the y-axis represents mean Ct value ± SD. All reactions were performed in triplicate (n = 3).
Table 2.
Results of inter-laboratory real-time polymerase chain reaction analysis
Estimation of the sensitivity and specificity of the developed qPCR assay
A binary mixture test was performed to estimate the sensitivity of the primers developed in this study to detect only the target species when R. coreanus and R. occidentalis were mixed. The slopes using primer sets of R. coreanus in binary mixtures of different ratios (0.1% to 100%) ranged from -3.15 to -3.19, and the resulting efficiencies ranged from 105.71 to 107.24 (Fig. 3A). The measured slope of the primer sets of R. occidentalis ranged from -3.18 to -3.45, and the corresponding efficiencies ranged from 94.56 to 105.90 (Fig. 3B). The R2 values for all six primer pairs were 0.98 or more. The results of the binary mixture test indicated that all six primer pairs had high sensitivity for detecting the target in mixed food products. Additionally, the limit of quantitation (LOQ) for all real-time methods was 0.1% of the target species. Therefore, the cut-off Ct value to confirm the presence of the target species was set to 0.1% Ct of the target species in the binary mixture. The cut-off Ct values ranged from 25.64 to 26.97 cycles for each primer set targeting R. coreanus and 24.43 to 26.05 cycles for each primer set targeting R. occidentalis (Fig. 3).

Fig. 3.
Threshold cycles (Ct) obtained based on efficiencies and correlation coefficients (R2) for reference binary mixtures. The x-axis represents log percentage of the target species (%), and the y-axis represents mean Ct value ± SD. Plotted against the logarithm of target species concentration (100%, 10%, 1%, and 0.1%). (A) Rubus coreanus powder was mixed with R. occidentalis powder, and 10-fold serial dilutions (0.1%, 1%, 10%, and 100%, total mass of 2 g) were prepared. Each gDNA mixture (10 ng・µL-1) was amplified using the species-specific primer sets (RC_matK, RC_atpA, and RC_rpoC2) for R. coreanus. The red dotted line indicates Ct values for 0.1% binary mixture amplified using the R. coreanus-targeting primer sets. (B) R. occidentalis powder was mixed with R. coreanus powder, and 10-fold serial dilutions (0.1%, 1%, 10%, and 100%, total mass of 2 g) were prepared. Each gDNA mixture (10 ng・µL-1) was amplified using the species-specific primer sets (RO_matK, RO_rpoB, and RO_ITS) for R. occidentalis. The yellow dotted line indicates the Ct values for 0.1% binary mixture amplified using the R. occidentalis-targeting primer sets. The black and orange dotted lines indicate the Ct values (cut-off Ct) for 0.1% binary mixtures amplified using the R. coreanus- and R. occidentalis-target primers, respectively. All reactions were performed in triplicate (n = 3).
The specificity test of the developed real-time assay for R. coreanus or R. occidentalis was performed using 15 different species, which may be used in medicinal herb products (Table 3). The primer sets (RC_matK, RC_atpA, and RC_rpoC2) targeting R. coreanus displayed high specificity based on cross-reactivity; no significant amplification was observed in 15 species, except R. coreanus. In addition, the primer sets (RO_matK, RO_rpoB, and RO_ITS) targeting R. occidentalis did not show significant amplification in all 15 plants, except R. occidentalis. These results indicate that all six primer pairs targeting R. coreanus and R. occidentalis had high specificity for detecting the intended target species without the false positives associated with the other 15 species.
Table 3.
Results of specificity test using the developed species-specific primer sets
| NO | Family | Species | Rubus coreanus | Rusbus occidentalis | ||||
| matK | atpA | rpoC2 | matK | rpoB | ITS | |||
| Cut-off Ct values | 26.22 | 26.97 | 25.64 | 25.56 | 26.05 | 24.43 | ||
| 1 | Rosaceae | Rubus coreanus | a++ | ++ | ++ | - | - | - |
| 2 | Rubus occidentalis | b- | - | - | ++ | ++ | ++ | |
| 3 | Compositae | Dendranthema indicum | - | - | - | - | - | - |
| 4 | Cirsium japonicum | - | - | - | - | - | - | |
| 5 | Xanthium strumarium | - | - | - | - | - | - | |
| 6 | Carthamus tinctorius | - | - | - | - | - | - | |
| 7 | Atractylodes lancea | - | - | - | - | - | - | |
| 8 | Artemisia capillaris | - | - | - | - | - | - | |
| 9 | Artemisia gmelinii | - | - | - | - | - | - | |
| 10 | Kalimeris yomena | - | - | - | - | - | - | |
| 11 | Fabaceae | Glycyrrhiza uralensis | - | - | - | - | - | - |
| 12 | Zingiberaceae | Curcuma longa | - | - | - | - | - | - |
| 13 | Graminae | Zea mays | - | - | - | - | - | - |
| 14 | Liliaceae | Veratrum maackii | - | - | - | - | - | - |
| 15 | Hemerocallis fulva | - | - | - | - | - | - | |
| 16 | Convolvulaceae | Ipomoea batatas | - | - | - | - | - | - |
Reliability verification of the developed primers using blind samples
To estimate the reliability of the developed qPCR molecular marker, a blinded test was performed using 25 samples. Blind samples were prepared by an independent research institute who did not provide any information on how the powders of R. coreanus and R. occidentalis were mixed before discrimination. A total of 25 blind samples were evaluated using the 18S rRNA primer set as a positive amplification control to ensure good DNA extraction. All samples had values between 17.48 and 18.74 in the positive amplification control (Table 4). Subsequently, the samples were amplified by the developed primer pairs and determined based on Ct values of 0.1% measured in binary mixture tests (RC_matK, 26.22; RC_atpA, 26.97; RC_rpoC2, 25.64; RO_matK, 25.56; RO_rpoB, 26.05; RO_ITS, 24.20) whether any species sample was or was not present in the mixed samples. Twenty-five samples had lower Ct values for the developed R. coreanus primer sets than the Ct values of 0.1%, supporting the examined all have powders of R. coreanus. In contrast, higher Ct values of the developed R. occidentalis primer sets were observed in seven samples (sample numbers:1, 5, 9, 15, 18, 19, and 20), indicating that the samples did not contain R. occidentalis powder. The other 18 samples had Ct values lower than the cut-off for the developed R. coreanus and R. occidentalis primers, indicating that R. coreanus and R. occidentalis powders were mixed. These results indicate that the developed primer sets are highly reliable for detecting the target species in R. coreanus and R. occidentalis mixed food products.
Table 4.
Result of blind test assessing the reliability of the developed species-specific primer sets
| Primer sets | R. coreanus and R. occidentalis blind test | |||||||||||||||||||||||||
| 1 | 2 | 3 | 4 | 5 | 6 | 7 | 8 | 9 | 10 | 11 | 12 | 13 | 14 | 15 | 16 | 17 | 18 | 19 | 20 | 21 | 22 | 23 | 24 | 25 | ||
|
Positive control |
18s rRNA | 18.741 | 18.263 | 18.163 | 18.204 | 18.311 | 18.012 | 17.712 | 17.645 | 18.212 | 17.830 | 17.866 | 17.482 | 18.063 | 17.877 | 17.865 | 18.280 | 18.052 | 18.350 | 18.643 | 18.106 | 17.933 | 17.969 | 18.186 | 18.263 | 18.298 |
| ±0.150 | ±0.171 | ±0.133 | ±0.166 | ±0.123 | ±0.321 | ±0.171 | ±0.017 | ±0.103 | ±0.152 | ±0.085 | ±0.128 | ±0.089 | ±0.044 | ±0.122 | ±0.083 | ±0.024 | ±0.098 | ±0.064 | ±0.075 | ±0.005 | ±0.016 | ±0.113 | ±0.009 | ±0.010 | ||
| Rubus coreanus | matK Region | 19.657 | 19.266 | 19.338 | 19.299 | 19.428 | 19.569 | 18.693 | 18.810 | 19.269 | 18.979 | 19.243 | 18.762 | 19.279 | 19.287 | 19.053 | 19.089 | 19.353 | 19.922 | 19.649 | 19.228 | 19.349 | 19.145 | 19.664 | 19.432 | 19.099 |
|
26.22 cyclea | ±0.074 | ±0.007 | ±0.066 | ±0.060 | ±0.125 | ±0.030 | ±0.031 | ±0.263 | ±0.009 | ±0.021 | ±0.044 | ±0.011 | ±0.023 | ±0.105 | ±0.057 | ±0.010 | ±0.128 | ±0.060 | ±0.092 | ±0.054 | ±0.025 | ±0.113 | ±0.043 | ±0.111 | ±0.020 | |
| atpA Region | 19.654 | 19.169 | 19.235 | 19.237 | 19.206 | 19.558 | 18.603 | 19.299 | 19.279 | 19.163 | 19.149 | 18.904 | 19.280 | 19.552 | 19.197 | 19.571 | 19.689 | 20.256 | 19.855 | 19.667 | 19.581 | 19.546 | 19.925 | 19.935 | 19.564 | |
|
26.97 cycle | ±0.060 | ±0.028 | ±0.025 | ±0.121 | ±0.046 | ±0.041 | ±0.113 | ±0.024 | ±0.110 | ±0.055 | ±0.034 | ±0.066 | ±0.023 | ±0.063 | ±0.080 | ±0.117 | ±0.025 | ±0.124 | ±0.039 | ±0.353 | ±0.065 | ±0.014 | ±0.126 | ±0.014 | ±0.021 | |
| rpoC2 Region | 19.022 | 18.357 | 18.558 | 18.714 | 18.867 | 18.980 | 18.035 | 18.224 | 18.358 | 18.317 | 18.330 | 18.025 | 18.424 | 18.748 | 18.306 | 18.625 | 18.677 | 19.093 | 18.840 | 18.701 | 18.690 | 18.775 | 18.967 | 18.845 | 18.652 | |
|
25.64 cycle | ±0.056 | ±0.012 | ±0.004 | ±0.007 | ±0.015 | ±0.085 | ±0.049 | ±0.090 | ±0.018 | ±0.027 | ±0.023 | ±0.082 | ±0.020 | ±0.035 | ±0.071 | ±0.018 | ±0.059 | ±0.008 | ±0.071 | ±0.006 | ±0.032 | ±0.018 | ±0.013 | ±0.079 | ±0.059 | |
| Rubus occidentalis | matK Region | 33.283 | 25.535 | 23.929 | 24.244 | 32.222 | 23.260 | 21.756 | 23.262 | 25.919 | 22.186 | 21.917 | 22.917 | 21.989 | 25.034 | 26.763 | 22.974 | 21.752 | 32.040 | 31.619 | 34.755 | 21.030 | 21.584 | 21.177 | 22.409 | 21.249 |
|
25.56 cycle | ±0.889 | ±0.022 | ±0.030 | ±0.062 | ±0.791 | ±0.083 | ±0.147 | ±0.014 | ±0.002 | ±0.076 | ±0.066 | ±0.035 | ±0.003 | ±0.119 | ±0.075 | ±0.008 | ±0.004 | ±0.154 | ±0.583 | ±0.071 | ±0.052 | ±0.025 | ±0.005 | ±0.040 | ±0.066 | |
| rpoB Region | 34.404 | 25.929 | 25.151 | 25.354 | 33.484 | 24.172 | 22.787 | 24.376 | 27.236 | 23.782 | 23.170 | 24.155 | 23.176 | 26.435 | 28.237 | 24.234 | 23.339 | 33.003 | 34.880 | 35.081 | 22.542 | 23.280 | 23.085 | 24.035 | 22.766 | |
|
26.05 cycle | ±1.174 | ±0.030 | ±0.009 | ±0.063 | ±1.048 | ±0.010 | ±0.189 | ±0.142 | ±0.165 | ±0.007 | ±0.088 | ±0.083 | ±0.096 | ±0.107 | ±0.060 | ±0.038 | ±0.099 | ±0.138 | ±0.698 | ±0.559 | ±0.017 | ±0.025 | ±0.030 | ±0.040 | ±0.105 | |
| ITS Region | 31.776 | 24.443 | 23.951 | 24.113 | 33.222 | 23.472 | 21.993 | 23.667 | 26.317 | 22.916 | 22.218 | 23.336 | 22.399 | 24.268 | 27.074 | 23.380 | 22.123 | 32.024 | 31.979 | 32.799 | 21.327 | 21.949 | 21.701 | 22.224 | 21.418 | |
|
24.43 cycle | ±0.132 | ±0.971 | ±0.004 | ±0.028 | ±1.095 | ±0.008 | ±0.112 | ±0.206 | ±0.013 | ±0.073 | ±0.018 | ±0.030 | ±0.001 | ±0.003 | ±0.126 | ±0.101 | ±0.168 | ±0.139 | ±0.103 | ±0.378 | ±0.104 | ±0.127 | ±0.107 | ±0.117 | ±0.047 | |
| Ingredient | R_ coreanus | ○ | ○ | ○ | ○ | ○ | ○ | ○ | ○ | ○ | ○ | ○ | ○ | ○ | ○ | ○ | ○ | ○ | ○ | ○ | ○ | ○ | ○ | ○ | ○ | ○ |
| R_ occidentalis | × | ○ | ○ | ○ | × | ○ | ○ | ○ | × | ○ | ○ | ○ | ○ | ○ | × | ○ | ○ | × | × | × | ○ | ○ | ○ | ○ | ○ | |
The real-time PCR system developed in this study to distinguish between R. coreanus and R. occidentalis was found to have the high specificity and sensitivity necessary to detect both species in medicinal herb markers. Additionally, the reliability of the developed markers was verified using 25 blind samples. The developed six pairs of qPCR-based molecular markers could quickly and efficiently identify both species in commercial processed products, thereby contributing to food safety and the protection of consumer rights in medical herb markets.
