

Introduction
ODA vs. Economic Growth in Zambia
Analytical framework
Empirical Results
Descriptive Statistics
The Co-integration Test
Diagnostic Tests
Concluding Remarks
Introduction
The Official Development Assistance (ODA) is important in the growth and development process of many developing nations that lack sufficient national resources to pursue economic growth. The primary motivations for ODA have been to improve countries’ fragility and socioeconomic conditions. Official Development Assistance, on the other hand, is being used as promoting political and diplomatic relations with developing countries while improving political and economic stability within countries.
In theory, foreign aid should have the ability to help developing countries to achieve social and economic development by bringing funds from developed countries. The direct link between economic growth and donor aid, however, has been widely contested with decades of research generating inconclusive and unclear conclusions. Several authors have asked for greater research on this area (Durbarry et al., 1998; Veiderpass and Andersson, 2001). Despite the lack of consensus on how ODA impacts growth, ODA works; nevertheless, this doesn’t really guarantee that it works in practice in every nation or circumstance (Boakye, 2008). Foreign aid to the developing world, according to critics such as Moyo (2009) and Hansson (2007), lacks a development orientation and thus should never be pursued in the quest of long-term economic and social development. Some (Liew et al., 2012) still emphasize ODA’s negative impact on growth, whereas others (Wako, 2011) believe that ODA has just a minimal role in growth. As a result, it is uncertain if ODA contributes much to economic growth, bringing the issue open to extensive controversy. Therefore, the main objective of the study is to analyze the impact of ODA on economic growth in Zambia. Even if Zambia has been a recipient of ODA since its independence in 1964, its economic growth has been static. Hence, Zambia might be the proper example of the analysis that targets at the impact of ODA on the economic growth.
Scientific research regarding the relationship between ODA and economic expansion has created inconclusive and enigmatic findings. On the crucial question of whether ODA contributes to development or not, the debate is broadly divided between those who believe that it does and those who do not. In particular, Sachs (2005) is among those who believe that ODA is necessary for developing countries to achieve economic growth. Others believe that ODA has done nothing but impoverish the economies that was supposed to be developed, but it turned out to be consumption distorted, lower growth rates, exacerbated inequalities, fostered corruption at both ends (Bauer, 1981; Boone, 1996). Recently, researchers have become more interested in the political and world trade related ODA (Easterly, 2006; Moyo, 2009). They believe that rather than assisting poor African nations in developing, ODA impoverishes them further.
ODA vs. Economic Growth in Zambia
Zambia has been both a resource rich and an aid-dependent nation, and its development trajectory has matched that of many other sub-Saharan African countries with natural resource. Zambia’s per capita GDP was nearly triple compared to that of South Korea in 1965. However, around 1975, both per capita GDPs were about similar. However, by 2001, South Korea’s performance and productivity in terms of its per capita GDP had exceeded Zambia’s by a proportion of greater than twenty folds (McPherson, 2004). It was the period for Zambia during the protracted time of economic doldrums that emerged around the year 1970, driven in significant part by an extremely ineffective level of governmental intervention in the market, that the government of Zambia became overly reliant on overseas relief inflows. Zambia forfeited its classification as a middle-income economy after many years of repeated ODA and concessional financing programs, and it remains a low-income country today.
Zambia, much like most natural resource rich developing nations, has a high level of poverty. The Living Conditions Monitoring Survey conducted by the Zambian government found that 59% of the people was below the poverty line in 2006 and the poverty incidence has stayed unchanged at 60% using the initial 2010 collected data sample. It also has a markedly inequitable distribution of income that Gini index is reportedly equal to 0.53 in 2021. In addition, a non-diversified domestic economy is heavily reliant on natural resource exports, specifically copper.
The annual real per capita GDP was at an average of 6.8% from 2000 to 2014. This improvement in Zambia’s macroeconomic performance is directly tied with the substantial inflow of Chinese loans and investments in infrastructures. From 2015 to 2019, the GDP growth rate decreased to 3.1% annual average, owing mostly to a decrease in copper prices. In addition, economic growth decreased dramatically from 4% in 2018 to 1.4% in 2019. However, the services sector grew by 3.5% in 2019, remaining the government’s major economic engine, while primary and secondary industries experienced a dramatic decline.
Zambia gradually became a main beneficiary of ODA due to its unstable economic performance, which was exacerbated by highly volatile copper prices on the international market. The puzzle is figuring out how to explain Zambia’s development struggles and precipitous decline in the face of abundant natural resources and ample foreign aid. Considering its political and economic reforms, a huge amount of foreign assistance over the past decades, as well as economic guidance and monitoring by international donors, contemporary Zambia still has high level of debt, aid dependency, and unsustainable economic development performance.
In the mid-1960s, Zambia began to attract substantial international aid inflows. For the majority of Zambia’s initial era of liberation, ODA was largely in the nature of technical support, which was aimed at assisting government programs. During the last three decades, the net ODA per capita was on the rise between 1988 and 1996. The national budget had become more substantially reliant on external financing, and Zambia has become one of the most aid-dependent nations in Sub-Saharan region.
Analytical framework
Zambia is a country in southern Africa whose economy depends largely on mining and agriculture. Since independence, the country has been supplementing its development efforts with ODA. Using a time series quantitative research design, the study examined how government development aid has influenced economic growth in Zambia from 1988 to 2019 before COVID-19 pandemic.
Following time series property tests, the study employed the Vector Error Correction Model (VECM) in the analysis. The relationship between two cointegrated variables can be expressed as an error correction model, according to the granger representation theorem. The error correction model is a method of reconciling short-run behavior of economic variable with long-run behavior (Gujarati, 2004). The time series data for the econometric model’s variables were collected from World Bank online resources. According to a large body of literature, variables influencing the economic growth of many countries include, but are not limited to, private external resource flows, gross capital formation, trade openness, government consumption expenditure, and the official development assistance, for which in this research has been identified as one of the factors driving per capita GDP growth, particularly in developing countries.
The model of interest in the VECM is shown in Equation (1).
The real GDP per capita growth rate (represented as gdp) adjusted for inflation or deflation is the dependent variable in this research. It is the annual growth rate of the total market value of all finished goods and services per capita, produced with domestic factors of production with a unit measurement of annual percentage (annual %).
Foreign aid (oda) and the four other variables as mentioned below are the independent variables in this study. Due to declining returns on production inputs, grow domestic production (gdp) is commonly employed in economic research to indicate pace of convergence, which explains why impoverished countries should improve faster than rich countries. A one-year lag in real gross domestic product (gdpt-1) is used to test this notion. It gives us control over the economy’s starting point. The expected sign of a lagged variable is positive.
Net ODA as a percentage of GDP excludes humanitarian assistance, non-concessional loans, and aid supplied by non-governmental organizations (NGOs). The study measures aid by comparing ODA to Gross Domestic Product in percentage terms. ODA is defined as “loans and grants disbursed by official agencies of Development Assistance Committee (DAC), multilateral institutions, and non-DAC countries to promote economic development and welfare in countries and territories on the DAC list of ODA recipients” (World Bank 2010). Private External Resource Flow (perf) is the net inflows from foreign direct investment, net flows from private non-guaranteed long-term loans, and net inflows from overseas workers added together and measured as a percentage of GDP. The expected sign of a lagged variable is positive. Without a question, trade has an impact on the economy, and it is usually a significant outcome. It allows for greater specialization, allowing countries to benefit on their distinct strength. The expected sign of a lagged variable is positive.
While government funds are used for social welfare programs like health care, education, and law enforcement, several other funds are not. “Instead, the government may waste significant sums of money on frivolous operations like settling off the bureaucracy’s salary bill” (Loayza et al., 2004). As a result, one can anticipate sluggish economic position in the face of increased public spending. To calculate the burden of government, this study uses Final Government Consumption Expenditure (fgce) as a percentage of GDP. Gross Capital Formation (gcf) is measured as the sum of domestic public and private investments relative to GDP (percentage of GDP). The expected sign of a lagged variable is positive. The term “GCF” refers to the estimated additions to the economy’s fixed assets and inventories. The GCF is calculated as a percentage of GDP in this study. In fact, Ram (1987) and Medina-Smith (2001) found that “gross capital formation is a good approximation for capital growth rate.” To put it another way, total capital creation refers to a country’s net increase or expansion in its physical capital stock (Fischer, 1993). The selection of the variable that are used for the study is very similar to previous studies. The other criteria used in selection of the control variables is based on the availability of times series data for the variables. Like many other African countries, Zambia is still an underdeveloped country, and therefore, data availability on most online resources is still a big challenge.
Empirical Results
Descriptive Statistics
Table 1 depicts a detailed description of each variable. The standard deviation values, the mean, median, maximum, and minimum values, are all included in the statistics. Standard deviation values were high for all variable revealed that data points deviate significantly from their mean values. The high standard deviation statistics for all the variables were high and this was as a result non-stationary nature of time series data.
Table 1.
Descriptive statistics
The unit root test is conducted to ascertain whether the variables have unit roots or are non-stationary. In order to derive a meaningful relationship from the regression, the variables used in the analysis must be stationary and co-integrated.
Based on the ADF results in the Table 2, variables (in logarithms) integrations are of order one. The ADF test statistics in absolute terms for variables in the model are greater than their critical values at 5% level of significance at first difference. This indicate that the variables are stationary, so the null hypothesis that suggests the ADF unit root test can reject each variable that has unit root. This stationarity test results gives the right to proceed with the next step of conducting the co-integration test and the estimation of the designed regression model.
Table 2.
Dickey–Fuller test for unit root analysis
The Co-integration Test
The amount of lags within this model affects result of co-integration test, and therefore, it is usually followed by a test to decide the suitable lag length. There are numerous tests that may be done to select an appropriate lag length. These are the Hannan-Quinn information criteria (HQIC), the Schawarz information criteria (SBIC), and the Akaike information criteria (AIC).
As seen in the Table 3, the AIC and HQIC selection criteria have chosen the optimal lag length at 2. Therefore, the optimal lag length 2 is selected and the Johansen co-integration test can be conducted. In addition, trace statistics indicates that there is one co-integrating equation at the 5% critical level (Table 4).
Table 3.
Lag length selection
| Lag | LL | LR | df | P | FPE | AIC | HQIC | SBIC |
| 0 | -56.5795 | 2.60E-06 | 4.17197 | 4.26162 | 4.45221 | |||
| 1 | 25.8288 | 164.82 | 36 | 0.000 | 1.20E-07 | 1.07808 | 1.70564 | 3.03976* |
| 2 | 74.5594 | 97.461* | 36 | 0.000 | 7.3e-08* | .229377* | 1.39484* | 3.87249 |
Table 4.
Johansen test for co-integration
The null hypothesis is rejected if the trace statistic is more than the 5% critical value, according to the rule of thumb. As seen in the Table 4, there exists a significant long term relationship among variables under consideration and, therefore, it is appropriate to estimate growth model using VECM.
Since the coefficient of co-integrating equation one (CE1) is positive and significant, it implies that there is no long-run causality running from Official Development Assistance, Private External Resource flows, Final Government Consumption Expenditure, Growth Capital Formation, and Trade Openness (explanatory variables) to GDP per capita growth.
The coefficient on per capita GDPt-1 does not meet the expectations. Per capita GDP growth is statistically significant meaning that there is a significant and negative short run causality running from previous year’s per capita GDP growth to current year’s GDP per capita growth. This suggests that if GDP per capita growth in the previous year increased by 1%, GDP growth in the current year would decline by 0.44% in the short-run. The economic growth of this year is influenced by the growth of the previous year. Part of the reason could be the economy that has been slowing down due to ongoing power outages, putting Zambia in recession for the first time in 22 years and Copper price volatility, combined with a sharply weaker currency value since 2011.
ODA is statistically significant at the 10% level, implying that it has a significant and positive impact on the economic growth in the short run. Private External Resource Flows is found to be statistically significant, and this implies that there is a significant and positive short-run causal relationship between private external resource flows and GDP per capita growth. However, Gross Capital Formation is statistically insignificant, and this implies that there is no significant short-run causal relationship between gross capital formation and GDP growth. In the meantime, Government Consumption Expenditure and Trade with Openness are statistically insignificant in the short run.
Short-run Equation is written as follows:
The short-term impact of trade flows on the Zambian economy is negative (Table 5). One of the reasons could be that Zambia relies more on imports than exports. Export diversification is a major challenge for Zambia. Zambian exports are currently highly concentrated in extractive industries, and the country has one of the greatest export concentrations in the world for its level of development (Brülhart et al., 2015). As a result, Zambia’s export revenue is heavily reliant on changes in the price of primary commodities, particularly copper (Chipili, 2016). It also implies that the Zambian Kwacha is highly volatile. This volatility, in turn, makes other types of exports more difficult, potentially impeding export diversification and having a negative impact on the economy.
Table 5.
Vector error correction modeling results
Diagnostic Tests
This study conducted several diagnostic tests such as stability, normality and serial correlation. Serial correlation can be analyzed by Lagrange multiplier (LM) test. It assists in identifying whether the present value of the regression residuals and the lagged values have any relationship. The test found that there was no autocorrelation in the model, as stated in the Table 6.
Table 6.
Lagrange multiplier test for autocorrelation
| Lag | Chi2 | df | Prob > Chi2 |
| 1 | 22.4208 | 36 | 0.96252 |
| 2 | 25.6633 | 36 | 0.89948 |
The Normality test is carried out by using Jarque - Bera test, and the idea is to see whether or not the regression errors in the sample are normally distributed, and the result shows that the data distribution is normal because the p-values are greater than 10% (Table 7).
Table 7.
Jarque–Bera test for normality
| Equation | Chi2 | df | Prob > Chi2 |
| D_lngdp | 1.337 | 2 | 0.51255 |
| D_lnoda | 0.518 | 2 | 0.77170 |
| D_lnperf | 1.337 | 2 | 0.51257 |
| D_lngcf | 1.072 | 2 | 0.58509 |
| D_lnfgce | 0.612 | 2 | 0.73645 |
| D_lnto | 1.192 | 2 | 0.55094 |
| ALL | 6.068 | 12 | 0.91263 |
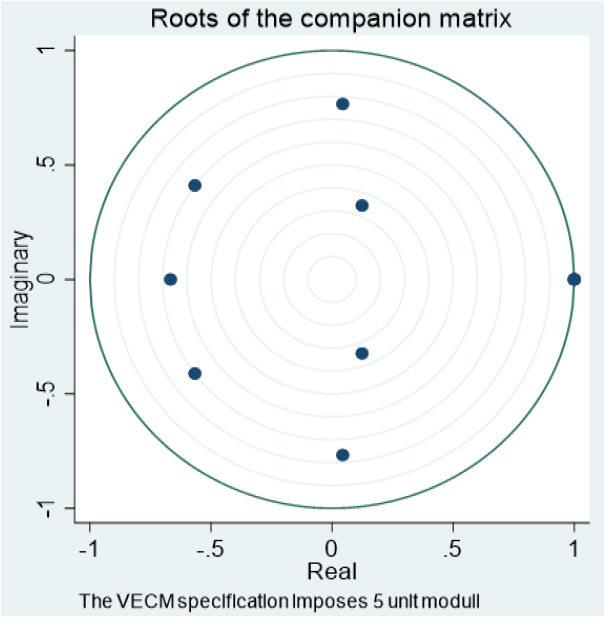
The model stability demonstrates the validity, thus, it should be tested before proceeding. It demonstrates that all of the polynomial’s characteristic roots are contained within the unit circle. The long-run stability of the parameters is also tested by the plot of the recursive graphics with bounds that are within the 95% critical values, as seen in the Fig. 1, and the model satisfies the stability condition.
Finally, the diagnostic tests have revealed that the estimates are efficient, consistent, and reliable in forming economic inferences since their residuals are homoscedastic, normally distributed, and have no serial correlation.
Concluding Remarks
Zambia has made tremendous development progress in the recent decade, both macro-economically and sectorally. Furthermore, Zambia has implemented the Paris/Accra aid effectiveness agenda sooner and more extensively than many other countries. As a result, it’s easy to ascribe observed development progress to aid provided in conformity with this agenda. This investigation was required in the case of Zambia to determine whether ODA can lead to long-term and sustainable economic development.
The VECM results confirmed that there is no long-run causality between per capita GDP growth and the ODA, however, a short-run relationship exist. The research results are consistent with previous scientific and scholarly findings that ODA has a strong and positive impact on growth in low-income countries with proper policies, but has no measurable effect in countries with severely distorted policy regimes. Botswana is a success story in African aid. When it came out of colonial rule in the year 1966, it was ranked as one of the poorest countries in the world, with foreign money serving as the government’s principal source of financing (Leith, 2005). Once some minerals such as diamonds were discovered in Botswana in the year 1970s, the government solicited for donor aid and support to put up massive infrastructure projects, as well as education and training, which has been the country’s main source of growth and development since then. Botswana took off in the early 1990s and progressively transition away from aid (Maipose et al., 1997). Therefore, ODA can still assist Zambia in promoting long-term economic growth by bridging the savings gap, as well as reforming and establishing institutions that could support long-term economic growth and poverty eradication with a focus of social infrastructure.
