

Introduction
Materials and Methods
Sample Preparation
Particle size analysis
Water absorption index, water solubility, and swelling power analysis
Scanning electron microscopic (SEM) analysis
Estimation of total phenolic content
Determination of total flavonoid content
Chromatographic analysis of phenolic acids and single anthocyanin content
Antioxidant capacity analysis
Statistical analysis
Result and Discussion
Analysis of particle size and water solubility
Analysis of bioactive compounds and antioxidant capacity
Conclusion
Introduction
Bora Valley potato has an attractive reddish-purple color and contains high levels of anthocyanins and phenolic acids (Yoon et al., 2008; Lee et al., 2009). Polyphenols are a class of natural compounds that have numerous hydroxyl groups attached to aromatic rings (Lall et al., 2015). Common phenolic acids in potatoes include chlorogenic acid, caffeic acid, cinnamic acid, p-coumaric acid, ferulic acid, and sinapic acid (Friedman, 1997). The predominant phenolic acids in potatoes are chlorogenic acid, caffeic acid, and chlorogenic acid (Brown et al., 2008). Clinical studies have reported that chlorogenic acid could exhibit analgesic, anti-carcinogenic, anti-diabetic, anti-inflammatory, anti-microbial, and anti-obesity effects (Plazas et al., 2013). It is also reported that the consumption of vegetables is directly related to lower incidence of many diseases such as diabetes, obesity, cardiovascular, cancer, and hypertension (de Olivera et al., 2011).
Studies demonstrated that bora valley potato has enough anthocyanin which shows strong antioxidant capacity. Anthocyanins also attributed to having anti-inflammatory and antimicrobial activity (Suda et al., 2008; Wu et al., 2008). The main anthocyanin of potatoes is pelargonidin, cyanidin, delphinidin, peonidin, petunidin, and malvidin (Lachman et al., 2009).
Nowadays, the cooking method of food materials getting special attention owing to their effect on the content of the bioactive compounds. Different cooking condition induces modifications of the physical and chemical characteristics of the food components (Yang et al., 2016). The physical medications employing the reduction of particle size and shape which is the desired parameter for well functioning. The least nano-size particle facilitates invitro water solubility thus eventually influence the effective invivo bioaccessibility. Since the bioaccessibility of secondary compounds is likely to be influenced by processing/cooking methods (Azad et al. 2019). It is reported that cooking facilitates compounds free from their bound form. Cooking methods may cause changes in chemical, physical-chemical, nutritional and sensory aspects in food matrics (van Boekel et al., 2010).
Several food processing methods such as thermal processing, sprouting, and fermentation is being used to enhance secondary bioactive compounds profile and their biological activity (Hotz et al., 2007). Geetha et al. (2014) and Fei et al. (2018) demonstrated that the steaming and cooking process enhances the phenolic content and antioxidant profile of millet. Several studies on cereals have reported that thermal treatments may reduce the phenolic content and their antioxidant activities, depending on the severity of heat treatment, time of exposure and the type of tested food materials (Towo et al., 2003; Zielinski et al., 2006).
Potatoes are always cooked before being eaten, however, there is little published information on the effects of cooking on the properties of its constituents in colored potatoes. Therefore, two different types of cooking methods were used to evaluate the retention of phenolic and flavonoid compounds in bora valley potato. The current study investigated the fate of phenolic compounds and flavonoid content including single anthocyanin content in bora valley potato during the boiling and steaming process.
Materials and Methods
Sample Preparation
The purple potato named ‘Bora valley’ was donated by the Valley Food Tec. LLC, Idaho, USA.
Steaming
About 500 g of bora valley potato (potato: water = 1:5 w/w) were put in an automatic steamer pot (Hamilton Beach Digital Food Steamer Ltd, Virginia, USA) for 20 min at 110°C. The steamed potato was dried in an oven at 50°C and milled with a coffee mill. The flour was passed through a 200 µm sieve and stored at 4°C for further analysis.
Boiling
About 500 g of bora valley potato was boiled in the covered pan using the magnetic induction heating at 110°C for 20 min. The boiled potato was dried in an oven at 50°C and milled with a coffee mill. The flour was passed through a 200 µm sieve and stored at 4°C for further analysis.
Raw bora valley potato
About 500 g of fresh bora valley potato was freeze-dried for 24 h. The freeze-dried potato was milled with a coffee mill. The flour was passed through a 200 µm sieve and stored at 4°C for further analysis.
Extraction of raw and cooked bora valley potato
Potato flour (1 g) was dissolved in 100 mL of ethanol (80%, v/v in water) and then sonicated for 60 min. Afterward, the sonicated extracts were filtered (Advantech 5B filter paper, Tokyo Roshi Kaisha Ltd., Saitama, Japan), and evaporated (Rotatory Evaporator, EYLA N-1000, Tokyo, Japan) at 40°C to get crude extracts. The crude extract was freeze-dried to obtain moisture content < 3%. Finally, the crude extract was diluted using distilled water to prepare a stock solution (1mg/ml) and kept in a refrigerator (-20°C) for further analysis.
Particle size analysis
The particle size of the cooked and raw potato was calculated using a light-scattering spectrophotometer (ELS-Z1000; Otsuka Electronics, Tokyo, Japan). Potato powder 0.3 g was suspended in 30 mL of distilled water. The mixture was centrifuged at 5000 rpm for 10 min to separate the supernatant to analyze the particle size. The particle size and distribution for each formulation was measured 70 times with three replications to get average particle size and particle distribution range.
Water absorption index, water solubility, and swelling power analysis
One gram of potato powder was suspended in 50 mL of distilled water. The mixture was stirred for 1 h at room temperature and then centrifuged at 5,000 rpm for 10 min. The supernatant was decanted into an evaporating dish of known weight. The moisture content of the sample was measured by the moisture meter, and 2-3% of the moisture could measure the water-related parameters. Water absorption index (WAI), water solubility (WS), and swelling power (SP) were calculated by the following formulas described by Piao et al. (2015).
| $$\mathrm{Water}\;\mathrm{Absorption}\;\mathrm{index}\;(\mathrm{WAI})=\frac{\mathrm{wet}\;\mathrm{sediment}\;\mathrm{weight}}{\mathrm{dry}\;\mathrm{sample}\;\mathrm{weight}}$$ | (1) |
| $$\mathrm{Water}\;\mathrm{Solubility}\;(\mathrm{WS})=\frac{\mathrm{dry}\;\mathrm{supernatant}\;\mathrm{weight}}{\mathrm{dry}\;\mathrm{sample}\;\mathrm{weight}}\;\times100$$ | (2) |
Scanning electron microscopic (SEM) analysis
The morphological features of cooked and raw potato particles were examined using a field emission scanning electron microscope (FE-SEM, SUPRA 55, Carl Zeiss, Oberkochen, Germany). SEM was used to obtain information about the surface morphology of the raw and cooked potato powders. The sample preparation for the SEM followed the method suggested by Chetana et al. (2013) with some modifications. The potato powder was placed on the sample
holder with the help of double scotch tape and then, the powder was sputter-coated with gold/palladium (2 min, 2 mBar). Each sample was observed at an accelerating potential of 10 kV under a high vacuum condition, and 1000 and 3000 image magnifications were used.
Estimation of total phenolic content
Folin–Ciocalteu method (Singleton and Rossi, 1963) was performed to estimate the phenolic content of the cooked and raw potato. Firstly, a reaction mixture was fabricated using 1 mL of sample (1 mg/mL), 200 µL of phenol reagent (1 N), and 1.8 mL of distilled water. The mixture was vortexed, and 3 min after, 400 µL of Na2CO3 (10%, v/v in water) was added. Afterward, 600 µL of distilled water was added to adjust the final volume (4 mL) and left at room temperature for incubation (1 h). The absorbance was taken at 725 nm, and the phenolic content was calculated from the calibration curve of the Gallic acid standard. The content was measured as mg of Gallic acid equivalent per 100 g dry weight (dw).
Determination of total flavonoid content
The content of total flavonoid (TF) was evaluated as described by Muller et al. (2006) with slight modifications. In brief, 500 µL of powder extract (1 mg/mL) was mixed with 100 µL of Al(NO3)3 (10%, w/v) and 100 µL of CH3CO2K (1 M) solution, and finally, 3.3 mL of DW (distilled water) was added to adjust the volume up to 4 mL. The reaction mixture was vortexed and left at room temperature for incubation (40 min). The absorbance was measured through a UV-Vis spectrophotometer at 415 nm. The total flavonoid was measured as mg/100 g of cyanidin equivalents on a dry weight basis.
Chromatographic analysis of phenolic acids and single anthocyanin content
Major phenolic components of potato viz. ascorbic acid, caffeic acid, ferulic acid, and chlorogenic acid and major anthocyanin such as cyanidin, delphinidin, pelargonidin, and malvidin were analyzed using HPLC (Shimadzu LC-20AT, Kyoto, Japan).
The configuration of an HPLC system for caffeic acid, ferulic acid, and chlorogenic acid was with two gradient pump, a C18 column (YMC AM303, 4.6 mm × 250 mm), a UV detector (UV-VIS detector), flow rate 1 ml/min, injection volume 10 µl, the temperature at 30°C were used. Solvent A was 0.1% acetic acid in water and solvent B was 0.1% in acetonitrile. Gradient elution system was used A: 90% and B: 10% for 2 min, A: 70% and B: 30% for 27 min, A: 10% and B: 90% for 50 min, A: 0% and B: 100% for 51 min, and A: 82% and B: 8% for 60 min.
A modified protocol reported by Gahler et al. (2003) was used for ascorbic acid analysis. Fresh bora valley samples (10 g) were mixed with 40 mL of 5% metaphosphoric acid and blended to extract ascorbic acid. The mixtures were shaken at 250 rpm for 5 minutes and then centrifuged at 3,000 × g for 10 min. The supernatants were used to determine the concentration of ascorbic acid using the HPLC system equipped with a C18 column (Agilent Technologies 1200 Series), sample inject 3 µml, column temperature 30°C. The extract was eluted with the mobile phase (HCN 5%, water 95% with 0.1% formic acid) at a flow rate of 0.3 mL/min, run time 30 minutes. The ascorbic acid concentrations were determined against ascorbic acid standards (Mallinckrodt Baker, Inc., Phillipsburg) expressed as µg/100 g.
For single anthocyanin analysis a column YMC trials C18 (250 × 4.6), UV-VIS detector (535 nm) with oven temperature at 25°C were used. Solvent A was water: formic acid (90:10), and solvent B was acetonitrile: MeOH: water: formic acid (22.5:22.5: 40: 10). Gradient elution system was used A: 75% and B:25% for 35 min, A: 35% and B:65% for 45 min, A:0% and B:100% for 46 min, A:35% and B:65% for 50 min, and A:75% and B:25% for 60 min, A:93% and B:7% for 70 min. The lambda max (λ) of the phenolic acids and anthocyanin was demonstrated in Table 1. A standard curve was calibrated using pure standards of analyzed compounds with high linearity (r2 > 0.995) by plotting the peak area of standard samples. All samples were analyzed in triplicate, and each phenolic acid and single anthocyanin content was expressed as µg/100 g.
Table 1.
Lambda max values of various phenolic acids and single anthocyanin for HPLC analysis
| Compound | Lambda Max (λ max) |
| Ascorbic acid | 254 |
| Caffeic acid | 280 |
| Ferulic acid | 320 |
| Chlorogenic acid | 280 |
| Cyanidin | 535 |
| Delphidin | 549 |
| Pelargonidin | 524 |
| Malvidin | 547 |
Antioxidant capacity analysis
In this analysis, DPPH (2,2-diphenyl-1 picryl hydroxyl) was used to assess the antioxidant capacity of cooked and raw potato extract following the method of Braca et al. (2003). The DPPH solution was prepared by dissolving 5.914 mg in 100 mL of methanol, and the absorbance range was maintained from 1.1–1.3 by a spectrophotometer. Briefly, 1 mL of bora valley potato extract was mixed with 3 mL of DPPH solution, and the mixture was left in a dark environment (at room temperature, for 30 min) after shaking vigorously. The DPPH solution (3 mL) with distilled water (1 mL) was considered the blank sample. The absorbance was measured at 517 nm using a UV-Vis spectrophotometer (UV-1800 240 V, Shimadzu Corporation, Kyoto, Japan). The scavenging capacity of the potato sample was calculated using the following formula and result expressed as a percentage:
| $$\mathrm{Inhibition}\;(\%)=\lbrack(\mathrm{blanksample}-\mathrm{extractsample})/\mathrm{blanksample}\rbrack\;\times100\;$$ | (4) |
Statistical analysis
All data were expressed as the mean ± SD of triplicate measurements of the samples. The obtained results were compared among the cooked and raw potato to observe the significant differences at the level of 5%. The paired t-test between the mean values of the cooked potato and raw were analyzed by MINITAB (Version 17.0, Minitab Inc., State College, PA, USA).
Result and Discussion
Analysis of particle size and water solubility
Particle size and particle distribution are important parameters of a suspension that estimates the rate of membrane permeability and availability of the compound in the intestine [Sinko et al., 2011]. It is observed from Table 2 that particle size was significantly reduced in boiled potato (125 nm) compared to the steamed (145 nm). Fig. 1 and Table 3 show the particle size distribution of the cooked and raw potato referred to as “polydispersity index” (PI). There were no significant changes observed in PI for the cooked and raw potato. A splitting and narrow range of particle distribution (0.27%) were observed in the boiled potato, whereas wide particle size distribution found in the steamed and raw potato.
Table 2.
Water solubility of cooked and raw bora valley potato
| Sample | WS1) | WAI2) | SP3) |
| Raw | 31.3 ± 1.11 b | 9.93 ± 0.09 a | 14.45 ± 0.3 b |
| Boiled | 37.6 ± 0.45 a | 9.4 ± 0.09 a | 15.11 ± 0.15 a |
| Steamed | 30.93 ± 0.83 b | 10.89 ± 0.02 a | 15.73 ± 0.16 a |
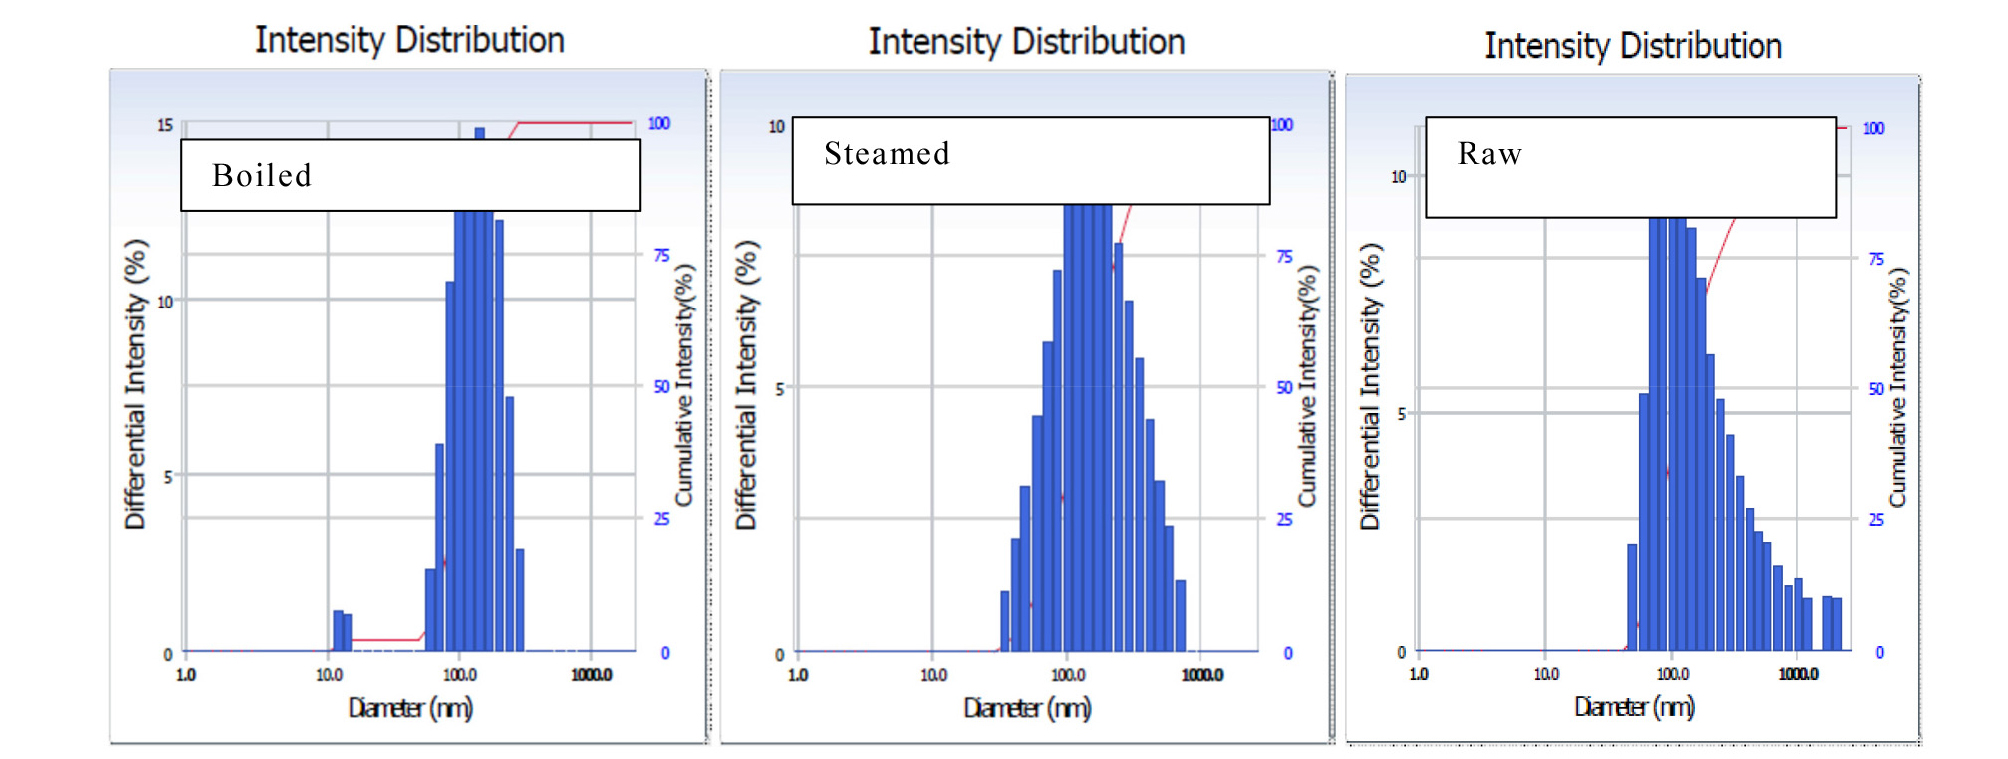
Table 3.
Particle size analysis of cooked and raw bora valley potato
| Treatment | Diameter (nm) | Polydispersity index | Diffusion constant (cm3/sec) |
| Raw | 164.6 ± 1.1 | 0.26 ± 0.01 | 3.919E-8 |
| Boiled | 125.4 ± 4.3 | 0.27 ± 0.01 | 2.914E-8 |
| Steamed | 146.3 ± 2.5 | 0.26 ± 0.01 | 2.912E-8 |
The reduction of particle size is associated with transitions from the crystalline to an amorphous state by the high-energy process (Azad et al., 2018). A decrease in particle size leads to an increase in the dissolution rate (Braca et al., 2003). The PI is an important factor that affects the physical stability of suspension (Chen et al., 2005). A PI value below 0.5 indicates that the formulation is homogeneous (Jahagirdar et al., 2014). All PI values of our samples were below 0.3 thus showing that all samples formed homogeneous nanosuspensions. Water solubility and swelling power provide evidence of interactions between the water molecules and the starch chains in the crystalline and amorphous regions of a matrix. The water absorption index represents the ability of a substance to associate with water under a limited water condition.
Analysis of bioactive compounds and antioxidant capacity
Studies have shown that different cooking methods reduce phenolic compounds in potatoes (Orsak, et al., 2001). Heat-treatment is a complex process that involves many physical, chemical and biochemical changes, which alter the food constituents. During potato cooking, starch gelatinization occurs, which affects the palatability, digestibility and causes softening of the raw starch matrix (Barba, et al., 2008).
Total phenolic content was significantly increased in boiled potato (3774.2 mg/100g) compared to steamed (2026 mg/100g) and raw potato (3169 mg/100g) (Table 4). Likewise, individual phenolic acid such as caffeic acid, and ferulic acid was significantly increased, however, chlorogenic acid and ascorbic acid was reduced in cooked potato compared to the raw potato (Table 5). In the same way, total flavonoid content was significantly reduced in boiled (364 mg/100g) and steamed (235 mg/100g) compared to raw (426 mg/100g) (Fig. 2). In the same way, total anthocyanin, as well as cyaniding, delphinidin, malvidin, was significantly reduced in cooked potato compared to the raw potato except for pelargonidin, (Table 6).
Table 4.
Total phenol content of cooked and raw bora valley potato
| Sample | Phenolic content | Flavonoid content |
| Raw | 3169.52 ± 441.31 b | 426.67 ± 21.83 a |
| Boiled | 3774.29 ± 322.93 a | 364.77 ± 51.46 b |
| Steamed | 2026.67 ± 204.20 c | 235.24 ± 9.18 c |
Table 5.
Phenolic acid content of cooked and raw bora valley potato (µg/100 g)
| Sample | Phenolic content | Flavonoid content |
| Raw | 3169.52 ± 441.31 b | 426.67 ± 21.83 a |
| Boiled | 3774.29 ± 322.93 a | 364.77 ± 51.46 b |
| Steamed | 2026.67 ± 204.20 c | 235.24 ± 9.18 c |
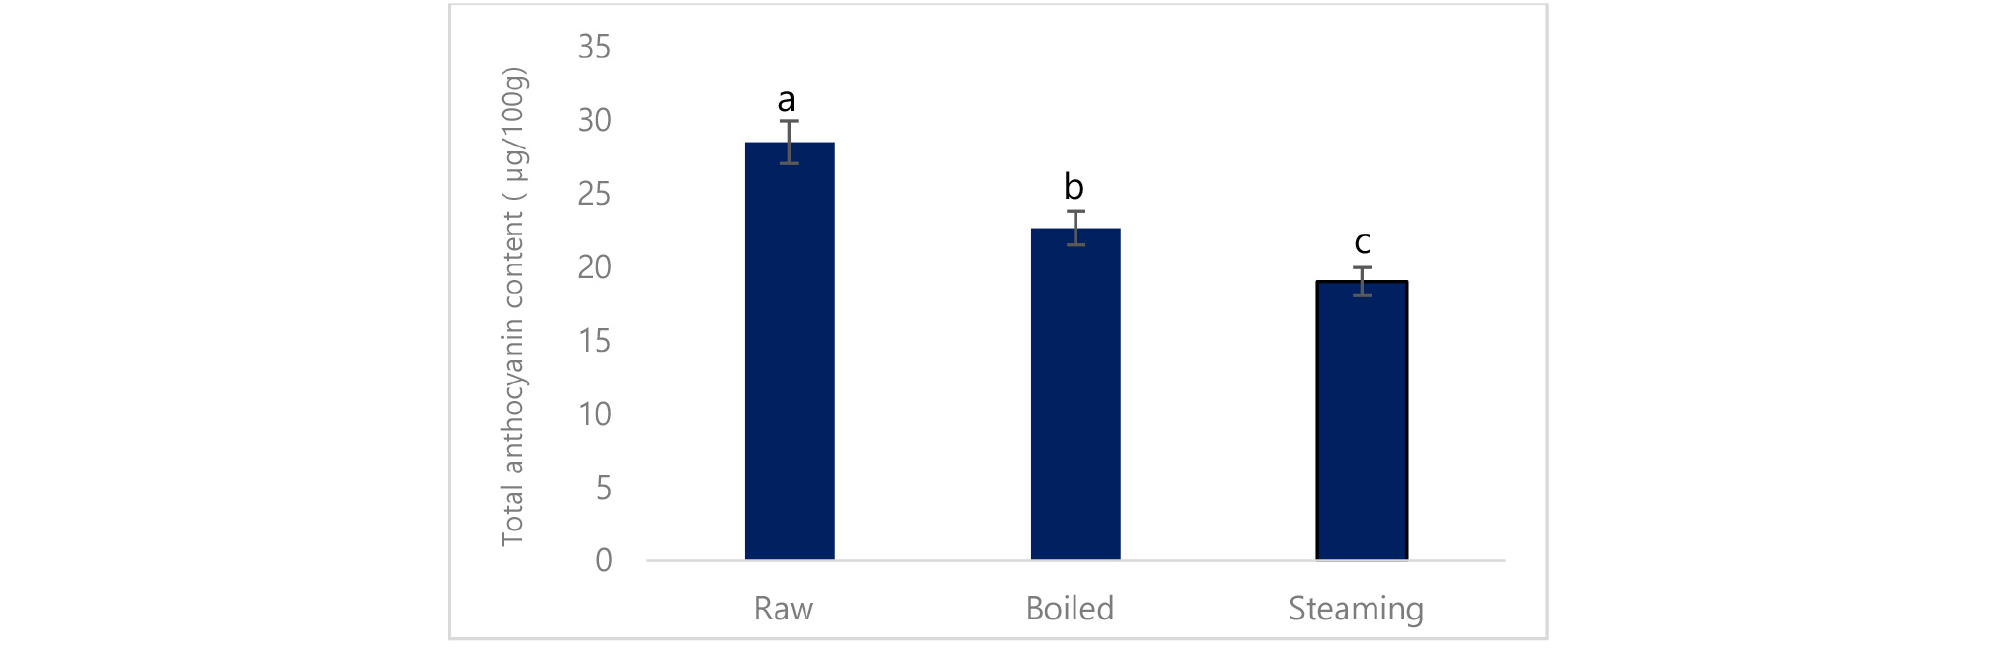
Table 6.
Single anthocyanin content of cooked and raw bora valley potato (µg/100 g)
The results showed that different cooking methods have a significant impact on the retention of secondary metabolites and the antioxidant capacity of bora valley potato. It is well established that processing enhances the secondary metabolites in food materials (Gallegos-Infante et al., 2010; Duenas et al., (2009); Sengul et al., (2014) reported that polyphenol content increased in boiled kale and white cabbage. However, Turkmen et al. (2006) stated that cooked potatoes usually contain less flavonoid especially anthocyanin compared to the raw potato. It is noted that moisture content and oxygen activity in steamed potato are responsible for reducing bioactive compounds content. Our findings indicated that boiled potato represents a significant source of antioxidants, which supports their potential as a natural functional food.
This finding supported by the previous study where Palermo et al. (2014) suggested that the reduction of phenolic acid in cooked food was attributed to leach out water-soluble phenolic compounds into the water. The phenolic compounds are highly reactive species that undergo several reactions during food processing. Increased ferulic acid is might be due to the release of ferulic acid from their bound form during the cooking process. In the same way, total anthocyanin and single anthocyanin including cyaniding, delphinidin, and malvidin except pelargonidin were reduced in cooked potato.
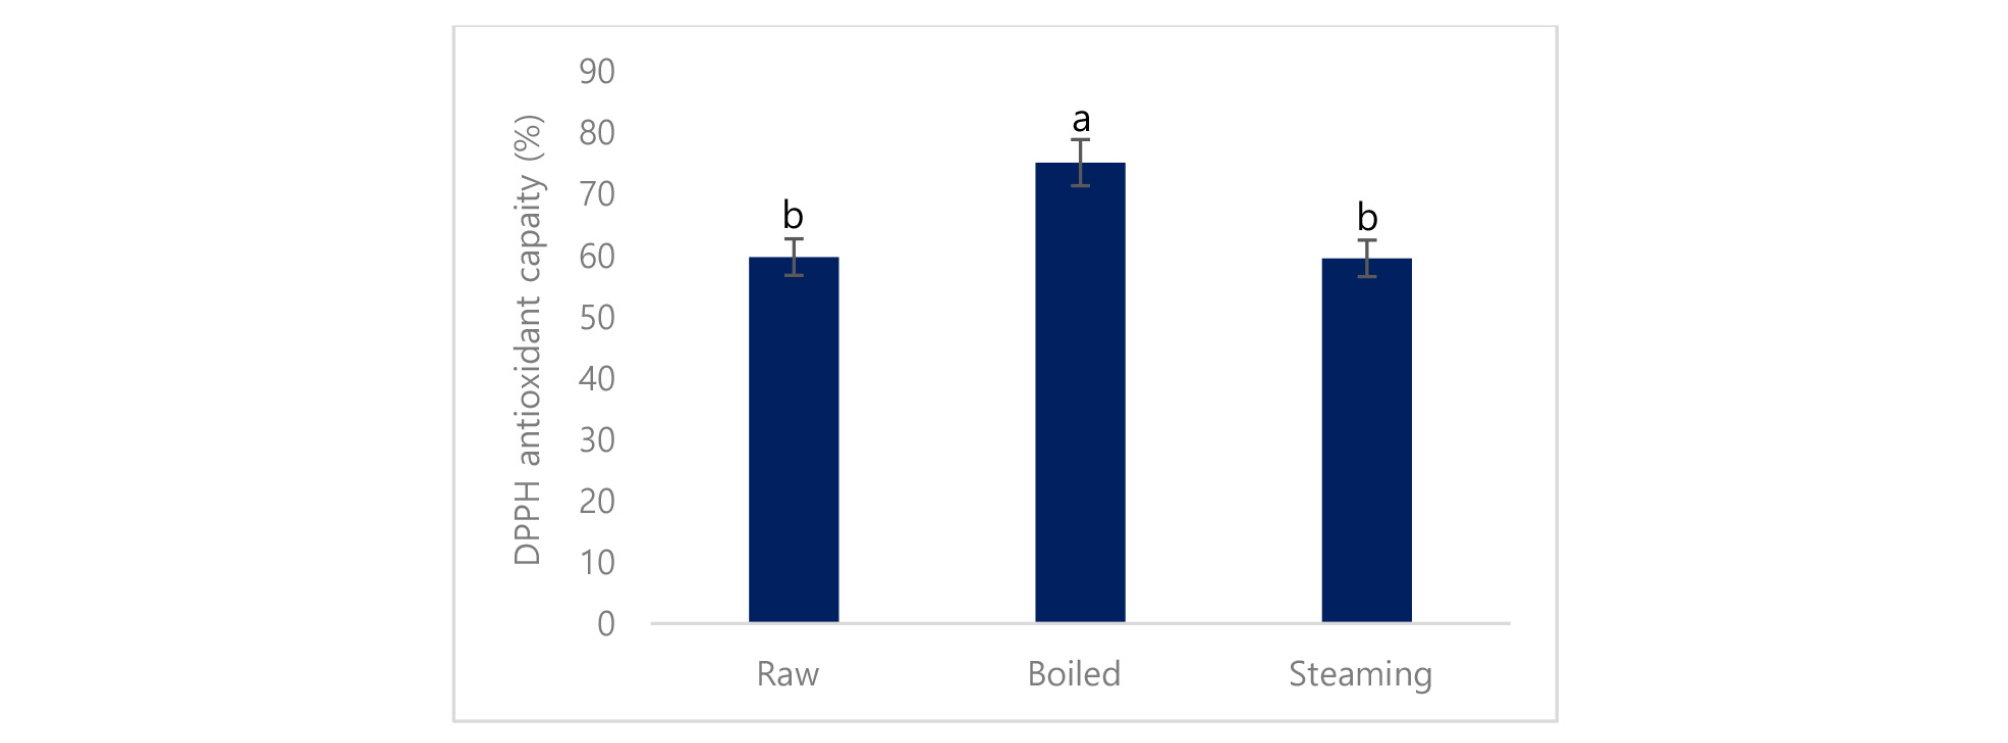
Antioxidant properties of the cooked and raw potato were determined by DPPH. It is confirmed that boiled potato had higher peroxide scavenging capacity (75.2%) than the steaming (59.6%) and raw potato (59.8%) (Fig. 3). Antioxidant capacity is increased using stopping free radical chain reactions by the hydrogen donating properties of the phenolic hydroxyl groups (John et al., 2010). DPPH is a stable free radical used to determine the antioxidant properties or radical scavenging capacity. Our findings indicated that boiled potato represents a significant source of antioxidants, which supports their potential as a natural functional food. Oxidation of phenols can occur as a direct result of the activity of polyphenol oxidase (PPO) enzyme. Loss of polyphenols due to PPO activity during boiling. However, is unlikely because PPO activity would be eliminated during cooking (Rapeanu, et al., 2005).
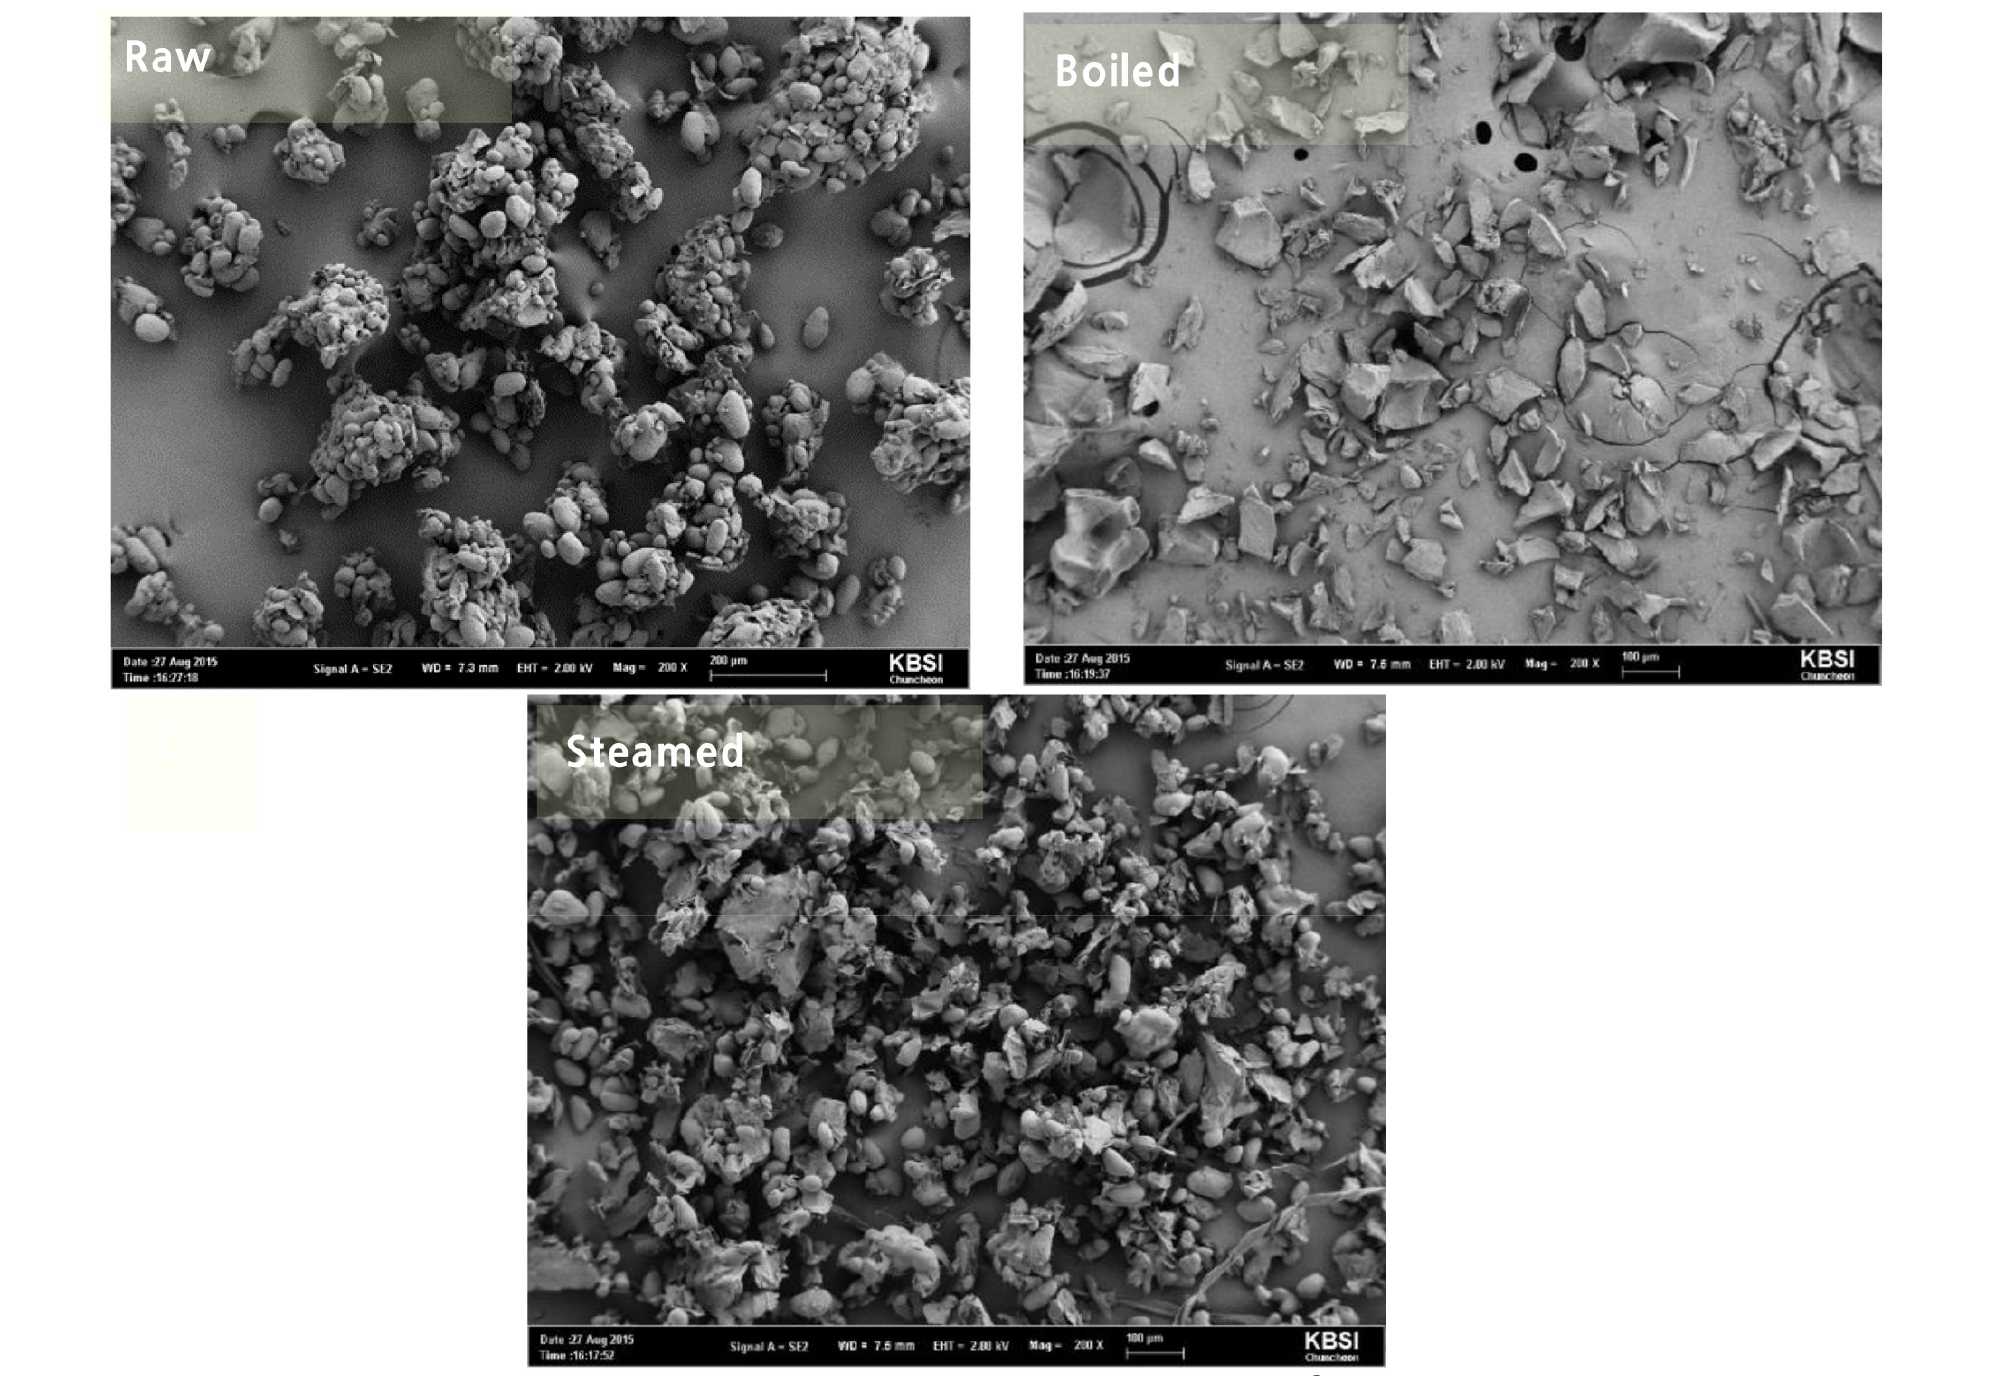
The scanning electron microscopic image demonstrated the particle shape of cooked and raw potato (Fig. 4). It is shown that there is a well-distributed smaller particle in boiled potato whereas particle was flocculated in a bulky amount in steamed potato and roughly accumulated in a raw potato. It has been reported that particle geometry can significantly affect the permeability and bioavailability of active compounds in the gastrointestinal tract. The bioavailability of the active compounds has been mostly limited to different particle sizes (Banerjee et al., 2016). It is observed from the figure that boiled potato well dispersed. Therefore, it is assuming that boiled potato would be more bioavailable than the steaming and raw in the gastrointestinal tract.
The higher antioxidant capacity of the boiled potato is due to the breakdown of cellular constituents and membranes. Food processing that involves heating has been shown to alter flavonols and these alterations directly affected the antioxidant status of plant tissues (Makris and Rossiter, 2001). The Maillard reaction occurs during heating and allows the formation of different intermediate byproducts, which might contribute to the antioxidant properties (Vaher et al., 2010; Chandrasekara et al. 2009). From the current study, a strong correlation between phenolic compounds and antioxidant properties in potato was shown, which is supported by the previous study (Azad et al., 2018; Azad et al., 2019). It was also reported that total phenolic content and antioxidant capacity had a highly significant linear correlation (Azad et al., 2018). The increases in the antioxidant capacity of treated samples were due to the increase in the total polyphenol and flavonoid compounds (Kim et al., 2006).
Conclusion
The result showed that the cooking process reduced most of the phenolic acids and anthocyanin content. However, total phenolic content and ferulic acid were increased in boiled potato. Likewise, total flavonoid content, as well as cyanidin, delphinid, malvidin except for pelargonidin, was reduced in cooked potato. Total antioxidant capacity was increased in boiled potato. The scanning electron microscopic image showed a well-dispersed nanoparticle in boiled potato powder. Overall, it is concluded that boiling is the superior cooking method to the retained higher functional quality of bora valley potato.
