

Introduction
Materials and Methods
Plant materials and growth conditions
The bacterial inoculation, image processing, and disease incidence determination
Statistical analysis
Results
Analysis of variance of DI and VIs
The percentage of DI of the bacterial wildfire on soybean cultivars
The effect of the bacterial wildfire on NDVI
The effect of the bacterial wildfire on PRI
The effect of the bacterial wildfire on ARI
The correlation between DI and VIs
Discussion
Conclusion
Introduction
Soybean [Glycine max (L.) Merr.] is the world’s most broadly cultivated seed legume; rich in protein and oil, and is the most commonly used in the diets of both humans and animals (Mutava et al., 2015). In the 2020/2021 market year, soybeans contributed to 70.86% of the global supply of plant-based protein meals and 28.88% of plant-based oil respectively (Lin et al., 2022). However, soybean production is facing many problems caused by both biotic and abiotic factors. Biotic factors involve diseases caused by nematodes, fungi, viruses, and especially bacteria. These factors are the main reason for the yield losses in soybean production regions (Deshpande et al., 2014). A disease infection can reduce the plant’s normal state, and disrupt or prevent its vital processes and functions such as photosynthesis, transpiration, pollination, fertilization, and germination (Karmokar et al., 2015). According to the Brazilian Distribution Agency, soybean disease is responsible for an estimated yearly loss of 15% to 20% of the annual crop in Brazil (Araujo and Peixoto, 2019), and more than 35% of crop production loss is noted every year due to plant disease in India (Singh et al., 2020). Thus, plant disease is considered a significant negative factor impacting the yield potential of crops worldwide (Nagasubramanian et al., 2018).
One of the most impactful bacterial diseases causing yield loss in soybeans is bacterial wildfire (Hong et al., 2012). First reported in soybeans in 1943, this disease is caused by Pseudomonas syringae pv. tabaci (Pst) (Allington, 1945). In the case of South Korea, bacterial wildfire was first found in the soybean fields in Boeun City and Munkyung City in 2006 and 2007 (Myung et al., 2009). Notably, this bacterial disease can have a wide range of host plant species, including tobacco, beans, soybeans, coffee, and papaya (Sun et al., 2021). The wildfire disease symptom appears with light-brown necrotic patches on leaves that can vary in size and are surrounded by vast yellow haloes and dark brown or black necrotic patches with an imprecise halo are also observed on the infected plants (Kang et al., 2015). For successful plant management activities improved monitoring of plant disease should be done which depends upon the early detection, prediction, and classification of the diseases. This encompasses various management practices such as soil preparation, sowing, fertilizer and manure addition, irrigation, pesticide application, harvesting, and storage (Tichkule and Gawali, 2016). Moreover, various kinds of plant diseases can share similar symptoms which makes detection and identification more challenging and requires specialized techniques (Kumar et al., 2021). In most cases, disease symptoms can be found on the plant leaves, stems, and fruits but the leaves are widely considered for disease identification due to early symptoms being visible on the leaves’ surface (Khirade and Patil, 2015). Traditional methods of disease identification and characterization by expert plant pathologists, visual monitoring, microbiological tests, and serological tests limit the accuracy and might be time-consuming as well (Bock et al., 2010; Cui et al., 2009). The image processing technique covered in the section on high throughput phenotyping for disease diagnosis is the most well-known alternative to these traditional methods (Li et al., 2014).
Accurate management of the disease severity is important to predict the disease progression, yield loss, and the plant’s response to the pathogen infection. However, human eye evaluation will be significantly different from one to another (Sherwood et al., 1983). Diseases caused by pathogens can be detected and quantified as symptoms through hyperspectral imagery (HSI), red, green, and blue (RGB) digital cameras, image analysis, and visual assessment by the method of plant remote sensing which is an essential digital agricultural technology that offers both short-term and long-term monitoring of plants (Kior et al., 2021). Recently, researchers have developed new imaging technologies that use machine vision, deep learning, remote sensing, robust approaches, and digital imaging systems for plant disease specification which has drawn a lot of attention in the early detection of several plant diseases (Ngwangum et al., 2022). The use of digital image processing to identify or detect diseases at an early stage either in medical science or plant science has been widely prevalent (Padmavathi and Thangadurai, 2016). Digital cameras, serving as a source of RGB images which are important tools in plant pathology for assessing plant health, disease detection, identification, and quantification provide more easiness in handling and image acquisition (Mahlein, 2016). Therefore, the RGB method with color and texture is extensively utilized in agricultural research with several advantages (efficient, economical, and easy to operate) for plant image analysis, and modern models like Hyperspectral Imaging (HIS) which can gather images with high spatial resolutions provide more insight into the spectral image analysis (Chaudhary et al., 2012; Mahlein, 2016). The HSI is an effective non-destructive method of monitoring the plant pigment which is directly related to the physiological status or pathogen infection of the plant. Similarly, it is a technique of high-throughput phenotyping where quantitative methods are used for collecting and analyzing this information with the complex features associated with biotic and abiotic stress adaption (Huang et al., 2018). The hyperspectral cameras as a part of the imaging system can recognize various plant stresses, including drought, nitrogen deficiency, pests, and diseases as well as differentiate between various plant species (Lee et al., 2014). The hyperspectral method is useful for disease prediction, capturing both spectrum and imaging information within the same objective, covering hundreds of wavebands, and gathering the data on a wide range of variables, including shape, color, and texture information, vegetation indices, and spectral reflectance (Xie et al., 2017). The ability of canopy spectra to identify specific biochemical or metabolic changes in the plants that may be invisible to the naked eye makes this method potentially valuable for both the early detection of plant diseases and disease classification. (Bajwa et al., 2017). Besides, HSI data can provide significant information on spectral measurement capabilities over conventional systems, as well as improvements in spectral information content for early-stage vegetative stress detection, identification of the small difference in percent green vegetation cover, discrimination of land cover types, leaf pigment concentrations evaluation, modeling of quantitative biophysical and yield characteristics of crops (Krezhova and Kirova, 2011). In the current study three different types of vegetative indices (VIs) were used which included; The logical order of VIs was mentioned NDVI, PRI and then ARI. Thus, the order should be changed to ii) Photochemical reflectance index (PRI) measures the light-use efficiency of foliage, primarily employed as a marker of water stress and evaluates the uptake of carbon dioxide by plants and it is also sensitive to changes in carotenoid pigments in live plants, especially xanthophyll pigments (https://www.l3harrisgeospatial.com), and iii) Anthocyanin reflectance index (ARI) measures the anthocyanin content present in the leaves which gives red pigmentation (Gitelson et al., 2001).
Very few researches have been reported regarding the detection of bacterial wildfire and its management practices on soybeans, although this bacterial disease is causing a greater threat to production and productivity. Similarly, there is a paucity of knowledge on tolerant and resistant soybean cultivars to this disease, and the majority of this study has been concentrated on the late stages of plant maturity rather than early signs of bacterial wildfire. In our study, we use both the HSI and the RGB image for the detection and evaluation of the presence or absence of the disease. Thus, in this study, we aim (i) to investigate and evaluate the response of different genotypes of soybean to bacterial wildfire, (ii) to utilize RGB images for disease evaluation and (iii) to measure different vegetation indices after inoculation of the bacterial wildfire by using hyperspectral imaging.
Materials and Methods
Plant materials and growth conditions
Sixteen soybean cultivars were used for the evaluation in this study (Table 1). The bacterial wildfire culture was obtained from the Rural Development Administration (RDA) of South Korea. Seed sowing was done on July 20th, 2022 in small pots [9.5 cm (diameter) × 9 cm (height)], filled with the horticulture soil (zeolite 4%, cocopeat 68%, perlite 7%, rough stone 6%, pittmoss 14.73%, fertilizer 0.201%, a wetting agent 0.064 and pH modifier 0.005) with 2 seeds in each pot later on thinned to 1 after a week (Fig. 1a). The experimental design consisted of control and treatment with 6 replications (n=1). The plants were grown in the plant growth chambers placed in the crop production laboratory at Kyungpook National University, Daegu, South Korea. The chamber conditions were set for 14 hours of the day and 10 hours of the night, 70% ± 10 relative humidity and 30°C day and 27°C night temperature. Plant irrigation was done every day with 150 ml of water in each pot.
Table 1.
List of soybean cultivars used
| SN | Name |
| 1 | Aram |
| 2 | Chamul |
| 3 | Cheongja |
| 4 | Cheongja 4 |
| 5 | Cheongja 5 |
| 6 | Daechan |
| 7 | Daechan jonggyun (Bigarit) |
| 8 | Daeheuk |
| 9 | Daephung 2 |
| 10 | Danmi 2 |
| 11 | Miso |
| 12 | Shinhwa |
| 13 | Soyun |
| 14 | Seunphung |
| 15 | Taekwang |
| 16 | Uram |
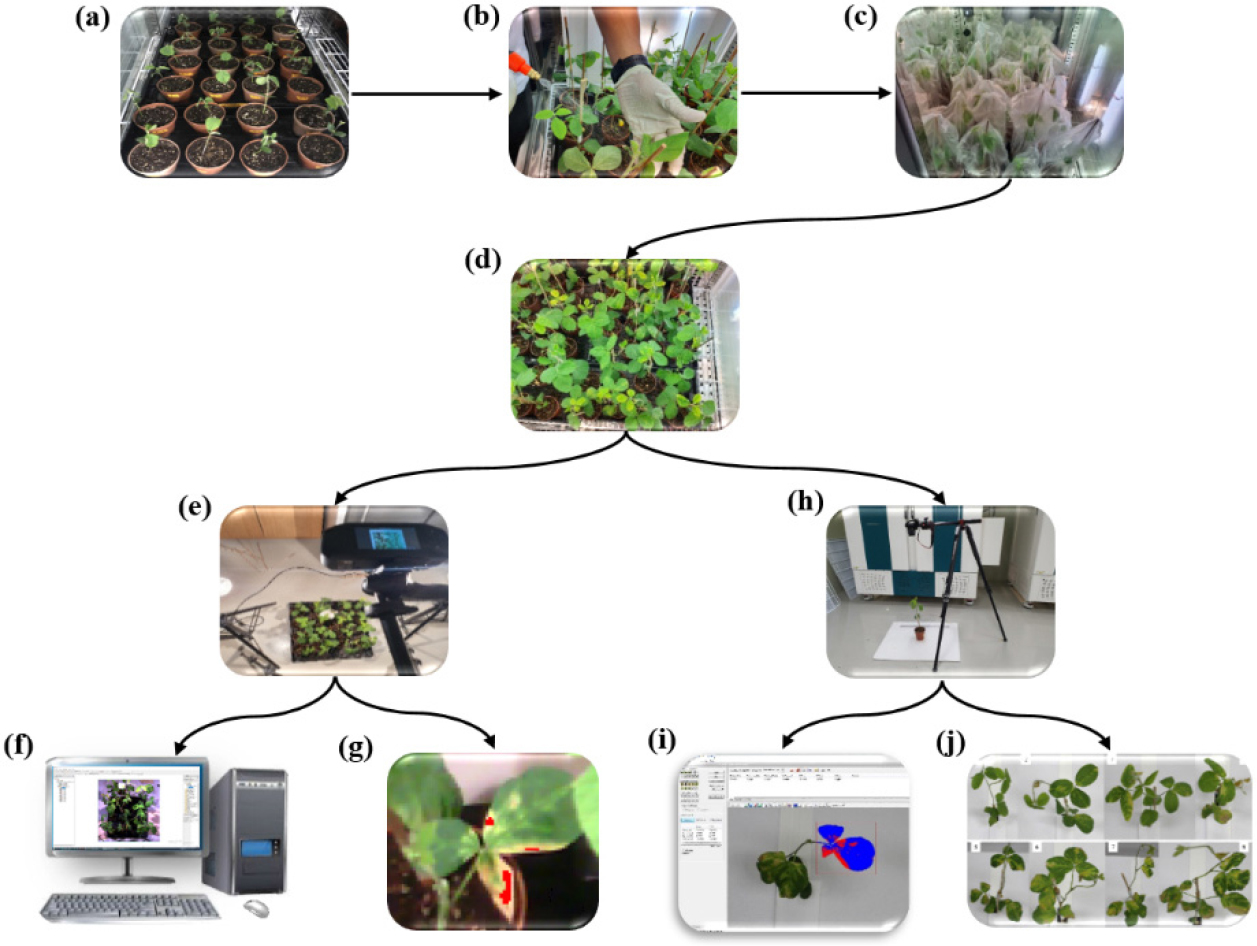
Fig. 1.
A general framework of the methodology. (a) Seedlings in the plant growth chamber, (b) inoculation of bacteria, (c) plant covering after inoculation, (d) symptomatic plants, (e) hyperspectral imaging of plants, (f) analysis of hyperspectral images using ENVI, (g) image annotation, (h) digital imaging of plants, (i) analysis of digital images using WinDIAS 3 (Image Analysis System), and (j) scoring based on DI.
The bacterial inoculation, image processing, and disease incidence determination
The Pst strain BC2367 was obtained from RDA. Soybean plants were inoculated with bacteria when they reached the vegetative growth stage (V2) by spraying bacterial culture on the entire leaves (Fig. 1b). Then, the plastic bag was used to cover the plant pots for 24 hours to maintain high humidity (Fig. 1c). The hyperspectral and RGB images and rating scores were evaluated and determined based on the DI for 7 consecutive days. Specim IQ portable hyperspectral camera of model number WL18 MODGB was used for taking the hyperspectral images (Fig. 1e). The camera is based upon push-broom technology and can capture 2D images with 512 × 512 pixels resolutions and can record 204 spectral bands. Hyperspectral transmission images provide a huge amount of data for whole soybean plants. This massive amount of data is reliable and crucial for detecting bacteria-damaged soybean leaves. To ensure the integrity of each plant, a specified region of interest (ROI) was selected from each relative hyperspectral transmission image in the region of each soybean leaf. The ROI was manually selected based on the region of each interest, and hyperspectral wavelength data were acquired using reference data for the multispectral camera using the software Environment Visualizing Images (ENVI) V.5.5.3 (Research System, Inc., USA) (Fig. 1f). To identify the effect of the bacterial disease on the shoot of all the cultivars, digital images (6000 × 4000 pixels of dimensions, 1/100 second of exposure time, ISO-400 of speed, and 24 mm of focal length with normal exposure program) of the plant samples were taken 2 DAI by Canon, Japan with specification in Table S1 (Fig. 1h). The collected shoot images were analyzed with the WinDIAS image analysis system (Delta-T devices, United Kingdom) (Fig. 1i).
Statistical analysis
Three main vegetation indices; NDVI, PRI, and ARI were identified as shown in Table 2 using the ENVI software over the 400-1000 nm wavelength range, which comprised 204 wavebands for each image. Likewise, the results of the RGB images analyzed for disease percentage were reported as mean values and standard errors (SE) using the Microsoft Excel (2019) program. To determine statistical significance, an analysis of variance (ANOVA) test was conducted (SAS release 9.4; SAS, Gray, NC, USA). Mean value differences were determined using the Student’s t-test at significance levels of P ≤ 0.05, P ≤ 0.01, and P ≤ 0.001. A correlation test (Pearson’s r) was used to determine the linear correlation between disease incidence and vegetation indices.
Table 2.
Vegetation indices equations used
| Index | Equation |
| NDVI | (Rouse et al., 1974) |
| PRI | (Gamon et al., 1992) |
| ARI | (Gitelson et al., 2001) |
Results
Analysis of variance of DI and VIs
An ANOVA test was performed to identify the response of the soybean shoot to infection of bacterial wildfire. According to Table 3, DI, PRI, and ARI showed a significant difference between the cultivars (P < .0001). Additionally, NDVI also showed a significant difference between the cultivars (P = 0.0003). These results suggest that the DI and the three VIs were dependent upon the cultivars.
Table 3.
Analysis of variance (ANOVA) of DI and VIs
The percentage of DI of the bacterial wildfire on soybean cultivars
Based on the RGB image that we took from 2 DAI until the end of experimental day, we observed the cultivar-dependent percentage of incidence appearing on the leaf as shown in (Fig. 2). Among the 16 cultivars, Taekwang showed the highest DI throughout the experimental period after the pathogen inoculation which was significantly different from other cultivars, where the highest disease incidence was observed on the 5 DAI (52.41%) which gradually decreased afterward reaching the lowest at 8 DAI (36.38%) (Fig. 2). With the progressive increase in the experimental period a general trend of increase in the DI can be observed in (Fig. 2) and later on, this DI gradually decreased, although the DI remained below 22% for the other 15 cultivars throughout the experimental period. Aram (6.74%), Chamul (3.73%), Cheongja (2.92%), Cheongja 4 (2.87%), Cheongja 5 (8.47%), Daechan (5.46%), Daechan jonggyun (Bigarit) (6.38%), Daeheuk (9.36%), Daephung 2 (3.52%), Danmi 2 (4.76%), Miso (9.70%), Seunphung (6.23%), Shinhwa (5.22%), Soyun (2.29%), and Uram (4.91%) showed the lowest DI at the end of the experiment although there was no statistically significant difference among other cultivars (Fig. 2). A sharp increment in the DI can be observed only in the Taekwang with a rapid increase from 13.66% (2 DAI) to 41.22% (3 DAI). A decrease in DI in the later stage can be seen for all cultivars (Fig. 2). This pattern of an increase in DI in the initial period and a decrease in the later, might be due to the curling and shrinkage of the leaves which caused the decrease in the DI calculation using the RGB images. The evaluation for the bacterial wildfire tolerant and sensitive cultivars was done through classified scoring which is based on symptomatic regions observed on the leaves. The basis of the evaluation of the DI is classified in (Table 4). As mentioned earlier, the DI varied according to the cultivars particularly, Taekwang showed a significantly higher disease rate compared to the other cultivars throughout the experimental period.

Table 4.
Classification of the different levels of tolerance and susceptible cultivars based on DI level
| Score | Rate (%) | Classification |
| 1 | 0-20 | Tolerant |
| 2 | 21-40 | Moderately tolerant |
| 3 | 41-60 | Moderately Sensitive |
| 4 | 61-80 | Sensitive |
| 5 | 81-100 | Very Sensitive |
The effect of the bacterial wildfire on NDVI
A significant decrease in NDVI value was observed on 7 different cultivars on 2 DAI [Cheongja 4, Daephung 2 (P ≤ 0.05) and Taekwang, Daechan, Daechan jonggyun, Daeheuk, Shinhwa (P ≤ 0.01)] as compared to that of the control (Fig. 3). Cheongja and Seunphung, these two cultivars showed a significant decrease (P ≤ 0.05) in NDVI only after 5 DAI (Fig. 3). Ultimately, on the 6 DAI, all the cultivars displayed a significant decrease in the NDVI value differing only on the level of significance value depending upon the cultivars (Fig. 3). The Taekwang cultivar which displayed the highest DI showed a significant decrease in NDVI from the beginning (2 to 5 DAI with P ≤ 0.01) until the end of the experiment (from 6 to 8 DAI with P ≤ 0.001), which was a different nature in compared to the other cultivars (Fig. 3).

The effect of the bacterial wildfire on PRI
The PRI shows the photosynthesis efficiency as this index is based upon the reflectance of red and blue light which is a key component of photosynthesis (Fig. 4). According to the result, at 2 DAI Aram, Cheongja 4, Daechan, Daechan jonggyun, Daephung 2, Danmi 2, Shinhwa, and Taekwang showed a significantly decreased in PRI for bacterial wildfire inoculated cultivars as compared to that of control whereas other cultivars revealed non- significant difference (Fig. 4). From 3 DAI to 8 DAI, all the cultivars showed decreased PRI in treated cultivars whereas Taekwang revealed a significantly lower decreased PRI in comparison with control (Fig. 4).

The effect of the bacterial wildfire on ARI
According to Fig. 5, ARI showed a significant difference among treated and untreated cultivars in 2 DAI to 8 DAI in almost all cultivars except for Uram (2 DAI), Seunphung (4 DAI), Soyun (6 DAI), and Cheongja 4 (8 DAI) where these cultivars showed a non-significant difference (Fig. 5). Among these cultivars, Seungphung and Soyun cultivars displayed the lower DI previously (Fig. 5). The Taekwang cultivar which showed the highest DI had a highly significant difference (P < 0.001) in ARI measurement throughout the experimental period (Fig. 5). Cultivar-dependent ARI in both the controlled and the treated plants can also be observed in the figure below.

The correlation between DI and VIs
A correlation test was done to observe the relation of DI with the other three VIs (Fig. 6). A negative correlation of DI with NDVI and PRI and a positive correlation with ARI was observed throughout the experimental period (Fig. 6). The highest significant value was observed on 6 DAI for PRI (r = -0.37, P ≤ 0.001) and ARI (r = 0.25, P ≤ 0.05) with DI, although the value seemed to be less (Fig. 6). Likewise, the highest significant correlation for NDVI with DI was observed on 5 DAI (r = -0.31, P≤ 0.01) (Fig. 6). Similarly, comparison within these three VIs shows that there is a general trend of increase in significance level and correlation value as the experimental period extends (Fig. 6). On the final day of the experimental period, these VIs were significantly (P ≤ 0.001) correlated with each other; NDVI and PRI (r = 0.60), NDVI and ARI (r = -0.42), PRI and ARI (r = -0.75) (Fig. 6). From this result, we can summarize those two major vegetation indices; NDVI and PRI on 3 DAI, and all VIs (NDVI, PRI, and ARI) on 6 DAI respectively can be used for the early detection of bacterial wildfire (Fig. 6).

Discussion
Plant disease is a very serious issue all over the world for crop production. In this study, we used both HSI and RGB methods to detect DI on the shoot of soybeans. Image analysis has been used to identify plant DI based on the severity method (Jadhav and Patil, 2015). We evaluated the disease based on the image analysis method. In total sixteen cultivars were selected and tested for their sensitivity to the bacterial wildfire, based on the result, the DI started at 2 DAI in all soybean cultivars. Among the 16 cultivars, we observed that the DI revealed high incidence in 3 DAI 4 DAI, and 5 DAI, respectively, and started decreasing after they reached the highest peak. Taekwang showed a maximum DI of 52.41% and also exhibited a significant difference in comparison to other cultivars. Taekwang variety has been reported to be more sensitive to bacterial wildfire in comparison to Shinpaldal2 and Daepung (Kang et al., 2015). In our results obtained from the last day of the experiment, we found that the Taekwang cultivar revealed higher DI making it becomes more sensitive cultivar to disease infection compared to other cultivars whereas the other 15 cultivars presented less DI with minor symptoms on leaves. Taekwang has also been found to be one of the most susceptible cultivars to bacterial wildfire disease (Kang et al., 2016). Among all cultivars, three cultivars including Daephung 2, Seunphung, and Soyun exhibited tolerance responses in comparison with others after bacterial inoculation.
VIs measured by hyperspectral reflectance images are precise, time-saving, and nondestructive methods widely used for their capacity to notice variations in vitality between healthy and diseased plants (Gröll et al., 2007). NDVI was used for the quantitative measurement of vegetation by calculating the ratio of visible spectral bands to infrared spectral bands (VIS/IR) (Polivova and Brook, 2021). In our results, NDVI was significantly reduced in all soybean cultivars after inoculation of the bacterial wildfire in comparison to control plants ranging from 24% to 56%. However, Daechan jonggyun and Daephung 2 showed the lowest NDVI value with bacterial wildfire-treated plants as compared to control plants at 2 DAI and 3 DAI respectively. (Gessesse and Melesse, 2019) reported that the plant showed NDVI in high values representing a higher density of green vegetation and dense but NDVI was reduced representing sparse vegetation. It was found that abiotic stress-tolerant genotypes have higher NDVI values than sensitive genotypes (Ali et al., 2022). The purpose of the leaf pigment vegetation indices is to provide a way to quantify the amount of stress-related pigments in plants. When a plant is under stress, concentrations of the stress-related pigments carotenoids (yellow pigments) and anthocyanins (pink, purple, and red pigments) rise (Solutions et al., 2013). PRI is a good measurement parameter of light use efficiency at the leaf, canopy, and ecosystem levels. The PRI takes lead changes to carotenoid pigments, specifically the xanthophyll pigments (yellows) that are absorbed by live foliage and these pigments imply photosynthetically and are useful to enumerate vegetation production and stress (Peñuelas et al., 2013). Furthermore, the composition of xanthophyll pigments was transformed by various plant infections which indicates that PRI could be used to recognize plant disease (Kohzuma et al., 2021). In our result, we observed that PRI was lower in all cultivars after inoculation of bacterial wildfire compared to control plants. The stressed plant exposed to lesser PRI values than non-stress plants has been reported (Kohzuma et al., 2021). Moreover, the lower carotenoid pigment concentrations produce lower PRI values in a physiological stress situation (Gamon and Berry, 2012). Thus, such stress values provide a better comprehension of how the disease process lowers photosynthetic performance as the infection level grows (Oh et al., 2018). ARI, a reflectance measurement that is sensitive to the anthocyanin found in plant foliage, gives important information regarding the physiological health of the plants by indicating changes in the foliage through either new growth or death (Solutions et al., 2013). According to our result, we found that all the cultivars were exposed to increasing ARI after inoculation of the bacterial wildfire as compared with the control. Gitelson et al. (2009) found that the increment of anthocyanin content on leaves decreased the green portion of leaves. In addition, the correlation between DI and VIs was performed in our experiment. The DI revealed a significant negative correlation with the NDVI and PRI but a positive correlation with ARI.
Since every single leaf of each soybean plant was analyzed every single day, the plants had changed patterns themselves, thus after some days the leaves started curving making the visible symptomatic areas less, ultimately decreasing the DI. Similarly, the shrinkage of the infected leaf might be also the reason for this trend of DI. An increment trend was observed from 3 DAI, and a similar pattern was recorded by GN. Agrios (2005) for bacterial wildfire in tobacco within a few days where the brown halos increased from 0.5 to 2 or 3 centimeters and large dead regions on the leaf occurred when the nearby spots consolidated.
Thus, we can say that the combination of RGB image, hyperspectral image, and DI provides a good insight into the detection of disease at an early growth stage. The HSI has been used for the early detection of the bacterial wildfire (Lay et al., 2023). These parameters were also used to determine the cultivars ranging from tolerance to sensitivity upon the inoculation of bacterial wildfire. The use of three VIs; NDVI, PRI, and ARI for determining the level of photosynthetic pigments and correlating these VIs with DI helps to find out the day at which the bacterial infection gets more intensified on the plant leaf. Based on the day with significant correlation, we were able to detect the disease at an early growth stage.
Conclusion
The current study provides an essential statistic to investigate and evaluate the effect of the bacterial wildfire response in soybean cultivars. The results demonstrated that Taekwang is the moderately sensitive cultivar among 16 cultivars based on the RGB image method. Thus, RGB visible analysis can identify the tolerance and sensitive cultivars in our experiment. This cultivar also showed a significant decrease in NDVI and an increase in PRI and ARI throughout the experimental period. Additionally, HSI has the potential as a non-destructive method to detect bacterial wildfire disease on soybean leaves at the early stage based on the vegetative indices; NDVI, PRI, and ARI. However, both PRI and ARI showed better results for the early detection of disease incidence compared to the NDVI. And, PRI revealed the best results that can be used for predicting the moderately sensitive cultivar (Taekwang) which is a cemetery pattern to the RGB results. A similar result of the correlation between DI and VIs showed that PRI had the highest correlation value at 6 DAI among all the VIs. Hence, the RGB method of DI measurement provides essential information for selecting the cultivars from susceptible to tolerant levels. Likewise, the use of VIs in correlation with the measured DI can provide important information regarding the early detection of the disease. As our experiment was conducted on a short interval; until 8 DAI further research focusing on the later stage is needed for more precise and accurate detection of disease along with the selection of susceptible and tolerant cultivars.
