Introduction
Previous studies
Empirical model and Data
Empirical model
Data Description
Results
Impact on processed food consumer price index
Impact of bread and snack on the consumer price index
Asymmetry test results: Wald test
Conclusion and Suggestions
Introduction
Recently, international grain prices have fluctuated significantly due to climate change, COVID-19, and wars between countries. Particularly, international grain prices, which had been on the rise since the second half of 2020, soared after the Russia-Ukraine war in 2022, especially for wheat and corn, which have a high proportion of exports from the Black Sea region (KIEP, 2023; Russia is the world’s largest exporter of wheat, accounting for 18% of the wheat circulated worldwide. Ukraine also plays a significant role in the global wheat market as the world’s fifth-largest wheat exporter). For instance, the CBOT futures prices of wheat, corn, and soybeans, which surged in March 2022, rose by 137.7%, 102.1%, and 72.0%, respectively, compared to the average prices in March of previous years (KREI, 2022). Subsequently, in July 2022, the major grain prices showed a temporary decline through the Black Sea Grain Initiative agreement. However, with Russia’s termination of the agreement in July 2023, international grain prices began to rise again (The New York Times, 2023; The New York Times reported that after Russia’s termination of the agreement, the price of wheat increased by 13% compared to the previous month. If this trend continues for a long period, it explained that the fluctuation in grain prices will have a serious impact on many countries). As such, fluctuations in international grain prices are causing a global food crisis, along with issues in the global value chain and the effects of supply chain disruptions.
In the case of Korea, it is vulnerable to a food crisis due to price changes, as it relies entirely on imports for grains other than rice (KOSTAT, 2022; As of 2020, Korea’s grain self-sufficiency rate is 20.2%. While the self-sufficiency rate for rice is over 90%, it relies almost entirely on imports for wheat (0.5%), corn (0.7%), and beans (7.5%)). For example, as of 2020, the self-sufficiency rate of grains in Korea is 20.2%. While rice has a self-sufficiency rate of over 90%, it relies almost entirely on imports for most grains, with wheat at 0.5%, corn at 0.7%, and legumes at 7.5% (KOSTAT, 2022). Moreover, Korea has a very high intake of processed foods due to rapid changes in dietary habits. This accounts for about 68.1% of the total food intake (KDCA, 2022; In Korea, the total food consumption was recorded as 31.9% (495 g) for raw food and 68.1% (1054.5 g) for processed food). In the case of processed foods, most of the raw materials depend on imported grains. Therefore, the impact of fluctuations in international grain prices can be transferred to the issue of consumer price burden (KREI, 2020). This suggests that in Korea, fluctuations in the price of imported grains are not just a problem confined to raw food materials. Therefore, examining the changes in the processed food price index due to fluctuations in international grain prices from the consumer’s perspective can be said to be an important task in exploring the direction of national economic development.
In this context, many studies have been conducted in Korea to respond to the food crisis, focusing on changes in world grain prices. These include studies on food security (Ahn and Han, 2012; Jeong, 2018; Karina and Kim, 2022; Yoon and Kim, 2020), an early warning system for international grain prices (Kim and Kim, 2016; Kim and Seung, 2009; KREI, 2014; Yoon et al., 2016), and fluctuations in the price of imported grains (Kim et al., 2020; Kim et al., 2011; Lee and Lee, 2014; KREI, 2022). These studies contain content about how to stably introduce major grains at the national level, predictions of grain prices, and the impact that fluctuations in the price of imported grains have on the national economy. Responding to crises due to fluctuations in world grain prices requires a lot of resources along with policy efforts. Therefore, it is necessary to measure the exact ripple effect and degree of impact of imported grain prices to design an efficient and effective response system (Kim et al., 2020). However, despite the possibility that fluctuations in the price of imported grains can be transferred to various food prices, the previous studies were conducted focusing on items such as raw food or primary processed food (flour, cooking oil, etc.) (Of course, some studies (Kim et al., 2011; KREI, 2011; Lee and Lee, 2014) have reviewed the impact of raw material price fluctuations on prices, but most of these studies have examined how grain prices affect the real economy when they rise. In other words, these previous studies assumed that the impact of variable fluctuations on the real economy, such as exports, imports, and prices, is symmetrical regardless of the direction of variable fluctuations. That is, according to their analysis, the price increase effect when raw material prices rise is the same as the price decrease effect when prices fall by the same level). In addition, many previous studies have been conducted from the perspective of items rather than consumers, and the impact on prices affecting the national economy has not been importantly dealt with (In a recent study by Kim et al. (2020), they have detailedly reviewed the fluctuation of grain prices from the perspective of consumer prices to supplement the limitations of these previous studies. In their research, they measured the consumer impact due to grain price fluctuations using the consumer price index and various macro indicators. However, they did not cover detailed information about the prices of processed foods, which have a high proportion of food consumption). Of course, some studies (Kim et al., 2020; Kim et al., 2011; Lee and Lee, 2014) have studied the impact of grain price fluctuations from the consumer price perspective, but they did not analyze in detail the impact on processed foods. In this study, we aim to detailly review the ripple effect of imported grain price fluctuations centered on processed food prices. In addition, in the detailed analysis, we plan to further analyze the prices of processed foods with high consumption, focusing on wheat with a high import proportion, in addition to the impact on processed foods of major imported grains. This is to examine the impact of grain prices more finely.
The impact of raw material price changes on the price of the final product can be calculated through the input-output model, which calculates the cost proportion of inputs. However, in reality, it is not easy for input price fluctuations to result in product price fluctuations due to companies’ pursuit of profits, the supply and demand environment of specific items, and market conditions (Kim et al., 2020). In particular, the impact of raw material price fluctuations on the final product price can have a certain amount of time lag, and above all, the trend of reflecting on the final price can vary depending on the pattern of raw material price changes (increase, decrease). In this study, we analyze the price transition phenomenon of major imported grains not through a simple input-output model, but through time series methodology.
On the other hand, one point to consider in price transition analysis is that positive and negative shocks can occur due to various macroeconomic variables, and the price of final goods can vary accordingly. Therefore, this study uses the NARDL (Nonlinear AutoRegressive Distributed Lag) model, which can derive the long and short-run ripple effects as one estimation formula, to measure the impact of imported grain price fluctuations on domestic processed food prices. The ARDL model assumes a symmetrical impact, and it reflects the shock in the long and short run, while the NARDL model has all the advantages of the ARDL model, and it can reduce the setting error arising from the asymmetry of the cointegration coefficient. In this study, we apply the NARDL to examine the impact of imported grain prices.
This study is structured as follows. In Chapter II, we review existing previous studies. In Chapter III, we discuss the research methodology and analysis data. In Chapter IV, we examine the results of the empirical analysis, and in Chapter V, we suggest the direction for future research along with implications based on the results.
Previous studies
Since entering the 2000s, the crisis in the world grain market has been recognized as a major variable bringing about changes in food prices. Particularly after the global financial crisis in 2008, many studies related to prices were conducted in the domestic agricultural sector as the price changes in the world grain market were noticed. Along with this, many research reports have been published that are concerned about the impact on the domestic market due to grain price changes caused by recently occurring events such as COVID-19 and the Russia-Ukraine war.
First, in the study by Kim et al. (2011), they examined whether changes in international grain prices lead to changes in processed food prices. In his study, cost analysis was used to look at the relationship between the price change trends of wheat, soybeans, and sugarcane and the price change trends of flour and edible oils. The analysis showed that the reflection of prices depending on the price changes of international raw agricultural products varies according to the trend of each item. The significance of this study lies in the detailed comparison of the prices of processed foods by item. However, this study has the limitation of restricting the analysis subjects mainly to primary processed products such as flour and edible oils, and it was not able to examine the detailed changes in prices by applying a time lag through cost analysis. In the study by Kim et al. (2011), they used price data from June 2010 to May 2011 to examine the ripple effect of food prices due to the rise in international agricultural product prices through industrial association analysis. As a result of the analysis, they predicted that the second half of the year prices would increase by 1~13% compared to the first half of the year due to the rise in agricultural product prices in the second half of the previous year. The significance of this study lies in predicting price changes through industrial association analysis. However, the industrial association analysis used in this study has the disadvantage that the results of the industrial association analysis can be distorted by the difference in the margin rate that can be applied even to the same goods or services depending on the demand sector. In the study by Lee and Lee (2014), they analyzed the ripple effect of the volatility of international grain prices on the volatility of domestic import grain prices, focusing on international major grains such as rice, corn, wheat, and soybeans. In their study, they estimated by dividing into the GARCH model (for soybeans and wheat) and the classical OLS model (for rice and corn) depending on the existence of uncertainty in domestic import grain prices. The analysis showed that rice was not influenced by other international grains, and corn was slightly influenced by international corn and was not influenced by other grain prices. Also, they suggested that the volatility of international prices has a significant impact on soybeans and wheat. The significance of his study lies in distinguishing the models according to the uncertainty of prices and examining the ripple effects on this. However, in terms of analysis methods, GARCH makes the square of the residual term influence long-run volatility. Therefore, the study has a limitation in that it only considers symmetrical effects regardless of whether the shock to conditional volatility is positive or negative. In the study by Kim et al. (2020), they examined the impact of changes in import grain prices on the consumer price index. In his study, they overcame the limitations of the study that only considered symmetrical changes mentioned above through NARDL analysis. Also, to enhance the robustness of the analysis, they applied various control variables (exchange rate, interest rate, crude oil price, wages, import prices excluding grains, etc.) to closely examine the impact on consumer prices due to changes in import grain prices. As a result of the analysis, it was proven that the price of imported grains only affects domestic consumer prices when it rises, and has no influence when it falls. Meanwhile, according to his study, they also performed additional analysis on livestock products, eating out, and processed foods, but did not perform item-by-item analysis on processed foods.
To summarize the key preceding studies, they have measured the impact of grain price changes from various perspectives through analyses such as industrial correlation analysis, VAR, GARCH, etc. However, a common point in these studies is that they only considered symmetrical changes in analyzing price changes. However, the impact that is transferred according to the rise and fall of prices can differ, so analysis studies that only consider symmetry have limitations in reflecting reality. On the other hand, the study by Kim et al. (2020) performed an analysis reflecting asymmetry considering these limitations. Although his research has significance in the point that it detailed the overall consumer price index, there was a limitation that it did not cover detailed contents about the price of processed foods with a high food intake proportion. Therefore, this study aims to analyze the long-run and short-run effects of imported grain price changes on the consumer price index of processed foods using the NARDL model, considering the limitations of existing studies. This is to detail the analysis of asymmetrical influences, breaking away from the symmetrical constraints that the preceding studies since the 2000s had. Also, unlike most studies that focused on primary processed foods, it intends to more closely examine the price transfer performance of the price index of processed foods with high consumption, centered on wheat, which has a large import volume.
Empirical model and Data
Empirical model
The fluctuations in the price of imported grains can not only affect the cost of raw materials but also the price of intermediate goods, which can in turn influence the price of final products. In particular, processed foods can be affected by various factors such as company wages, interest rates, and market environments in their pricing decisions (Kim et al., 2020). Therefore, to examine the impact of grain price fluctuations on final goods, various factors other than price must be considered in the analysis. Along with this, the change in grain prices can differ in the change of prices that can be transferred to the final product depending on the time of increase and decrease. Therefore, in price transmission analysis, it is necessary to consider that positive shocks and negative shocks due to various macroeconomic variables may be different.
Traditional time-series regression models assume that changes in explanatory variables have the same effect over time. This is being utilized in the ECM (Error Correction Model) and VECM (Vector Error Correction Model), ARDL, etc., proposed by Engle and Granger (1987). The ECM and VECM have significant advantages in solving the problem of spurious regression if there is a cointegration relationship in time-series data. However, these analysis methods assume a symmetric cointegration relationship, thus they have the limitation of not fully reflecting long-run asymmetry. Additionally, the ARDL (Autoregressive Distributed Lag) model has the advantage of being able to analyze long and short run relationships using data mixed with stable and unstable time series (Park and Bae, 2019). However, this also assumes that the dependent variable responds symmetrically to increases or decreases in the independent variable, thus limiting the examination of asymmetric impacts. In reality, when a shock occurs in the market, there is a high probability that the explaining variable for the dependent variable has an asymmetric relationship (Enders, 2014). Therefore, a methodology that can reflect asymmetry is needed in price transition analysis.
On the other hand, the NARDL proposed by Shin et al. (2014) can compensate for the drawbacks of several methodologies mentioned above. It allows for the analysis of dynamic long-run relationships and asymmetric impacts. And like the ARDL model, it has the advantage of being able to determine the cointegration relationship between variables regardless of the stationarity of the data. In this study, we examine the short and long run impact of changes in imported grain prices on domestic processed food prices through NARDL.
The description of the NARDL (The NARDL model is a methodology proposed by Shin et al. (2014), which is a combination of the methodologies of Schorderet (2001) and Pesaran et al. (2001)) model presented by Shin et al. (2014) starts from equation (1) representing the cointegration relationship.
In equation (1), represents the processed food price at period t, and and are vectors of variables that can influence imported grain prices and processed food prices. The important point here is that even though the main independent variable, the imported grain price, is correlated with other control variables, if it is not included, bias can occur due to the omitted variable (Park and Bae (2019) explained that control variables are needed for consistent estimation, but for the validity of the estimation results, it is better not to assume the asymmetry of the control variables). Therefore, in order to estimate a consistent , appropriate control variables must be included. In this context, this study applied macro data such as wages and interest rates as control variables, referring to the main preceding study, Kim et al. (2020). Meanwhile, in Equation (1) can be decomposed into through cumulative variation. If this is applied to Equation (1), it can be expressed as Equation (2). In Equation (2), is decomposed into the cumulative sum of the increasing part and the decreasing part, allowing for the asymmetry of the cointegration relationship at the increase and decrease points of (Schorderet, 2001). The and , which represent the cumulative changes at rising and falling points, follow the process of partial sum of positive (+) or negative (-) changes, as shown in the Equation (3).
The OLS estimation of the above Equation (2) is very consistent, but it cannot maintain the asymptotic distribution in non-Gaussian, so hypothesis testing that does not eliminate the serial correlation and endogeneity in regression analysis cannot be performed in the usual way. Considering these points, the NARDL(p, q) model of Pesaran et al. (2001) was applied to Equation (2) and presented as Equation (4).
Here, represents as a vector, is the parameter of autoregression, and and represent the parameters of the asymmetric distributed lag. The error term follows iid (independent and identically distributed). By combining the NARDL model with the Error Correction Model (ECM), it is possible to correct the weak endogeneity of unstable explanatory variables. Also, by selecting an appropriate lag, it becomes free from the residuals of serial correlation. Therefore, rearranging the NARDL model based on the Error Correction Model (ECM) by Pesaran et al. (2001) gives the following Equation (5).
In this study, based on the previously mentioned equations, the NARDL analysis model was set up as follows in Equation (6).
In Equation (6), 𝜌 represents the speed of error correction, and and are parameters that indicate the degree of long-run price transition at the time of price increase and decrease. Also, the long-run cointegration coefficients for this are calculated as , for the independent variables, and for the control variables. By the way, Shin et al. (2014) proposed an asymmetric cointegration test using Equation (4). There are two main methods: the t-test of Banerjee et al. (1998) and the f-test of Pesaran et al. (2001). The t-test of Banerjee et al. (1998) is used to test the null hypothesis and the alternative hypothesis . And the f-test of Pesaran et al. (2001) has as the null hypothesis. Also, it examines long-run symmetry constraints as and imposes short-run symmetry constraints as .
Data Description
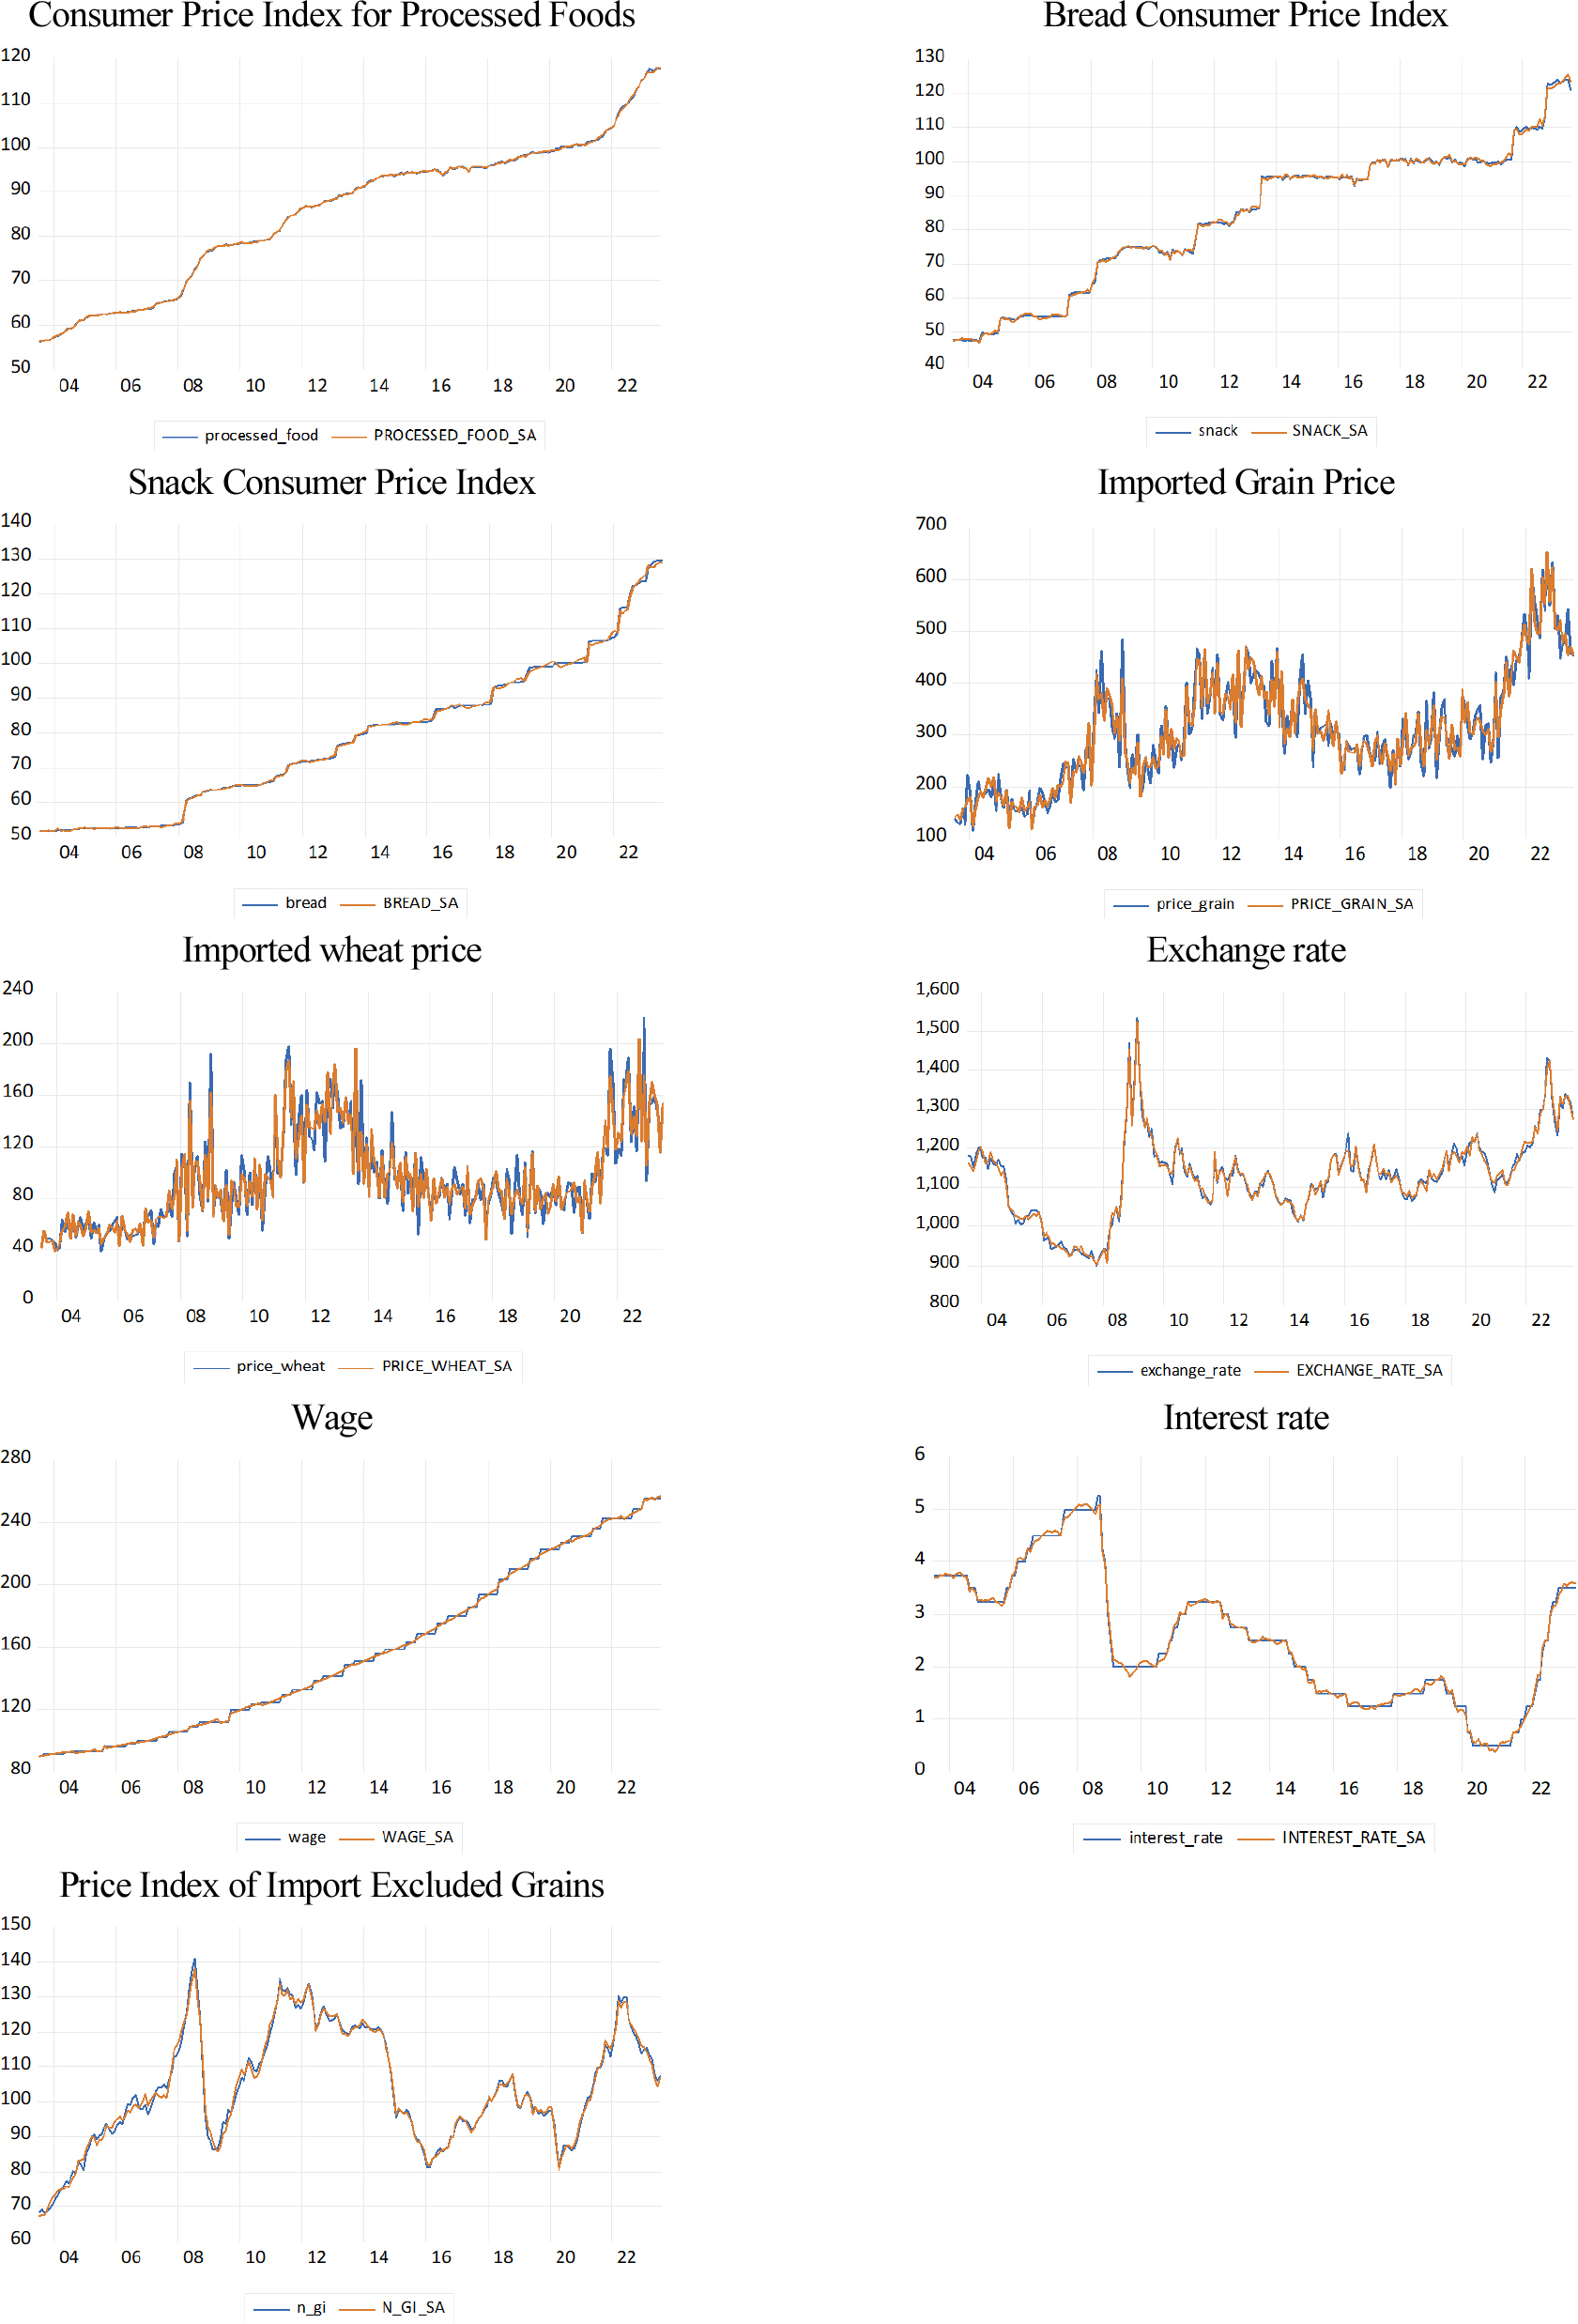
In this study, various macroeconomic data were used to understand the impact of changes in the price of imported grains on the price of processed foods in Korea. First, the dependent variable used to examine the consumer’s price burden for processed foods was the processed food consumer price index from KOSIS (Korean Statistical Information Service). Along with this, the price indices of bread and snacks, which have a high consumption among processed foods, were used as dependent variables to examine the price ripple effect of grains (wheat) (According to KCS data, the import volume of edible wheat in 2022 reached a record high of 2,578,646 tons. In terms of import amount alone, the item amounts to $1,150,024,000), which has a high import proportion in Korea (The consumption of bread and snacks in Korea has increased due to the increase in single-person households and changes in dietary life. According to a report by KB Financial Group, the daily per capita consumption of bread increased from 18.2 g in 2012 to 21.3 g in 2018, and snack consumption is also increasing by 1.2% each year (KB Financial Group, 2020 In this context, this study further examined the influence of grain prices on these items). In the analysis, the independent variables were composed of the price of imported grains and exchange rates, and control variables. The price of imported grains used the import price of grains announced by KCS (Korea Customs Service). In addition, control variables applied interest rates, wages, and import price indices excluding grains, along with exchange rates, as factors that could affect the price of processed foods other than imported grains (As discussed above, bias can occur due to omitted variables in the equation representing the cointegration relationship. Especially for processed foods, not only imported grains but also imported raw materials other than grains are used, so if analyzed only with the price of imported grains expressed in Korean won, it is easy to be affected by exchange rate effects. Therefore, in this study, the prices (indices) of imported raw materials including grains, represented in dollars, and exchange rates, wages, interest rates, etc., were used as control variables). Lastly, the period of the data used was the most recent 10 years, from July 2013 to July 2023, using monthly data. The following Table 1. represents the source of the data used in the research and basic statistics.
Table 1.
Data sources and basic statistics
| Variables | Source | Unit | Average | Std. Err. | Min. | Max, | ||
|
Dependent variable |
Consumer price index | Processed food | KOSIS | 2020 = 100 | 85.6 | 16.1 | 56.3 | 117.8 |
| Bread* | 78.4 | 21.1 | 51.9 | 129.6 | ||||
| Snack* | 84.0 | 20.4 | 47.5 | 124.0 | ||||
|
Independent variable |
Imported grain prices | Imported grain price | KCS | dollar/ton | 309.8 | 108.0 | 115.2 | 644.9 |
| Imported wheat price* | 94.7 | 37.5 | 38.3 | 220.0 | ||||
|
Macroeconomic variables | Exchange rate |
Bank of korea | won/dollar | 1125.5 | 105.3 | 900.7 | 1534.0 | |
| Wage | KOSCA |
One thousand won | 156.7 | 52.4 | 90.0 | 255.0 | ||
| Interest rate |
Bank of korea | % | 2.5 | 1.2 | 0.5 | 5.3 | ||
|
Import price index1) |
Import price index excluding grains |
Bank of korea | 2015 = 100 | 103.8 | 16.3 | 68.2 | 141.0 | |
Note: * represents the basic statistics of the variables used in the analysis of processed food items.
1)In the preceding study by Kim et al. (2020), they considered not only the import price index excluding grains but also the crude oil and livestock price indices in the import price index. However, in this study, a strong serial correlation was observed in these variables, and heteroscedasticity was noticed in the estimation. Therefore, these variables (crude oil, livestock prices) were not considered in the final analysis.
In time series analysis, data can be divided into stable time series with invariant probabilistic properties and unstable time series that do not. A stable time series follows a stochastic process with no systematic changes in mean, variance, etc., and no periodic changes. On the other hand, unlike stable time series, unstable time series have probabilistic trends. Therefore, as time passes, the irregular fluctuations in unstable time series increase. Hence, it is necessary to review the stability of the data in time series analysis. In this study, the stability of the data was examined through the ADF (Augmented Dickey Fuller) and PP (Phillips-Perron) tests. Specifically, all the data used for the test underwent seasonal adjustment and natural log transformation, followed by a unit root test (Before performing the unit root test, all variables used in the analysis underwent a seasonal adjustment using X-12 ARIMA. The changes in the variables due to the seasonal adjustment are presented in Appendix). As a result of the test, all variables used in the analysis were converted into stable time series at the first difference (Table 2).
Table 2.
Unit root test analysis
| Variables | ADF | PP | |||
|
Dependent variable |
Consumer price index | ln(Processed food) | Raw data | -1.34 | -1.23 |
| 1st difference | -8.45*** | -10.67*** | |||
| ln(Bread) | Raw data | 1.07 | 1.30 | ||
| 1st difference | -12.75*** | -12.72*** | |||
| ln(Snacks) | Raw data | -1.38 | -1.37 | ||
| 1st difference | -15.00*** | -15.00*** | |||
|
Independent variable |
Imported grain prices | ln(Imported grain price) | Raw data | -2.49 | -1.52 |
| 1st difference | -18.89*** | -12.09*** | |||
| ln(Imported wheat price) | Raw data | -1.60 | -1.46 | ||
| 1st difference | -12.85*** | -11,32*** | |||
|
Macroeconomic variables | ln(Exchange rate) | Raw data | -2.41 | -2.44 | |
| 1st difference | -16.35*** | -16.18*** | |||
| ln(Wage) | Raw data | 0.15 | 0.35 | ||
| 1st difference | -12.37*** | -18.76*** | |||
| ln(Interest rate) | Raw data | -2.14 | -1.72 | ||
| 1st difference | -4.81*** | -14.93*** | |||
|
Import price index | ln(Import price index excluding grains) | Raw data | -1.15 | -1.23 | |
| 1st difference | -8.87*** | -8.55*** | |||
When the orders of stable time series variables are mixed with I(1) and I(0), the use of the ARDL model ensures convenience, but statistical defects in the model can occur. Therefore, in this study, the stability of the data was reviewed through serial correlation and heteroscedasticity tests. And the appropriateness of the analysis method was examined through the RESET test (In this study, we first reviewed the stability of the data through ARDL analysis. Considering the use of monthly data, we allowed the maximum lag to be up to 12. Subsequently, the serial correlation was tested reflecting the maximum lag appeared in the estimation results through the LM test. These lags applied 7 for processed food (Model 1), and 4 for bread (Model 2) and snacks (Model 3). In addition, the heteroscedasticity test was conducted through the Breusch-Pagan-Godfrey). Firstly, as a result of testing for serial correlation and heteroscedasticity, all variables in all models (In this study, Model 1 examined the influence of changes in imported grain prices on the consumer price index of processed food, Model 2 examined the influence of changes in wheat import prices on the consumer price index of bread, and Model 3 examined the influence of changes in wheat import prices on the consumer price index of snacks) adopted the null hypothesis that there is no serial correlation and heteroscedasticity as the probability value for the f-value was higher than the F-statistic. Therefore, there was no serial correlation, and no heteroscedasticity was found. However, in the RESET test where the number of heated terms was set to 1, the probability value for the f-statistic of all models was lower than the F-statistic. This implies that there is asymmetry between the dependent and independent variables of the model, indicating a nonlinear relationship. Therefore, it can be confirmed that the NARDL analysis method is appropriate in this study (Table 3).
Table 3.
Lagrange multiplier (LM), heteroskedasticity, and RESET tests
| Model | LM | Heteroskedasticity | RESET test |
| Model 1 | 0.317(0.721) | 0.431(0.970) | 1.789(0.180) |
| Model 2 | 0.275(0.802) | 0.528(0.819) | 1.742(0.182) |
| Model 3 | 0.309(0.738) | 0.402(0.832) | 1.903(0.210) |
On the other hand, it is necessary to confirm the long-run stability of the model through the asymmetric cointegration test of the NARDL(p, q) model to be presented later. In this study, the Bounds test was conducted using the null hypothesis of the combination of level variables in the NARDL model, following the proposal of Shin et al. (2014). The F-statistics derived from the test and the critical values of bounds are as shown in Table 4. below.
Table 4.
Bounds test: nonlinear autoregressive distributed lag (NARDL)
Model 1 examined the impact of changes in imported grain prices on the consumer price index of processed foods, and Model 2 examined the impact of changes in wheat import prices on the consumer price index of bread. Model 3 examined the impact of changes in wheat import prices on the consumer price index of snacks. As a result of the Bounds test, the estimated optimal NARDL models all exceeded the upper bounds of the critical values, confirming that there is a significant relationship between the variables in each model (In interpreting the results, an f-value higher than the upper bounds signifies that the positive and negative values of the independent variable are jointly important in explaining the consumer price, which is the dependent variable. On the other hand, if it is lower than the lower bounds, it means that it is not important in explaining the model. If it falls between these values, it can be interpreted that the relationship has not been determined). If the threshold falls below the lower bounds, it becomes impossible to ensure the stability of the model.
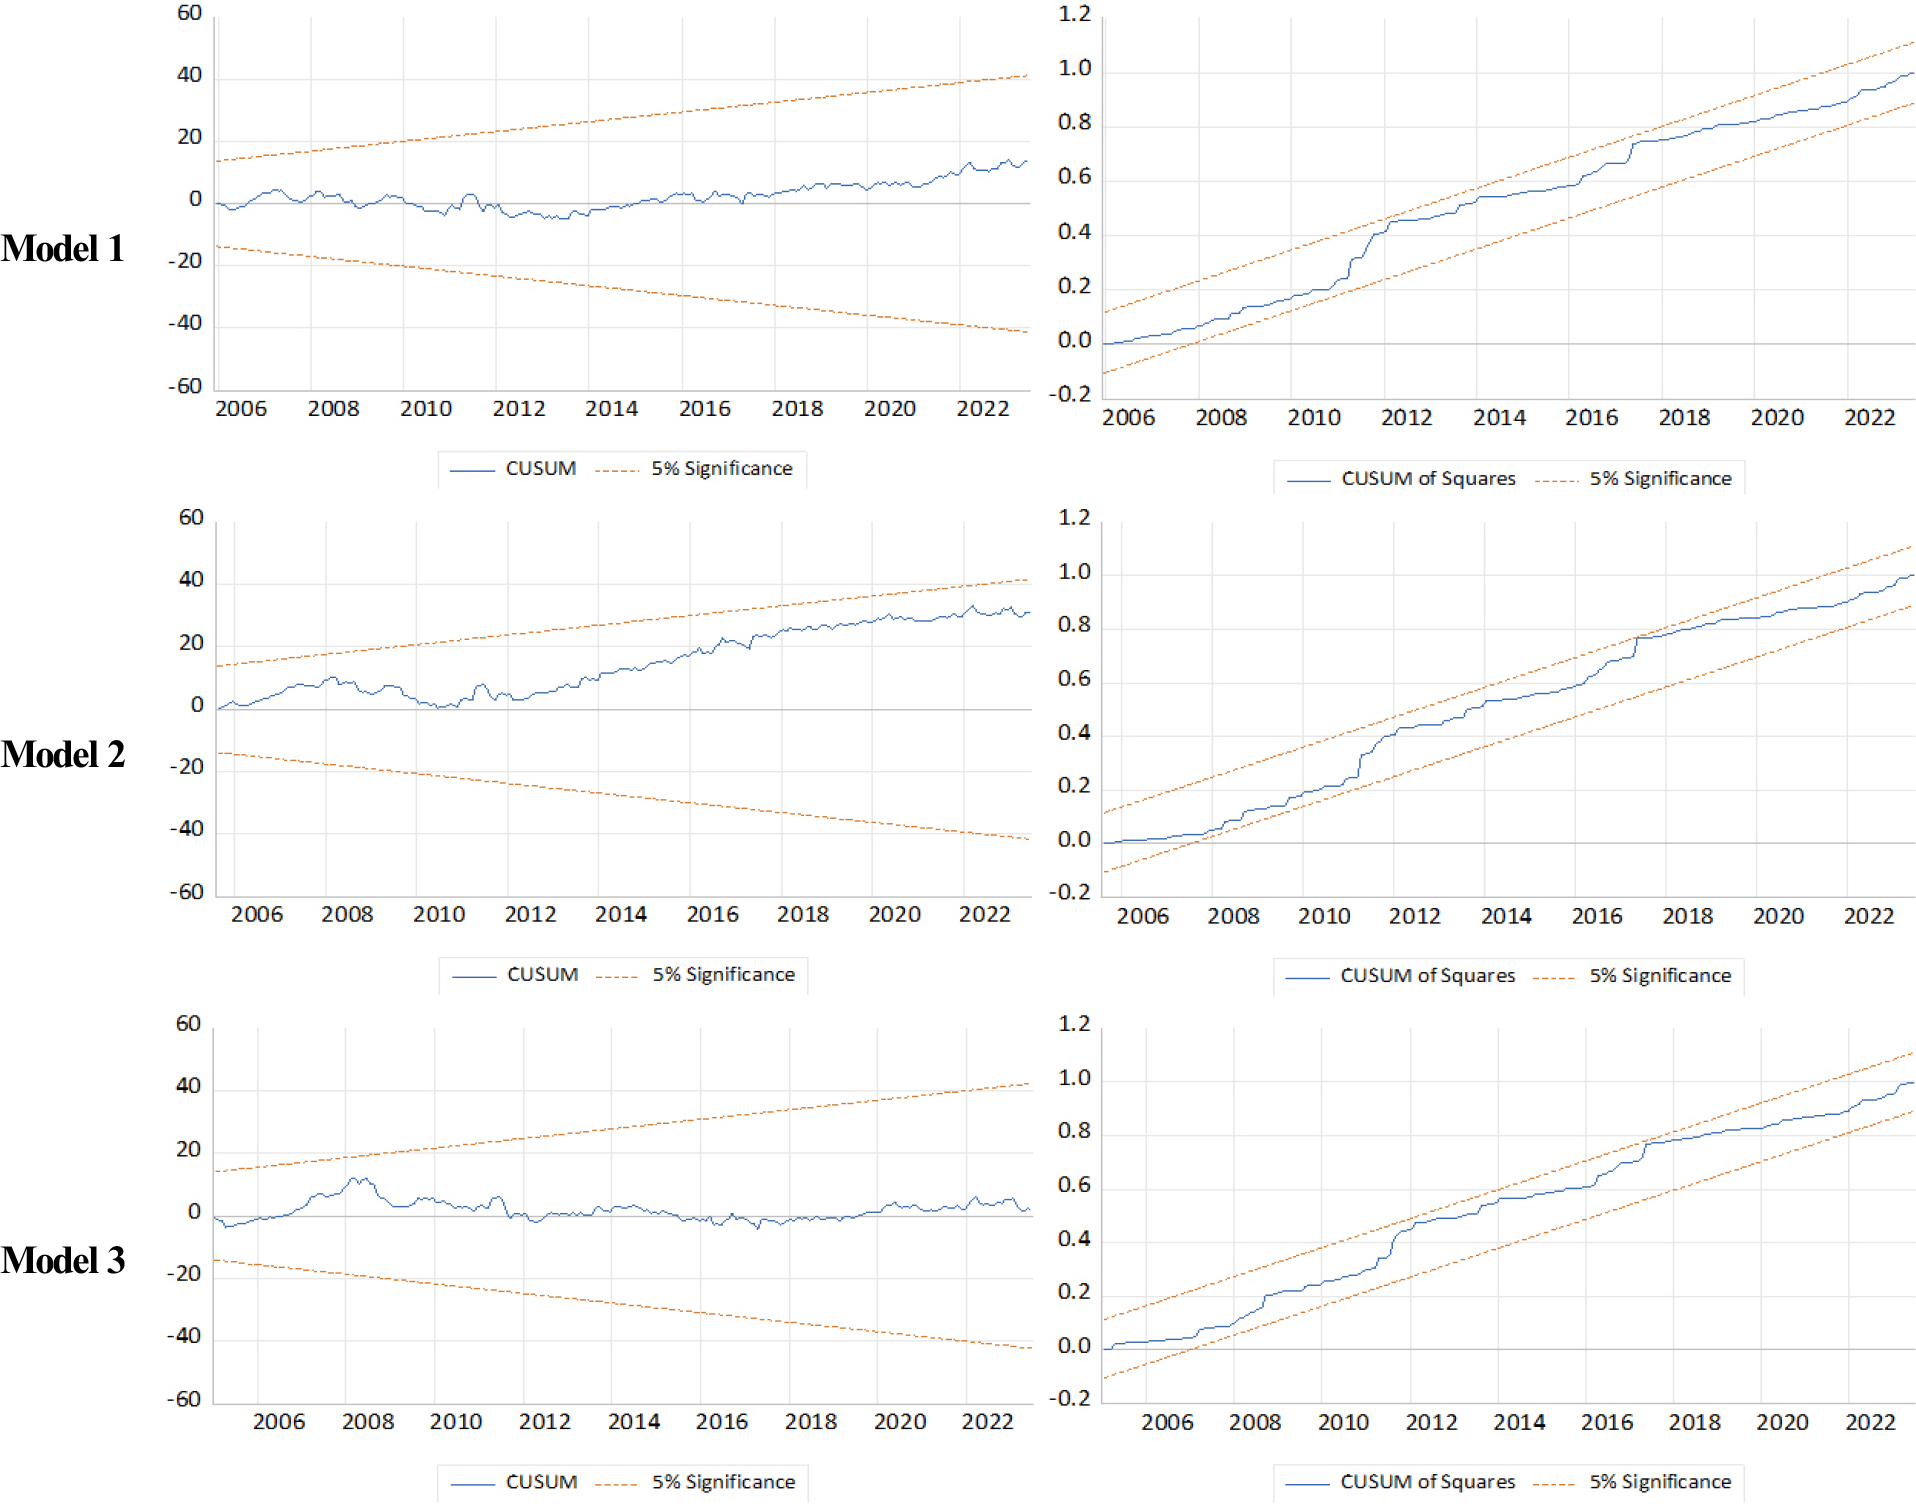
To verify the stability of the estimated coefficients of the NARDL(p,q) model, the CUSUM (cumulative sum) test and the CUSUM of squares test were conducted. The CUSUM test is used to verify whether the cumulative error term of the estimated NARDL(p,q) model is stable based on the 5% threshold. The divergence of the error term can be checked around the mean line of ‘zero’. The CUSUM of squares test is a graphical representation of the relationship between the 5% threshold line and the cumulative error term, based on the cumulative sum of the model’s residuals. If the cumulative sum moves outside the critical values, it indicates instability of the parameters or variance. According to (Fig. 1), both Model 1 and Model 2 are stably diverging without deviating from the 5% critical value of the CUSUM test error term. Also, as the CUSUM of squares resides within the critical line, the stability of the model has been ensured.
Results
Impact on processed food consumer price index
Tables 5 and 6 are the results of analyzing Model 1, which estimates the form in which fluctuations in imported grain prices are transferred to consumer prices of processed foods. The orders of p and q in the NARDL(p,q) equation were determined based on the AIC (Akaike Information Criterion). As a result, the optimal lag of Model 1 derived through this was adopted as NARDL(1, 5, 2, 6, 3, 1, 1, 1).
Table 5.
Impact of fluctuations in the prices of imported grains on the consumer price index of processed foods
| NARDL(1, 5, 2, 6, 3, 1, 1, 1) |
(Molel 1) Dependent variable △log(processed food consumer price index) | ||
| Independent variables | Time leg | ||
|
Long-run impact (Cointegration relationship) | log(Processed food consumer price index) | t-1 | -0.241*** (0.065) |
| log(Imported grain price)+ | t-1 | 0.022*** (0.003) | |
| log(Imported grain price)- | t-1 | 0.001 (0.003) | |
| log(Exchange Rate)+ | t-1 | 0.043** (0.021) | |
| log(Exchange Rate)- | t-1 | 0.015 (0.020) | |
| log(Wage) | t-1 | 0.013** (0.008) | |
| log(Interest rate) | t-1 | -0.003* (0.002) | |
| log (Import price index excluding grains) | t-1 | 0.031** (0.016) | |
|
Short-run impact (Time difference distribution port) | △log(Imported grain price)+ | t | 0.020 (0.025) |
| △log(Imported grain price)+ | t-1 | 0.021 (0.025) | |
| △log(Imported grain price)+ | t-2 | 0.019 (0.025) | |
| △log(Imported grain price)+ | t-3 | 0.020 (0.025) | |
| △log(Imported grain price)+ | t-4 | 0.027* (0.024) | |
| △log(Imported grain price)+ | t-5 | 0.038** (0.024) | |
| △log(Imported grain price)- | t | 0.015 (0.023) | |
| △log(Imported grain price)- | t-1 | 0.027 (0.023) | |
| △log(Imported grain price)- | t-2 | 0.018 (0.023) | |
| △log(Exchange Rate)+ | t | 0.035 (0.049) | |
| △log(Exchange Rate)+ | t-1 | 0.042 (0.049) | |
| △log(Exchange Rate)+ | t-2 | 0.047 (0.049) | |
| △log(Exchange Rate)+ | t-3 | 0.042 (0.048) | |
| △log(Exchange Rate)+ | t-4 | 0.045 (0.048) | |
| △log(Exchange Rate)+ | t-5 | 0.053* (0.047) | |
| △log(Exchange Rate)+ | t-6 | 0.061* (0.047) | |
| △log(Exchange Rate)- | t | 0.014 (0.102) | |
| △log(Exchange Rate)- | t-1 | 0.006 (0.102) | |
| △log(Exchange Rate)- | t-2 | 0.002 (0.102) | |
| △log(Exchange Rate)- | t-3 | -0.017 (0.101) | |
| Constant | 0.236* (0.205) | ||
| Adj. | 0.823 | F-Bounds Test | 4.61 |
| Log likelihood | 975.23 | DW test | 2.013 |
Table 6.
Impact of fluctuations in the prices of imported grains on the consumer prices of processed foods in the long run
| Variable | Coefficient | Variable | Coefficient |
| Imported grain price+ | 0.091*** | Imported grain price- | 0.004 |
| Exchange Rate+ | 0.178** | Exchange Rate- | 0.062 |
| Wage | 0.054** | Interest rate | -0.012* |
| Import price index excluding grains | 0.129*** | ||
As a result of the analysis, the estimated coefficient of the error correction term showed statistically significant results at the 1% significance level. Therefore, the analysis results show a convergence phenomenon towards a long-term equilibrium relationship. Next, when examining the long-run equilibrium relationship between the consumer price index for processed foods and the price of imported grains, it was found that the price of imported grains asymmetrically transferred to consumer prices for processed foods only when they increased. This suggests that a 1% increase in the price of imported grains leads to a 0.091% increase in the consumer price of processed foods. In addition, the exchange rate was also found to affect prices only when it increased, similar to the price of imported grains. The magnitude of this effect was such that a 1% increase in the exchange rate led to a 0.178% increase in the price of processed foods. This suggests that the exchange rate has a greater impact on the price of processed foods than the price of imported grains. This is a similar result to Kim et al. (2020), a previous study that examined overall consumer prices. He explained that this phenomenon is due to the fact that when the exchange rate rises, the price of imported grains expressed in Korean Won rises and the prices of other imported raw materials expressed in Korean Won rise, which has a significant effect. The short-run effect was also estimated to occur when both the price of imported grains and the exchange rate increased. As a result, the price of imported grains was estimated to be transferred after a lag of 4-5 months, and the exchange rate after a lag of 5-6 months.
On the other hand, the control variable, wages, showed a result of increasing (or decreasing) the consumer price index of processed foods by 0.054% when it increased (or decreased) by 1%. This can be interpreted as reflecting the impact of price increases due to increased production costs, as wages are a cost of the production factor, labor. Meanwhile, the interest rate showed statistically significant results with a negative (-) sign. This was manifested as a decrease (or increase) of 0.017% in consumer prices when it increased (or decreased) by 1%. This is also similar to the research results of Kim et al. (2020), a previous study. He explained that if the interest rate falls in terms of macroeconomics, the amount of money increased due to the increase in loans, and this increase in the amount of money could be the result of inflation. In addition, when the import price index excluding grains increased (or decreased) by 1%, it resulted in a 0.129% increase (or decrease) in the consumer price index of processed foods. This can be interpreted as a sensitive response to the price of processed foods, as various raw materials such as livestock and seafood are included in the price excluding imported grains.
Impact of bread and snack on the consumer price index
Next, we individually analyzed the price fluctuation effects on bread and snacks, which consume a large amount of wheat, which has a high import proportion among major grains. This detailed analysis can help understand more specifically the form of price transition through imported grains. Table 7 is the result of analyzing the form in which the price of imported wheat is transferred to individual processed food items, bread (Model 2) and snacks (Model 3). In addition, Table 8 is a table summarizing the long-run effects based on these results. In these analyses, the orders of p and q in the NARDL(p,q) equation were determined based on the Akaike Information Criterion (AIC). As a result, the optimal lags of Models 2 and 3 derived through this were adopted as NARDL(1, 6, 3, 6, 4, 1, 1, 1) and NARDL(1, 6, 4, 5, 3, 1, 1, 1), respectively.
Table 7.
Impact of the prices of bread and snacks on the consumer price index
|
Model 2: NARDL(1, 6, 3, 6, 4, 1, 1, 1) Model 3: NARDL(1, 6, 4, 5, 3, 1, 1, 1) |
(Model 2) Dependent variable △log(Bread Consumer Price Index) |
(Model 3) Dependent variable △log(Snack Consumer Price Index) | ||
| Independent variables | Time leg | |||
|
Long-run impact (Cointegration relationship) | log(Bread/Snack Consumer Price Index) | t-1 | -0.203*** (0.017) | -0.195*** (0.027) |
| log(Wheat import price)+ | t-1 | 0.019*** (0.001) | 0.015*** (0.001) | |
| log(Wheat import price)- | t-1 | 0.012 (0.050) | 0.007 (0.033) | |
| log(Exchange Rate)+ | t-1 | 0.027*** (0.002) | 0.021* (0.010) | |
| log(Exchange Rate)- | t-1 | 0.013 (0.035) | 0.003 (0.005) | |
| log(Wage) | t-1 | 0.010** (0.005) | 0.017*** (0.003) | |
| log(Interest rate) | t-1 | -0.005** (0.003) | -0.003** (0.001) | |
| log (Import price index excluding grains) | t-1 | 0.017* (0.014) | 0.031*** (0.005) | |
|
Short-run impact (Time difference distribution port) | △log(Wheat import price)+ | t | 0.009 (0.015) | 0.005 (0.010) |
| △log(Wheat import price)+ | t-1 | 0.012 (0.015) | 0.003 (0.010) | |
| △log(Wheat import price)+ | t-2 | 0.010 (0.015) | 0.007 (0.010) | |
| △log(Wheat import price)+ | t-3 | 0.012 (0.015) | 0.006 (0.010) | |
| △log(Wheat import price)+ | t-4 | 0.018* (0.015) | 0.011 (0.009) | |
| △log(Wheat import price)+ | t-5 | 0.022** (0.015) | 0.018* (0.009) | |
| △log(Wheat import price)+ | t-6 | 0.030** (0.015) | 0.023* (0.009) | |
| △log(Wheat import price)- | t | 0.011 (0.096) | 0.006 (0.081) | |
| △log(Wheat import price)- | t-1 | 0.012 (0.096) | 0.009 (0.081) | |
| △log(Wheat import price)- | t-2 | 0.021 (0.096) | 0.015 (0.081) | |
| △log(Wheat import price)- | t-3 | 0.022 (0.081) | ||
| △log(Exchange Rate)+ | t | 0.030 (0.036) | 0.013 (0.022) | |
| △log(Exchange Rate)+ | t-1 | 0.029 (0.036) | 0.018 (0.022) | |
| △log(Exchange Rate)+ | t-2 | 0.027 (0.036) | 0.030 (0.022) | |
| △log(Exchange Rate)+ | t-3 | 0.034 (0.036) | 0.027 (0.022) | |
| △log(Exchange Rate)+ | t-4 | 0.35 (0.036) | 0.031* (0.021) | |
| △log(Exchange Rate)+ | t-5 | 0.036* (0.035) | 0.039** (0.020) | |
| △log(Exchange Rate)+ | t-6 | 0.040* (0.035) | ||
| △log(Exchange Rate)- | t | 0.013 (0.049) | 0.010 (0.032) | |
| △log(Exchange Rate)- | t-1 | 0.015 (0.049) | 0.0019 (0.032) | |
| △log(Exchange Rate)- | t-2 | 0.032 (0.049) | 0.027 (0.032) | |
| △log(Exchange Rate)- | t-3 | 0.035 (0.049) | 0.025 (0.031) | |
| △log(Exchange Rate)- | t-4 | 0.029 (0.049) | ||
| Constant | 0.029 (0.051) | 0.042** (0.020) | ||
| Adj.R^2 | Model2 | 0.722 | Model3 | 0.795 |
| Log likelihood | Model2 | 1002.710 | Model3 | 989.245 |
| F-Bounds test | Model2 | 5.85 | Model3 | 6.03 |
| DW test | Model2 | 2.003 | Model3 | 1.996 |
Note: 1) *, **, and *** denote significance at the 10%, 5%, and 1% levels, respectively. 2) The F-Bounds Test refers to the F-statistic. In Model 2, the critical values for the 1% upper and lower bounds were calculated to be 2.41 and 3.61, respectively. In Model 3, the critical values for the 1% upper and lower bounds were calculated to be 2.56 and 3.72, respectively.
Looking at the long-run relationship between the consumer price index of bread and snacks and the price of wheat, the following was observed. First, the price of wheat showed a result of asymmetrically transferring to the consumer price of bread and snacks only when it increased. This was manifested as an increase of 0.094% in bread and 0.077% in snacks consumer prices when the price of wheat increased by 1%. The exchange rate was also found to affect each processed food price only when it increased. As a result, a 1% increase in the exchange rate resulted in a 0.133% increase in bread and a 0.108% increase in snacks processed food prices. This means that the price transition effect of wheat price is greater on bread than on snacks. This can be interpreted as a result of bread using wheat as the main ingredient, whereas snacks have a high proportion of other ingredients, showing a difference. The short-run effects also estimated that both wheat and exchange rates affect the price of bread or snacks only when they increase. Firstly, for bread, the price of wheat was transferred after a lag of 4-6 months, and the exchange rate after a lag of 5-6 months. Also, for snacks, the price of wheat was transferred after a lag of 5-6 months, and the exchange rate after a lag of 4-6 months. Thus, like major imported grains, the price of wheat also reflected consumer prices within half a year.
The control variable, wages, resulted in a 0.049% increase (or decrease) in the consumer price of bread and a 0.087% increase (or decrease) in the consumer price of snacks when it increased (or decreased) by 1%. In addition, the interest rate showed a price transition result opposite to the rising phase with a negative (-) sign for both. This resulted in a 0.025% decrease (or increase) in the consumer price of bread and a 0.015% decrease (or increase) in the consumer price of snacks when the interest rate increased (or decreased) by 1%. Finally, when the import price index excluding grains increased (or decreased) by 1%, it resulted in an increase in the consumer price index of bread and snacks by 0.129%. Unlike the price transition of wheat mentioned earlier, it was found that snacks had a greater impact on price transition than bread. This suggests that price determination can vary depending on the characteristics of the product (content of raw materials) in the price transition of processed grain products.
Asymmetry test results: Wald test
As previously mentioned, it is necessary to confirm the existence of symmetry in the long-term effects of each variable affecting the consumer price index of processed food through an asymmetry test for the positive (+) long-term estimates and negative (-) long-term estimates. For this, the research divided the asymmetry test into two parts for analysis. First, the null hypothesis (:) that there is no cointegration for equation (6) was tested, and then the existence of asymmetry in the long-term estimates of Table 6. and Table 8. was tested. The results of the test for the existence of asymmetry are as shown in Table 9.
Table 8.
Impact of fluctuations in the price of imported wheat on consumer prices of bread and snacks in the long run
| Variable | Model 2 Coefficient | Model 3 Coefficient |
| Wheat import price+ | 0.094*** | 0.077*** |
| Wheat import price- | 0.059 | 0.036 |
| Exchange Rate+ | 0.133*** | 0.108* |
| Exchange Rate- | 0.064 | 0.015 |
| Wage | 0.049** | 0.087*** |
| Interest rate | -0.025** | -0.015** |
| Import price index excluding grains | 0.084* | 0.159*** |
Table 9.
Asymmetry test results: Wald test
| Model | Ho:: | Ho: | |
| Model 1 | Imported grain price | 16.332*** | 12.140*** |
| Exchange rate | 8.682** | 20.012*** | |
| Model 2 | Imported wheat price | 17.405*** | 15.325*** |
| Exchange rate | 9.515** | 21.273*** | |
| Model 3 | Imported wheat price | 10.325** | 13.201*** |
| Exchange rate | 8.714** | 19.358*** | |
As a result of testing the null hypothesis that there is no asymmetric cointegration, all variables exceeded the 1% upper critical value of the F-test by Pesaran et al. (2001), rejecting the null hypothesis. Also, in the null hypothesis that the positive (+) long-run estimates and negative (-) long-run estimates are the same, it was shown to exceed the standard of 1% critical value, rejecting it. This means that there is a long-run asymmetric relationship between the imported grain prices and exchange rates on processed food prices.
Conclusion and Suggestions
The price of processed food directly and indirectly affects the dietary habits of the people, and is one of the important indicators determining the standard of living and economic safety of consumers. Therefore, food price fluctuations are considered a sensitive indicator of economic environment and living standards. As one of the countries importing various foods and food resources from the global market, it is important to deeply understand the influence of changes in the international grain market on Korea’s processed food industry and household consumers. In particular, the price fluctuation of wheat, a major imported grain, is one of the key variables in analyzing the impact on Korea’s processed food market. In this context, this study analyzed the impact of price fluctuations of major imported grains on Korea’s processed food prices, and reviewed whether this impact reflects asymmetry. In addition, to more specifically understand the price transition form through imported grains, we analyzed the price transition impact of bread and snacks, which have high consumption of processed food, focusing on wheat with a high import ratio.
The main results of the study are as follows. As a result of analyzing the long-run impact on the consumer price index of processed food, it was found that when the price of imported grain increases by 1%, the consumer price of processed food increases by 0.091%. And when the exchange rate increases by 1%, the processed food price increases by 0.178%. The short-run effect was also estimated to appear when both the imported grain price and the exchange rate rise. The price of imported grains was estimated to transition with a lag of 4-5 months, and the exchange rate was estimated to transition with a lag of 5-6 months. As a result of analyzing the effect of wheat price on the consumer prices of bread and snacks, they also showed asymmetric transition effects only when they rise. This was shown as the consumer price of bread increasing by 0.094% and snacks by 0.077% when the price of wheat increased by 1%. The exchange rate was also analyzed to affect the prices of bread and snacks only when it rises. As a result, it was shown that when the exchange rate rises by 1%, the processed food prices of bread increase by 0.133% and snacks by 0.108%. As such, the main results of the study showed that when the price of the main raw materials for processed food rises, it leads to consumer price burden and does not apply in the opposite case, showing asymmetry. The main results of this study showed similar results in both the consumer price index of processed food and the consumer price index of bread and snacks, ensuring the consistency of the results.
The suggestions of this study are as follows. First, a sophisticated policy alternative from the government is required to respond to supply chain shocks. The Korean government has established the ‘Basic Plan for Wheat Industry Development’ in 2020 as a way to stabilize domestic prices. Moreover, it recently proposed a goal to raise the wheat self-sufficiency rate to 7% by 2027. However, despite these goals and basic plans, the detailed implementation plans and achievements are poor. Furthermore, no clear measures have been proposed to improve the self-sufficiency rate of major grains, which have a high import share other than wheat. In other words, while our country has proposed a direction for agricultural policies to increase the grain self-sufficiency rate, there is a lack of substantial countermeasures to respond to supply chain shocks. If a significant global supply chain shock occurs, it will be transferred to the prices of food, which is the main food for the people, and the damage will have to be borne by the people. Therefore, the government needs to establish a substantial response system to equip a stable supply chain system along with detailed plans to increase the self-sufficiency rate. For example, the government needs to consider establishing mid-to-long-term strategies for expanding the supply chain base through agreements with major grain importing countries, and building an international grain procurement system and detailed implementation plans. Second, there is a need to consider food response measures for vulnerable groups who consume a high proportion of processed foods through agreements between the government and the private sector. According to a research report by KHIDI (2018), vulnerable groups among Seoul citizens were reported to have a high consumption rate of processed foods among many foods, and among them, children showed a very high proportion of processed food consumption, at about 81% . On the other hand, in the empirical analysis of this study, the results showed that the crisis in the world grain market was transferred to the price of processed foods. In this context, the government and food manufacturers should consider measures to provide safe food for vulnerable groups and to stabilize the price of processed foods, which have a high consumption rate. For example, the government can provide separate discounted products to vulnerable groups through agreements with processed food manufacturers that aim for social value, and certify products as social enterprises for long-term implementing companies, which can be a good alternative. Third, there is a need to build a robust agricultural food demand-supply market in the medium to long term. The study showed that the price of processed foods changes due to various macroeconomic factors such as exchange rates, wages, and interest rates, in addition to the price of imported grains. This suggests that the price of processed foods in our country easily responds to external shocks other than raw materials. Therefore, the government needs to establish measures to secure a robust agricultural food market ecosystem, considering the characteristics of various macroeconomic variables, in addition to changes in the price of imported grain.
The limitations of this study are as follows. In the study, various macroeconomic data were used to examine the impact of fluctuations in the price of imported grains on domestic processed food prices. However, no separate economic model associated with this was applied. Therefore, this study has a limitation in that it was analyzed based on the major variables applied in previous studies. In addition, although the study identified that the price of imported grains causes an asymmetric price transition phenomenon in the price of processed foods, it could not clarify what causes this asymmetric price transition. Lastly, while this study examined the price transition of processed foods with high consumption, focusing on wheat with a high import ratio, it did not conduct a detailed analysis of other grains and processed foods. These limitations need to be advanced through continuous research. Nonetheless, the results of this study are significant in that they provide a detailed analysis of the impact on consumer prices of processed foods through various time-series price data. It is also hoped that the results of the analysis can be used as basic data to prepare measures to respond to the crisis in the global grain market.