

Introduction
Materials and methods
Study site selection and background
Sampling
Setting up and analyzing test items
QA/QC
Identification of spatio-temporal variabilities in tap water properties and influencing factors
Recommendations for differentiated water management for coastal industries
Results and Discussion
Safety of industrial water in coastal islands
Metals trends and influencers
Analysis of DBPs trends and influencers
Recommendations for differentiated water management for coastal industries
Conclusions
Introduction
The Korean Peninsula is surrounded by the sea on three sides, and the coast of the metropolitan area, especially on the west coast, consists of a number of coastal islands (Kong and David, 1993). In addition to the traditional fishing activities of the long-standing settled population, these coastal islands can also develop marine fisheries-related industries, including fisheries, fishery processing industries, and marine tourism (according to the Framework Act on Marine Fishery Development, the marine fisheries industry includes fishing, fisheries, fishery processing industries, and tourism). Owing to this possibility, coastal islands experience a unique regional development process, whereby access to the mainland is secured through the construction of social and indirect capital such as bridges and underground water pipelines, and the necessary foundation for industrial development is secured (Chang and Kyung, 2001; Lee and Kim, 2020). In terms of fishing, fisheries, and fishery processing industries, this can accelerate the development of these industries as key location conditions such as access to and stability of raw materials, efficiency of logistics and distribution, and stability of industrial water (water supply) are met (Oh, 1975). Meanwhile, the marine tourism industry with high value-added characteristics is often fostered by local government policy efforts, and the food and beverage service industry inevitably develop in the development process as a tourist destination (Lee and Kim, 2020). Consequently, the coastal islands have spatial characteristics that allow the development of primary (fishing and fisheries), secondary (fishery processing industries), and tertiary (food and beverage service) industries in relation to food. Recently, the government has promoted the sixth industrialization by promoting the convergence of various industries in these coastal islands, which is considered to be beneficial for the balanced development of the region as it can have a virtuous cycle effect on the underdeveloped coastal island economy (Park, 2021; Youk et al., 2023).
Early construction of water supply networks is crucial for sustainable industrial growth in coastal islands, especially for several types of industrial water, characterized by the absence of biological, physical, and chemical hazards along with a stable supply. On the contrary, when the development of marine and fishery-related industries accelerates faster than expected in the coastal islands, the resulting surge in tap water usage can lead to a decrease in flow rate and hydraulic pressure, resulting in problems such as water outages. To overcome these problems, drain field and pressurizing facilities are constructed in the coastal islands to ensure adequate supply pressure and re-chlorination to maintain the bacteriostatic effect until the outlet (Kim et al., 2010). These efforts at the water administration level can ensure the safety of industrial water and the reliability of supply to industries in remote coastal islands. The first objective of this study is to monitor the end-of-pipe tap water in these coastal islands over a long period of time, covering the history of industrial development in the region, to determine whether the water remains safe for industrial use.
Conversely, tap water is produced inland and supplied to coastal islands through wide-area water supply networks, which inevitably lengthens the drinking water distribution systems reaching coastal areas (Kim et al., 2010; Ko et al., 2011). The fact that tap water produced from inland water treatment plants can change its behavior to some extent when it reaches the coastal area (i.e., the end of the drainage pipe), where there is nowhere else to go, is already well documented internationally by those producing and supplying tap water or conducting related research (Zhang et al., 2022), but may be less familiar to industrial actors that use it as a raw material. In terms of safety as a raw water source and reliability of supply for the fisheries and food industries in coastal islands, tap water is unrivaled; however, because of the long-distance water supply and the end-of-pipe effect, both organic and inorganic substances from drinking water sources can accumulate and be detected in trace amounts within safe ranges (González et al., 2013; Hori et al., 2024; Zhang et al., 2022). There are also scientific methods to address this phenomenon (Barbeau et al., 2005).
Looking at this phenomenon in the context of industrial water management in the marine fisheries, tourism, and food and beverage service industries in the coastal islands, the following hypotheses can be suggested. In general, residual chlorination, disinfectant by-products (DBPs), and residual trace substances in tap water may be one of the factors affecting consumer organoleptic perception, even if the water itself is proven to be safe for human consumption as required by the relevant legislation (MFDS, 2024a, 2024b). This is not a tap water supply issue, but rather a result of the unique process characteristics of the fisheries and food industries, where raw water is highly concentrated or pretreated (Kim et al., 2021; Wujie et al., 2011). From this fact, it can be concluded that even if the plants (business establishment) from the same company or the same brand that use tap water as raw water are located in the coastal islands, may exhibit organoleptic differences in their products, if there is a slight difference in the properties of the raw water that reaches the process, particularly those located at the end-of-pipe and the plants in the inland area. The fisheries and food industries have evolved in response to consumer demand, and in addition to the desire for quality and safety in the past, maintaining a certain organoleptic quality of products regardless of time and space is also a factor in consumer satisfaction (Kim and Ahn, 2012; Oliver, 2014). Basically, the food and beverage service industry and the manufacturing industry in Korea have set up and operated a water supply and drainage system management plan such as raw water filtration in their manufacturing management guidelines to exclude the peculiar odor of tap water; however, if a clear difference is observed in the properties of water between inland and coastal islands, as mentioned above, the management cycle of the water supply and drainage system or water filtration system may need to be differentiated from that of inland plants. If geographical differences in tap water properties can be shown as the distance of the water supply chain increases (or as it moves closer to the end-of-pipe in the coastal area), or if spatial and temporal variations in properties and the factors that cause such variations can be identified, it may suggest the need for differentiated and detailed raw water management strategies in coastal fisheries and food industries, which may help to ensure uniformity of product quality. This is the second goal of this research.
As the drinking water industry and the food industry - as a fishery or tourism resource - are two separate industries, convergence studies between them have been rare. In this study, we first analyzed the tap water at the end of pipes in two coastal islands, which are located far away from inland water purification plants and sequentially increasing in distance over the last five years to investigate the safety of tap water as industrial water for the local marine fishery industry in the coastal islands. Second, based on the results of the analysis, we analyzed the spatio-temporal variability of tap water in the wide-area water supply network by re-selecting four metals and three DBPs that are important in the management of the tap water at the end of pipes as indicators. Third, this study attempts to identify the influencing factors that cause these spatio-temporal variabilities, and finally, to make recommendations for water management in the marine and fisheries industry, especially in the fisheries, fishery processing industries, and food and beverage service industry in the coastal islands. This study can be used as an indicator for water management guidelines for more precise quality control in terms of the industry sector, which is in line with the recently accelerated policy of fostering island regions (Youk et al., 2023; Hur et al., 2022). On the contrary, even apart from this convergence, the analysis of spatio-temporal variabilities in public water supply can be of sufficient academic value if we consider previous international studies (Kamboj et al., 2024; Scanlon et al., 2022).
Materials and methods
Study site selection and background
Seonjae Island and Yeongheung Island were selected as research targets because they are the coastal islands of a large city with a coastal area and a developed fishing industry. Although they are administratively part of Incheon Metropolitan City, they are not geographically close to the metropolitan city; hence, their tap water is supplied by the S Water Treatment Plant in the Gyeonggi Region, which is about 60 kilometers away in a straight line. Yeongheung Island (3 points) and Seonjae Island (2 points) are connected to Daebu Island via a bridge, and Daebu Island is connected to the inland areas via a seawall road (Fig. 1). Of these, as Yeongheung Island is the westernmost and faces the outer sea, Yeongheung Island and Seonjae Island are lined up in a row (Fig. 1, Table 1). Therefore, this study analyzes the water quality of Yeongheung and Seonjae Islands, and compares and analyzes the publicly available water quality data of S Water Treatment Plant, which supplies tap water to these areas at the same time, to understand the changes in water quality as the distance to the coastal area increases.
Since the start of tap water supply to the entire coastal islands (in 2007), administrative efforts have led to the development of marine and fisheries industries, such as tourism and food and beverage services, resulting in a surge in the floating population. In particular, as of 2001, following the construction of the Yeongheung Bridge, the number of tourists significantly exceeded the annual resident population, with more than 1000 tourists on weekdays and 10,000 tourists on weekends compared to about 2,000 residents. This influx resulted in a surge in tap water usage, especially during the tourist season (summer) leading to water outages because of reduced tap water flow. In response, the construction of the drain field (in 2017) and pressurizing facilities (in 2020 and 2024) was completed to maintain adequate flow rates even during the summer months when the population surges, along with re-chlorination to stabilize the water supply.
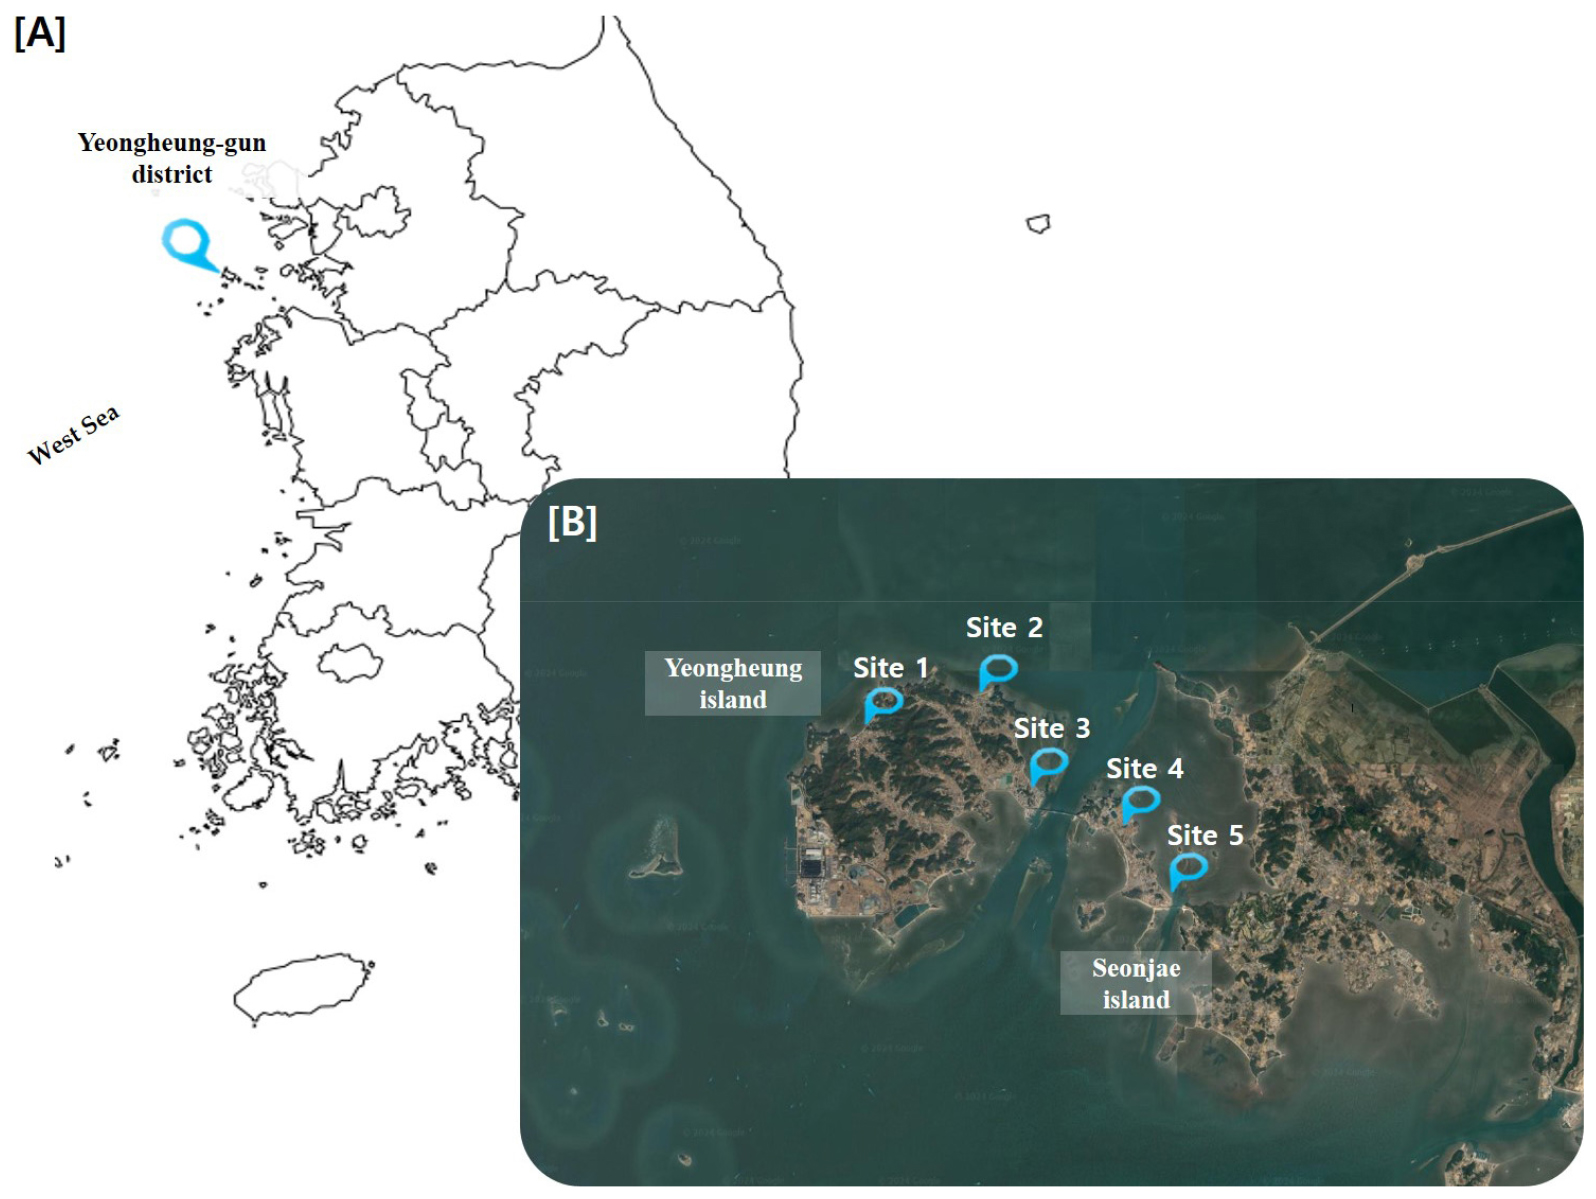
Fig. 1
Aerial view of the study area and sampling sites. [A] Overview of the west coast region of Korea, showing the geographical location of Yeongheung and Seonjae Islands where sampling sites are located. [B] Close-up aerial view of Yeongheung and Seonjae Islands. Sampling sites are marked with blue dots. Aerial images were obtained from Google Earth (version 7.3.3) and modified for this study. The viewing altitude for [B] is approximately 30.64 km.
Table 1
Sampling site descriptions
Sampling
The sampling was regularly conducted in the first quarter (first week of February), second quarter (first week of May), third quarter (first week of August), and fourth quarter (first week of November) of each year for five years. The sampling was carried out in accordance with the drinking water quality process test standard (NIER, 2024) by complying with the sample handling, pretreatment, transportation, storage, and collection containers prescribed for each test item (NIER, 2024). Given that chlorine inputs can change frequently during the tap water production process, and to mitigate the risk of sampling discrepancies due to extended sampling durations, all 5 sampling points were sampled within a short timeframe of 3 hours using a vehicle to transport the samples promptly to the laboratory.
Setting up and analyzing test items
The Food Sanitation Act stipulates that most of the raw water used in the manufacturing and processing of fishery products, excluding seafood and simple processed fishery products, as well as in food and beverage service industries and food safety management certified enterprises (30) among them, must be maintained at or below the statutory standards for a total of 60 items, irrespective of their inclusion in the final products they produce (MFDS, 2024a, 2024b). The 60 items also include a number of indicator substances of environmental contamination incidents (e.g., hazardous heavy metals and pesticides), which are neither relevant to the purpose of this study nor to a typical wide-area water supply and drainage system study. Therefore, we selected 24 items (9 aesthetics, 7 disinfectants and DBPs, 4 microorganisms, and 4 health hazards) (Table 2) that are likely to be commonly detected in drinking water, to investigate their safety and spatiotemporal variability to the outermost point of the coastal islands.
Tap water contains residual chlorine to inhibit biological hazards up to the final point of supply (demand) and is required by the Water Supply and Waterworks Installation Act (MOE, 2023, 2024) to be maintained at 0.1 mg/L or higher to have a bacteriostatic effect that inhibits microbial activation and regrowth. In addition, the effectiveness of residual chlorine at 0.1 mg/L or higher up to the furthest end of the tap supply can be verified by indicator microbiology testing. The injected chlorine combines with trace organic matter in the tap water supply to inevitably produce disinfectant by-products (DBPs) (Srivastav et al., 2020). Among the international reports, trihalomethanes (THMs) have been reported to increase in detection as the contact time between chlorine and organics increases with increasing tap water supply distance, and haloacetic acids (HAAs) have been reported to increase with no apparent increase (Chang et al., 2010).
Therefore, in this study, we prioritized some DBPs, including THMs, as test items to understand the changes in tap water properties according to the geographical distance between the water purification plant and the coastal islands located on the west coast of the Korean Peninsula. In addition to the substances produced by these chemical reactions, metals are stable inorganic substances that can increase in trace amounts as the distance of the tap water supply increases around the end of the pipes within a safe range (González et al., 2013). The statutory quantitative limits and reference values for the test analytes are presented in Table 2 according to the relevant regulations (NIER, 2024). The following QA/QC criteria were satisfied to ensure the quality of the test results.
QA/QC
Research related to environmental pollution or water quality has been gradually increasing in interest and importance because of climate change, and consequently, the accuracy and validity of measurement data and test methods have become more important; hence, this study applied a quality management system that complies with KS Q ISO/IEC 17025 in the entire process from sampling to results (ISO, 2017; Park et al., 2024). Certified reference materials were used for quantitative analysis of the selected test analytes, and the intercept and slope of the regression curve were derived based on the concentration value (mg/L) and the measured area value (area) of the certified reference materials to create a test curve, and the method blank sample and the sample were analyzed if the coefficient of determination (R2) met 0.98 or higher. The samples were measured by automatically measuring the samples in triplicate, and each of the area values obtained by fitting each to the calibration curve derived as described above, and the resulting concentration values were averaged to obtain the final concentration (mg/L). The management of analytical instruments ensured that statutory accuracy, precision, method detection limits, and quantitation limits were met. In the qualitative analysis (total coliforms, E. coli, and fecal coliforms), negative and positive control strains distributed from biological resource banks were used to ensure the reliability of the results. Additionally, for the field quantitative test item (residual chlorine), the additional technical requirements for field tests (KATS, 2021) were fulfilled.
Identification of spatio-temporal variabilities in tap water properties and influencing factors
Based on the inspection results of metals and DBPs, seven items that can be indicators were selected from the analysis results of the above 24 items to derive the change trend of these items according to spatio-temporal factors. As these indicators should be comparable across detections, the following metals were selected as commonly detected in the drinking water industry over time and space: zinc, aluminum, iron, and copper for metals and THMs, chloroform, and chloral hydrate for DBPs (Table 2).
To analyze comparisons based on temporal factors, we conducted annual and seasonal comparisons. Additionally, the data on the properties of tap water from Seonjae Island and Yeongheung Island, and the S Water Purification Plant were compared to identify changes in the properties as the supply distance increases in relation to geographic factors.
Table 2
Classification system and analytical items for drinking water quality standards
Recommendations for differentiated water management for coastal industries
If there are differences in the properties of tap water as a raw water source for inland and coastal operations, the industry’s own guidelines for water supply and distribution systems and process operations should also be differentiated, and it may be necessary for the industry to conduct its own research to establish specific guidelines. The factors identified in this study may help this process. Furthermore, this study examined the unique characteristics of the fisheries and food industries in coastal areas (fisheries, simple fishery-product processing industry, food manufacturing and processing, and food and beverage service industries) (Youk et al., 2023; Hur et al., 2022), including the legal framework and process characteristics applied to each industry, and specifically considering how differences in water properties can affect their water supply and distribution systems and processes, providing specific directions for setting their own guidelines. To this end, it was organized in the form of a checklist as in previous studies (Park et al., 2019, 2020c) to ensure it could be used in addition to each of the major items in each industry’s own guidelines. Furthermore, it was conducted by researchers with experience in developing checklists for the establishment, revision, and implementation of guidelines related to safety and quality in the food industry (Park et al., 2020c). Specifically, we borrowed the high-level structure of global standards related to food safety and quality (BRC, CFA) to establish the checklist’s major items and describe the necessary parts for each major item (AIB International, 2014; BRC, 2011; Park et al., 2020a). This is because the fishery or food industry also borrows from the major items of these global standards and describes compendious details in their own guidelines.
Results and Discussion
Safety of industrial water in coastal islands
As a result of testing 24 items of drinking water quality standards in the coastal islands, Seonjae Island and Yeongheung Island in the period from 2020 to 2024, all items met the drinking water quality standards, despite the considerable length of the tap water supply network from the S Water Treatment Plant, where the tap water is produced, to the coastal areas at the far end of the coastal islands.
In the case of metals, the maximum level of zinc was 0.016 mg/L (0.53% of the legal standard), copper and iron were 0.049 mg/L (4.9%), and aluminum was 0.2 mg/L (20%) during the survey period, all of which remained at safe levels compared to the legal standard (Table 3).
Table 3
Seasonal/Monthly variation of metals (Unit: mg/L)
The seasonal distribution of metals was distinct, with zinc showing a common decline in the summer (August) of each year, aluminum increasing in the spring (May), decreasing in the summer (August), and generally increasing again in the winter (November). Meanwhile, copper and iron were barely detected, but only spiked in the winter months (November) of 2022, when zinc also peaked. As these metals display a seasonal trait, with some years presenting particularly high levels of these metals, the temporal distribution of metals was specifically examined in next sections.
Among the 24 DBPs (Table 2), trichloroacetonitrile and the health-hazardous substances such as benzene, toluene, ethylbenzene, and xylene were not detected in all periods and at all locations. Total trihalomethanes (THMs), chloroform, and chloral hydrate (Table 4) were always detected, and dichloroacetonitrile and dibromoacetonitrile were occasionally detected. Total THMs had a maximum value of 0.055 mg/L (54.67% of the legal limit), chloroform had a maximum value of 0.037 mg/L (45.83%), and chloral hydrate had a maximum value of 0.009 mg/L (28.67%). They remained below the legal threshold, which is set at a concentration that poses no risk, even when considering a person’s lifetime intake, throughout the study.
Table 4
Seasonal/Monthly variation of sterilization by-products (Unit: mg/L)
Taste and odor, which are aesthetic factors, were only present in the disinfection odor due to water purification or re-chlorination, while chromaticity remained undetectable. Because residual chlorine remains above 0.1 mg/L throughout each coastal zone, indicator microorganisms (e.g., general bacteria, total coliforms, fecal coliforms, and Escherichia coli) are considered non-detectable. Hydrogen ion concentration, and turbidity were all below legal limits and within the range of normal tap water.
In sum, as the water is supplied over long distances from water treatment plants located inland on the mainland to coastal islands, pressurizing facilities and drain field are built, operated, and re-chlorinated at these facilities to maintain adequate water pressure, quantity, and residual chlorine levels at the outlet (i.e., the tap), especially in response to the local development of the coastal islands, specifically, the development of tourism in the coastal islands and the resulting increase in demand for tap water. Therefore, DBPs may have increased as chlorine travels from the inland water treatment plant to the remote coast, where it is re-chlorinated again before reaching the islands, resulting in inadequate DBP levels. Conversely, there is also concern about microbial re-growth at the outlet because of the failure to maintain adequate levels of residual chlorine. However, after five years of examination, no microorganisms were detected, residual chlorine remained above 0.10 mg/L in accordance with the Water Supply and Waterworks Installation Act, and DBPs remained in the safe range for five years. It is also possible that benzene, toluene, ethylbenzene, xylene, or contamination indicator microorganisms (such as total coliforms) may be detected because of inadequate cleaning and disinfection procedures and insufficient discharge of facilities during the construction of drain field and pressurizing facilities in existing water supply pipes, but given that none of these items were detected, it is judged that the facility standards or cleaning and disinfection procedures related to the integrated construction of water supply pipes are scientifically established.
This study is a convergence study between the drinking water field and the marine fisheries industry in the coastal islands, especially fisheries and food-related fields, and the final goal is to make recommendations for efficient water management for coastal industries that use public water supply as industrial water; however, given that studies that quantify the spatio-temporal variabilities in public water supply quality in several countries are continuously reported, it is assumed that this study has important significance in itself to derive the spatio-temporal variabilities in water quality at the end of the pipes of the coastal islands, and its influencing factors. Examples of such international studies include the United States (2018-2020), where a significant proportion (10%) of locations were found to have inappropriate levels of metals and DBPs in drinking water (Scanlon et al., 2022); in developing countries, where public supply water has been reported to pose a health risk in the state of Ambala, India (Kamboj et al., 2024). Conversely, the tap water in South Korea’s islands is considered to be of very safe quality, despite the long distances it travels from its area of production. This can be attributed to the various administrative efforts that have been made to alleviate water shortages at various times in the development history of the coastal islands, such as the construction of pressurizing facilities and drain field, as well as appropriate levels of re-chlorination and end-of-pipe discharge.
Additionally, the data of four metals and three DBPs were compared and analyzed to understand the trend of changes in the tap water properties according to geographical distance, as well as to identify the yearly and seasonal changes and derive the cause (Figs. 2, 3, 4, Table 3, 4)
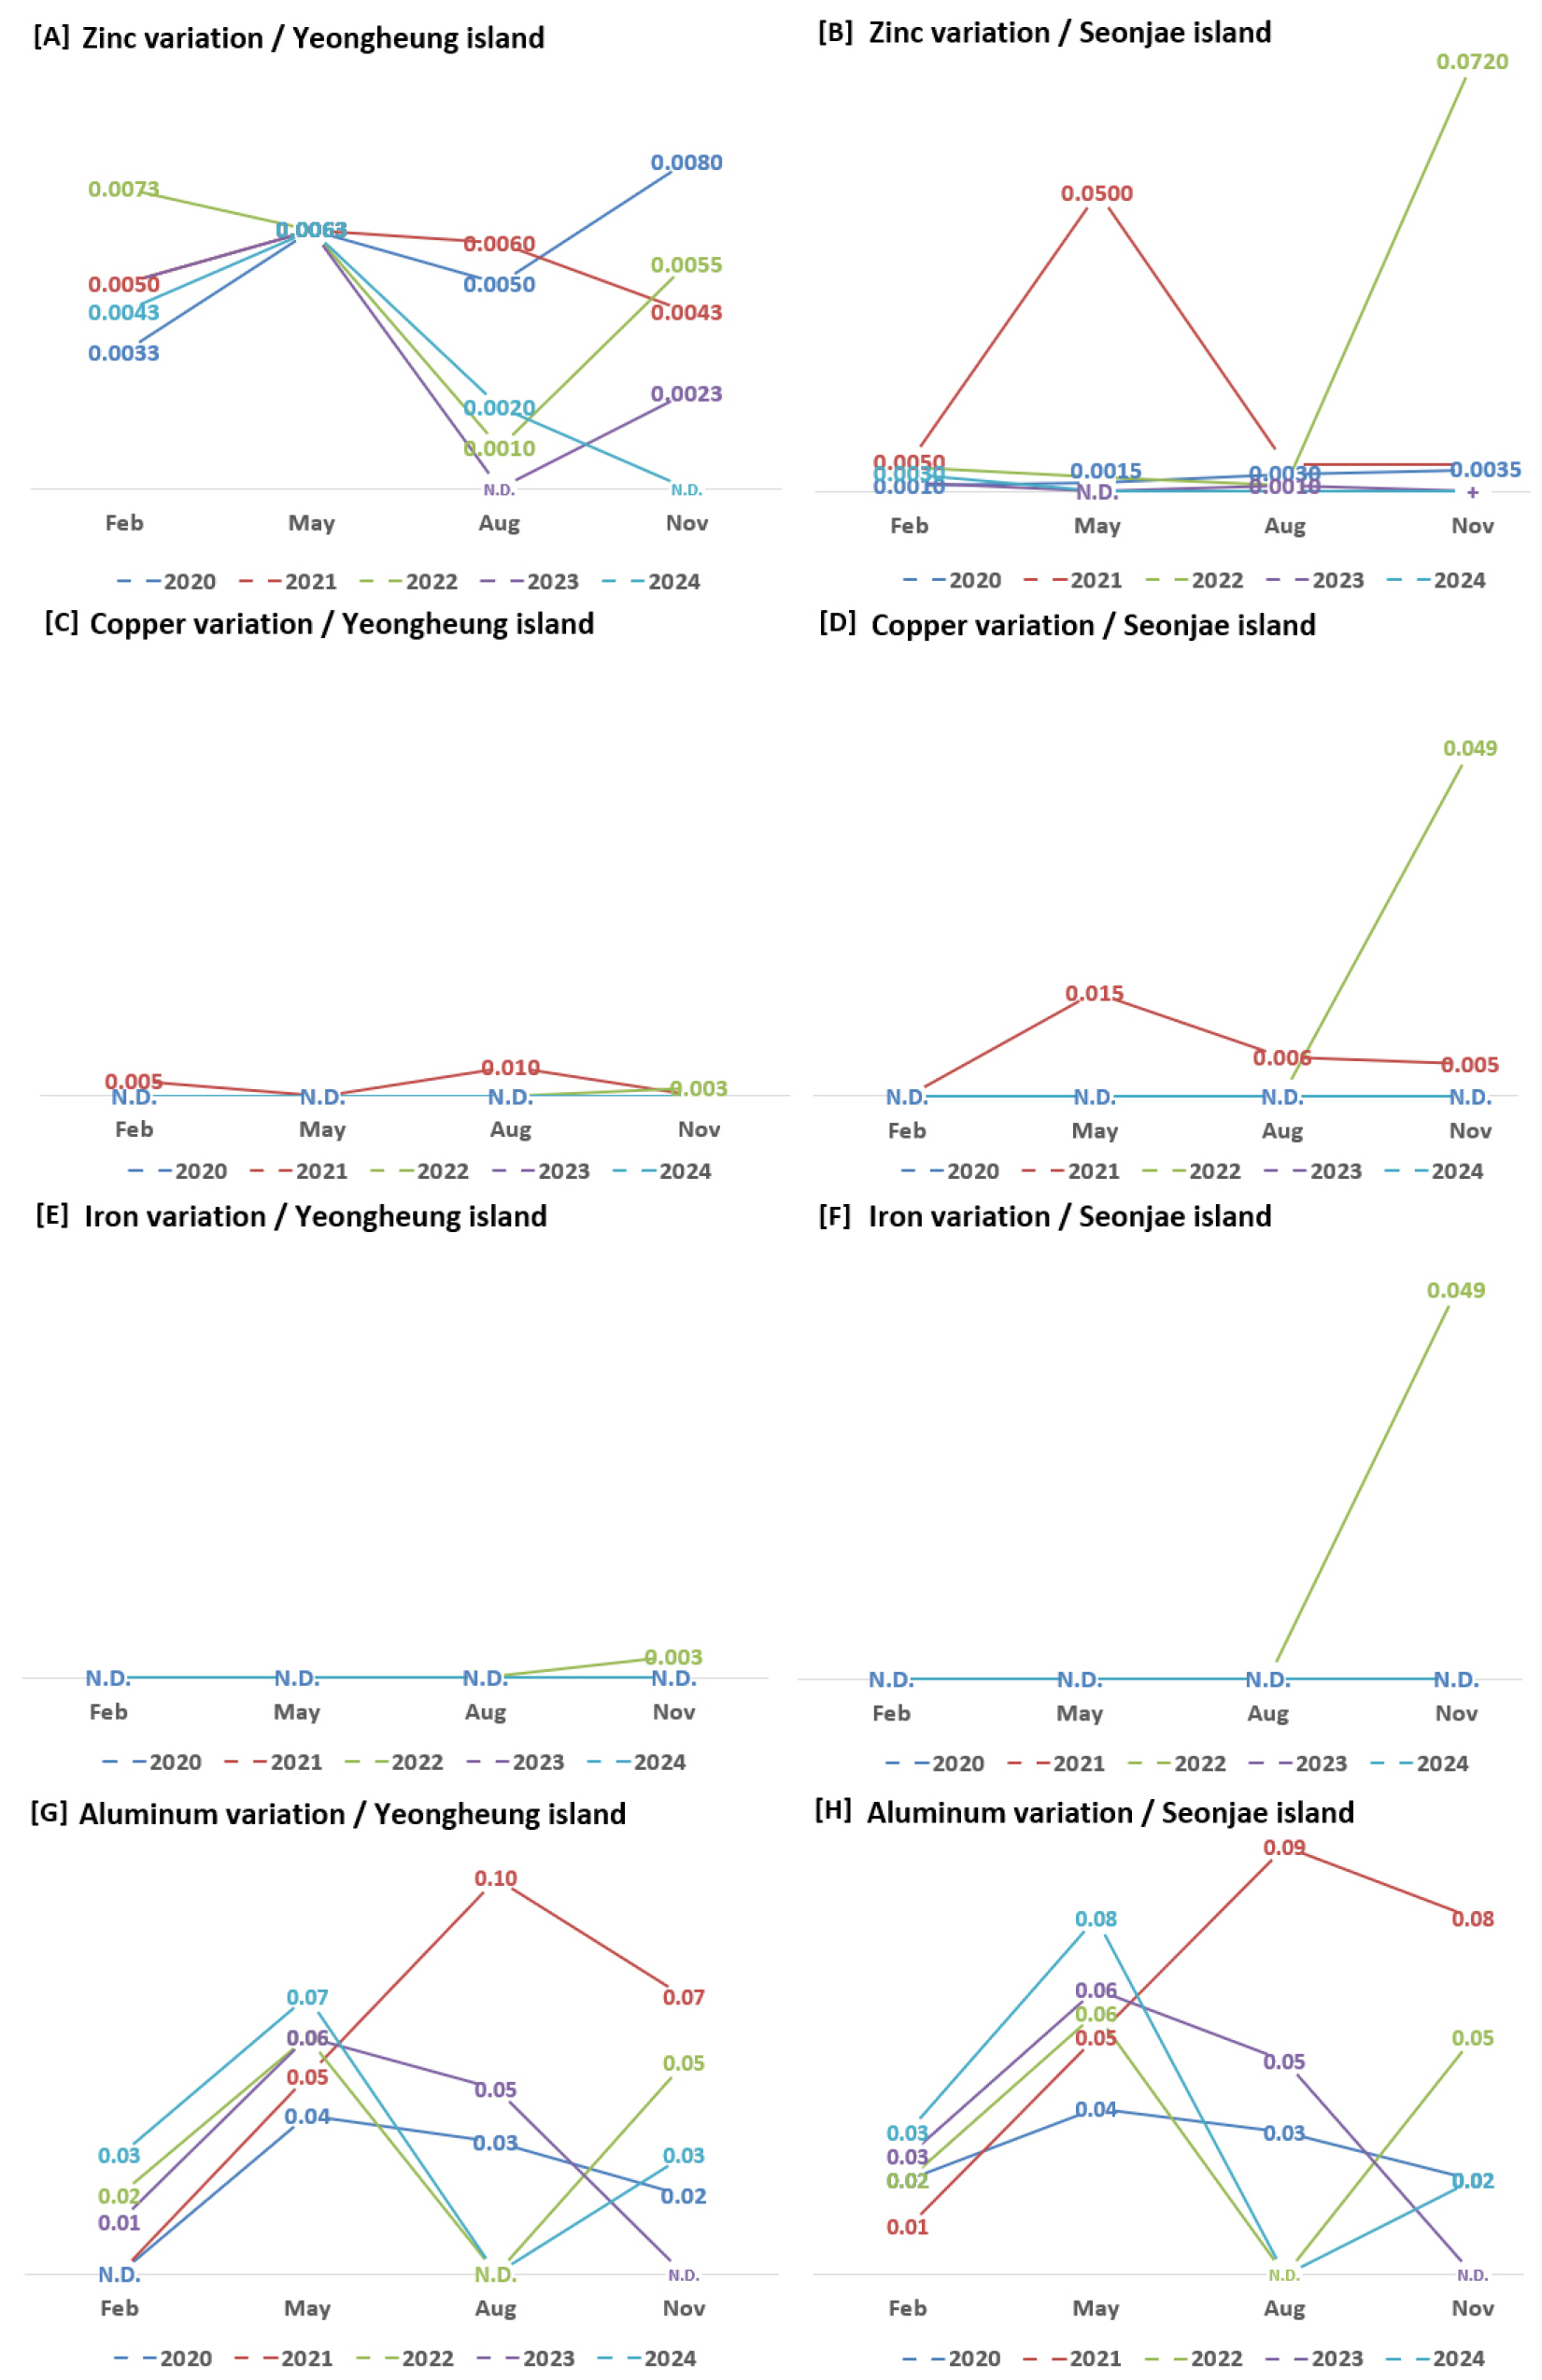
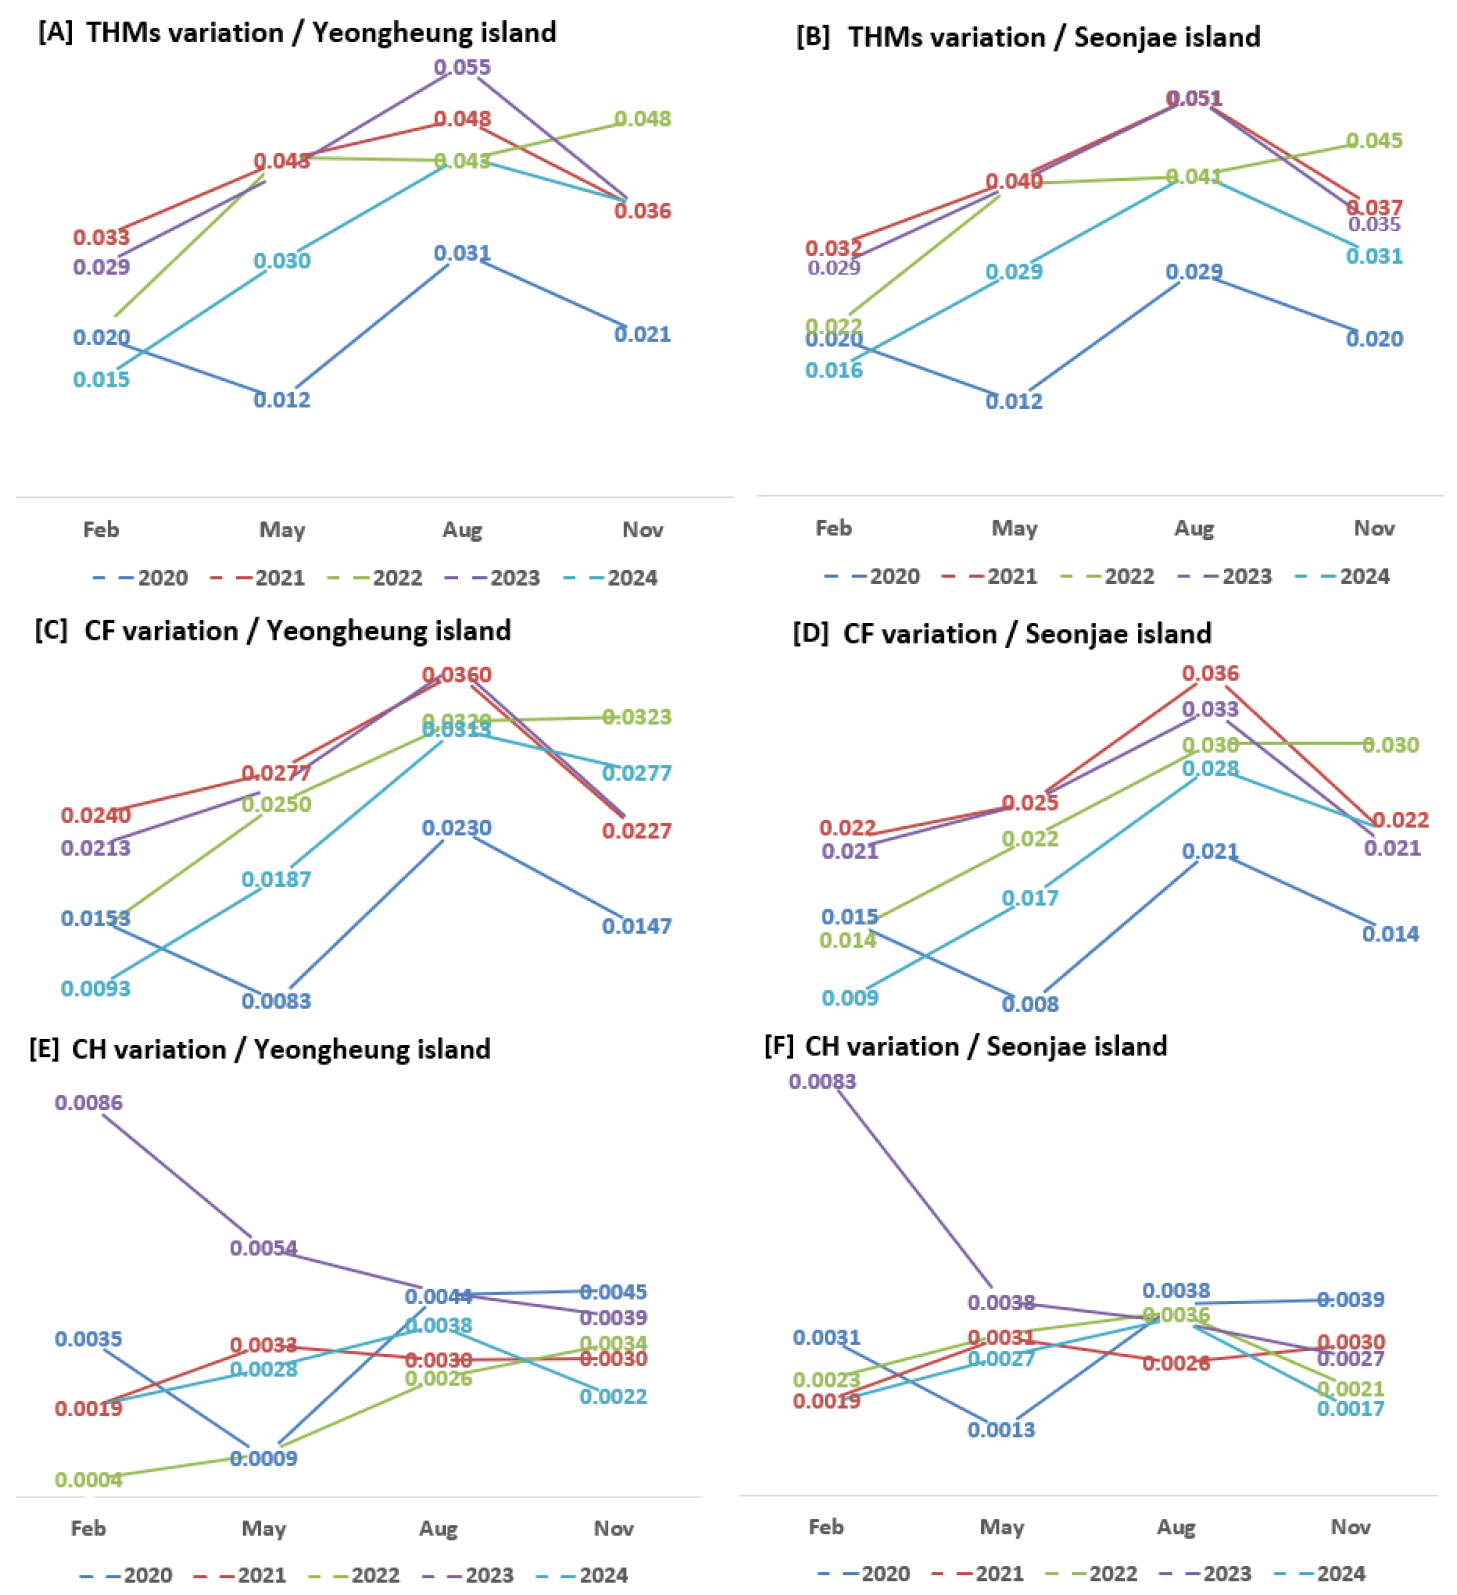
Fig. 3
Variation of disinfection by-products on each island (Left: Yeongheung Island, Right: Seonjae Island). The figure shows the seasonal trends in the five-year average concentrations of disinfection by-products from three locations on Yeongheung Island and two locations on Seonjae Island.
* Abbreviations: THMs: Trihalomethanes; CH: Chloral hydrate; CF: Chloroform
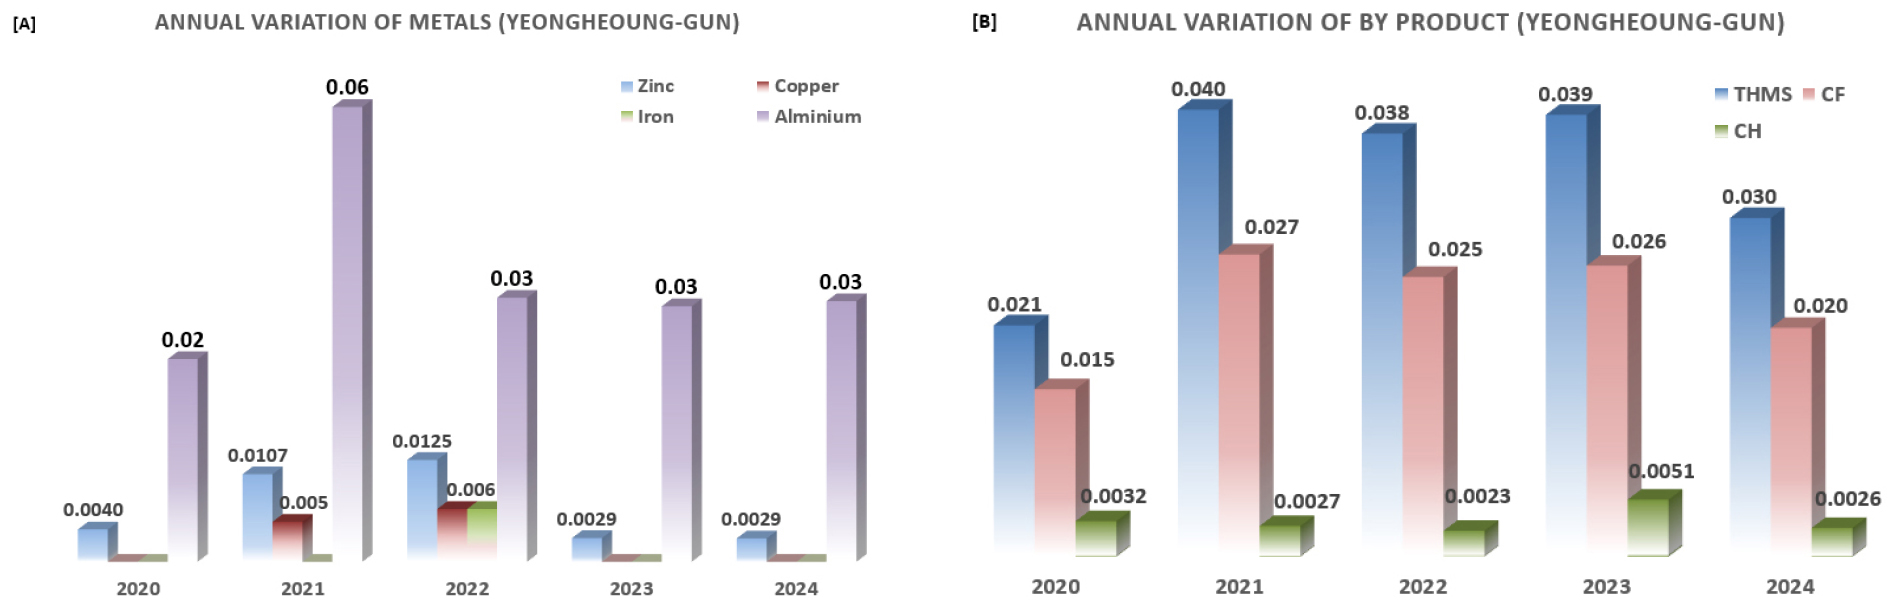
Fig. 4
Annual variation of metals and disinfection by-products across all five sampling sites. (A: Annual variation of metals; B: Annual variation of disinfection by-products.) Each graph presents the annual trend based on the average values from all sampling sites.
* Abbreviations: THMs: Trihalomethanes; CH: Chloral hydrate; CF: Chloroform
Metals trends and influencers
Among metals, zinc was not detected in the tap water immediately after the production of the S water purification plant during the same period as this study, but it was always detected in Seonjae Island and Yeongheung Island, the outermost islands of the West Sea (Fig. 2A, 2B, Table 3). The detection of zinc points to a distinct seasonal characteristic as described above. Furthermore, when comparing Seonjae Island and Yeongheung Island, the geographically remote Yeongheung Island has higher numerical figures. Although zinc is not an element specifically used in the water treatment process like aluminum-based flocculants, trace amounts below the limit of detection can be assumed to be owing to increased supply distances and prolonged accumulation within the wide-area water supply network (zinc levels in tap water were detected only twice in the five years immediately following the production of the inland S water treatment plant during the same period, with levels as low as 0.0020 mg/L in February 2021 and August 2022, data not shown). As this study does not seek to identify the detection cause of zinc, but rather to understand the differences in tap water properties between coastal and inland areas, it can be interpreted as follows:
Several measures are commonly used internationally to address the accumulation of organic and inorganic substances at the end of pipes in water distribution systems (WDSs), including internal corrosion control, hydrant flushing, and water main renewals (Barbeau et al., 2005); in particular, hydrant flushing can discharge large volumes of tap water in a short period, making it an efficient and practical option for removing organic and inorganic materials that would otherwise be inevitably deposited at the end of pipes due to increased distance in typical wide-area and regional water supply networks. Hydrant flushing is based on the proven premise that the amount of tap water used (discharged) is inversely proportional to the amount of metals and other residual substances in the pipes. Based on this premise, Seonjae Island and Yeongheung Island are coastal islands with their own tourism and fisheries industries, and the seasonal variation in zinc in these areas can be attributed to increased tap water use in the summer months. This effect can be maximized because Seonjae Island and Yeongheung Island are connected to the mainland via Daebu Island, a representative tourist destination. It is no secret that tap water usage spikes in the summer months because of the increased floating population, which is significantly higher than the permanent residents, and as mentioned above, a drain field was built in 2017 to address the area’s summer tap water shortage.
Aluminum, on the other hand, comes from water treatment to counteract harmful blue-green algae blooms in intake water. As for the yearly trend, we found a similar variation in concentration (seasonal trend) across all years, with the highest concentration in 2021. This is believed to be due to the large-scale algae bloom in the Han River system (Paldang water source), the source of water intake for S Water Treatment Plant, in the same year (aluminum at S Water Treatment Plant recorded 0.006 mg/L in 2021 during the algae alert period, and most of the other levels were either undetectable or close to the quantitative limit, data not shown).
Additionally, as for the seasonal variation of aluminum, the highest levels were recorded in 2021, and in most years, including 2021, there is a gradual decline through the summer months, followed by non-detections during the winter and spring months. This is believed to be the result of increased aluminum levels due to water treatment from spring to late summer, when algae blooms occur, gradually decreasing with continued consumption (discharge) of tap water at the end of the pipe.
However, it is anomalous that aluminum levels remained higher in 2020 and 2023, when algal blooms were not severe, compared to 2024, when they were most severe, and this anomaly is also seen in the yearly distribution of other metals such as zinc, iron, and copper. In 2021, the “decline effect in summer” of zinc in Yeongheung Island was analyzed to be lower than in other years (Fig. 2), and the decline effect in summer was restored in subsequent years. Seonjae Island also showed a spike in zinc detections in 2021, while iron and copper also spiked between 2021 and 2022. This deviation from the normal trend associated with a particular year ended in 2024. Similarly, the annual distribution of aluminum reveals that even in 2024, the year of the peak of the algae crisis, no aluminum was detected in the summer months, while in 2021, in the same situation, the aluminum decline effect in summer was minimal.
Given the history of tap water shortages in coastal islands as tourist destinations, the spike in tap water usage during the summer months could be linked to a reduction in metals in the water and pipes. However, a drop in tourists attributed to certain social factors can lead to a accumulation of trace substances in water pipes. Therefore, we analyzed statistical data related to changes in tourist flows to the coastal islands.
As Seonjae Island and Yeongheung Island are connected by a bridge, it is difficult to obtain statistics on the floating population in the area. However, if the maritime transportation statistics for the period are identified, it will be possible to understand the fluctuations in tourism population to the islands.
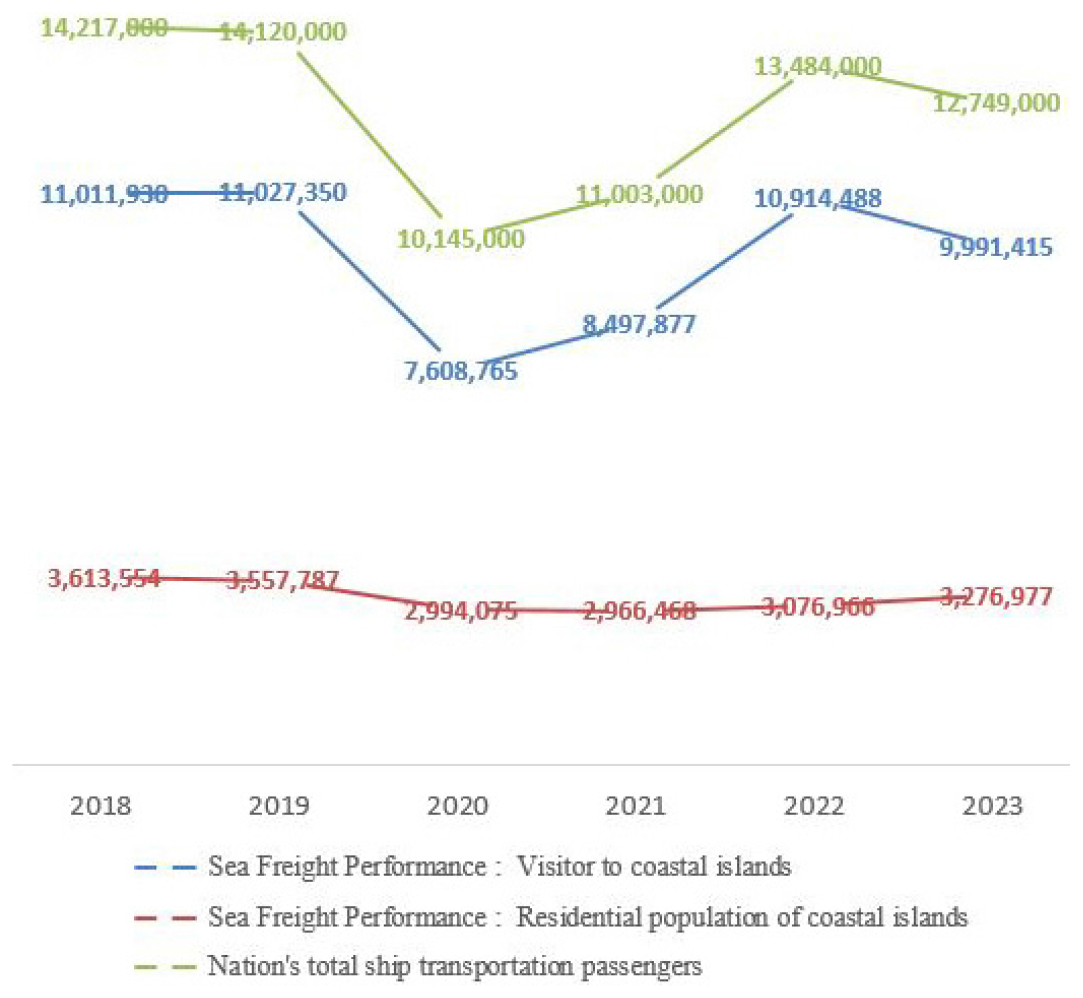
According to E-National Statistics’ Yearly “Maritime Transportation Data,” the number of maritime mobile population decreased by a maximum of 28.6% in 2020-2021 (Fig. 5). On the other hand, if the number of people transported on the coastal islands according to the Korean Shipping Association’s Statistical Yearbook of Coastal Shipping (KSA, 2024), there was no significant change in the number of resident population transported on the coastal islands, but the decline in tourists from 2020 continued until 2022 (Fig. 5). However, considering that the decrease in the number of tourists due to social factors in the coastal islands where a bridge was installed may have been larger than the decrease in the number of tourists due to the shipping, the decrease in tourists on Seonjae Island and Yeongheung Island may have been much larger than the above figures, and the impact of the tourism industry group may have been much larger. The overall downturn in the tourism industry is also confirmed by a study conducted by Statistics Korea, as the COVID-19 pandemic and social distancing were in full swing at this time (Kim, 2020). These social factors may also have contributed to a sharp drop in tourist flows to the coastal islands, and various media reports confirmed the magnitude of the decline. It is also believed that the resulting drop in visitors and downturn in tourism may have led to a reduction in tap water usage. The tourism industry in Seonjae Island and Yeongheung Island, which had been revitalized in 2020 by the local government, experienced a downturn during the COVID-19 pandemic, resulting in a significant decrease of the floating population (Youk et al., 2023).
The second half of 2022 was the point at which social distancing and the return to normalcy was in full swing; as shown in Fig. 5, the increase in cruise ship passengers and tourists was likely to increase the number of people traveling to the coastal islands, and by 2024, the “decline effect in summer” of residues in tap water is assumed to be more pronounced.
As illustrated in Fig. 4, if the annual average number of metals detected at all points on Seonjae Island and Yeongheung Island is derived (Fig. 4), these changes in tap water properties driven by social situations can be further supported. The 2020-2024 distribution of metals and DBPs roughly shows a pattern of a mountain peak, with the middle year having the highest values. The annual changes in copper, iron, zinc, and aluminum started with low values in 2020, peaked in 2021-2022, with a trend of being lower towards 2024. Eventually, as tap water is produced inland and travels to the coastal islands along the coast, levels of metals can increase within a safe range, and while routine use of tap water can keep levels low, social factors such as a decrease in floating population, and subsequent decrease in tap water usage, can cause changes in the tap water properties.
Large cities developed along the coast are a major source of tourism revenue for local governments, and as a matter of policy, administrative research, and efforts to capitalize on tourism in coastal islands are ongoing (Hur et al., 2022; Youk et al., 2023). In this process, maximizing access to the inland areas by building a bridge between islands and the inland areas can maximize the inflow of floating population on a daily basis, and drive the development of local industries, compared to less accessible coastal islands of the coast (e.g., Baekryeong Island). However, some analyses also suggest that the decline in stay-over tourists can be maximized due to COVID-19 or seasonal factors. While this higher accessibility is a strength for the development of food and beverage service industries related to the fisheries and tourism industries inherent in the islands, it also leads to changes in the tap water properties as an industrial water source when combined with social and seasonal factors that cause a decrease in the floating population. This means that the relevant industries should have differentiated guidelines from inland operations due to social, seasonal, and location factors, to efficiently operate their water management systems. On the administrative side, the factors identified in this study should be considered in coastal water quality management measures such as hydrant flushing operations.
Analysis of DBPs trends and influencers
The total THMs and chloroform presented an increase in the summer months for both Seonjae Island and Yeongheung Island. This is related to increased chlorine inputs, higher temperatures, and re-chlorination during the summer months. As an example of the relationship between temperature changes and DBPs in a water supply network, it has been revealed that the temperature of tap water can increase toward the end of a pipe from a conventional water purification plant, and that the levels of some DBPs increase with increasing tap water supply distance because of the increased contact time between chlorine and organic matter (Chang et al., 2010). Considering the detection trend of three the DBPs that can be detected routinely, it is determined that Yeongheung Island, where the most distal beaches (Janggyeongri Beach and Siklipo Beach) are located, is slightly higher than Seonjae Island, especially in the summer, and it is judged to be caused by the increase in the generation amount of DBPs owing to the distance of tap water traveled. For example, in August 2020, THMs, chloroform, and chloral hydrate were 8.7%, 9.5%, and 17% higher, respectively, in Yeongheung Island, close to the West Sea, than in Seonjae Island, and this trend was confirmed by November of the same year. In the winter, the detection value of DBPs dropped sharply compared to the summer, but the highest levels were still found in Yeongheung Island.
However, unlike metals, DBPs did not exhibit a summer decline, which is likely because both islands are equipped with a drain field to keep the water supply above the proper pressure, and re-chlorination is performed in the offshore areas. However, as illustrated in Fig. 4, the annual average level of DBPs in Seonjae Island and Yeongheung Island remained high in 2021-2023, when infectious disease issues occurred; hence, it is believed that the increased residence time in local tap water due to the decrease in tap water usage could have increased the contact time with trace organic substances in tap water, which increased the amount of DBPs to some extent. In conclusion, it is believed that changes in tap water usage because of social and seasonal factors may be one of the factors affecting the amount of DBPs and metals detected.
Recommendations for differentiated water management for coastal industries
Coastal areas, including coastal islands, are inherently maritime and fisheries-oriented, which means that in addition to traditional fishing activities, fisheries, fishery processing industries, and food and beverage service industries can be developed in parallel with tourism based on unique local characteristics. Local government-led administrative efforts have played a major role in promoting industries on islands, and a representative example is the establishment of the Basic Plan for the Development of Incheon Islands and the Basic Plan for Island Development through Comprehensive Analysis of Islands (Incheon Metropolitan City), which characterized Yeongheung Island and Seonjae Island, the subjects of this study, as “tourism resource-type islands,” where tourism has been intensively fostered in addition to basic fishing (Youk et al., 2023; Hur et al., 2022).
Considering the development history of the food and beverage industry, a concession industry will be developed that can maximize synergies such as the effects of attracting visitors by linking the food industry with the infrastructure of the traditional food service business and tourism industries (Lee and Lee, 2010; Park et al., 2018a; Park et al., 2020a). Additionally, the logistical advantages of being close to fishing ports where seafood and seafood raw materials are loaded, and the stability of raw material supply can lead to the development of seafood storage and distribution (refrigeration and freezing industries), simple fishery-product processing industry, and seafood manufacturing and processing industries (Kim and Lee, 2018). It is possible to consider the impact of tap water volatility as an industrial water source, depending on the process characteristics of each of these different industries.
Based on food sanitation laws and standards, the crucial prerequisite for ensuring food safety in these industries is water safety, and these industries can use natural water, such as tap water or groundwater produced by local governments or K-water, as industrial water. However, groundwater-derived waters, including village water supplies, have a high potential for biohazards, and microbial hazards have been consistently reported in practice for small-scale water treatment of these natural waters at the village level (Park and Kim, 2012; Park et al., 2018b). Owing to the demographic characteristics of a large floating population, food safety incidents in the food manufacturing, processing, or food and beverage service industries in coastal areas, such as coastal islands, can be difficult to respond quickly, including epidemiologic investigations, and to curb the disease spread in the community. Additionally, as for seafood or simple fishery products, unlike processed foods, the traceability management system for seafood is not mandated by the Agricultural and Fishery Products Quality Control Act (MAFRA, 2023). Thus, it is difficult to take active measures such as recall and cause investigation through the distribution history when product quality problems occur in coastal areas. Therefore, considering the high safety of tap water in the coastal islands presented in this study, it can be concluded that using tap water as industrial water in the islands is advantageous in terms of safety and supply stability.
However, as the tap water properties inevitably change owing to geographical factors, some effects can be generally assumed, given the traits of the process in these industries and the applicable legal framework. As the use of raw water filtration (pretreatment) systems in the fisheries, seafood manufacturing, or food and beverage service industries is voluntary and not mandatory for operators, the discussion of impact factors can be separated into those that use filtration systems and those that do not (Aziz et al., 2024). As for the latter case, it may be helpful to consider the impact on products and processes and to develop differential process control guidelines accordingly. Suggestions for each of these situations can be defined, as presented in Table 5, and are organized to be optional additions to existing good manufacturing practices processes (GMP processes) and sanitation standard operating procedures (SSOPs) in place at each workplace.
Table 5
Checklist for proposing a differentiated raw water management process
Operators with raw water pretreatment systems
The quality departments of large-scale fishery industries, seafood manufacturing industries, or food and beverage service industries clearly recognize the presence of trace amounts of organic and inorganic substances in tap water; thus, they set up operational guidelines for water filtration systems in their GMPs or SSOPs to soften raw tap water and remove trace amounts of metals, disinfection odors, and DBPs belonging to volatile organic compounds (VOCs) (Kim et al., 2021; March et al., 2020), based on the results of their own test analysis (Cusato et al., 2013; Kussaga et al., 2014; Park et al., 2019, 2020b). Specifically, DBPs as trace metals and VOCs in water are themselves factors that directly affect the organoleptic quality of food and beverages, including taste and odor (Kim et al., 2021; Wujie et al., 2011), and the impact of raw water on organoleptic quality is significant, especially for food types with high moisture content or water itself. Additionally, the concentration of metals can cause off-flavors or freeze-burn in solid products and frozen foods with high lipid content (Medina et al., 2009), and many fish species among seafood products require freezing in water with high lipid content or filtered water (Chen et al., 2022). The guidance on managing manufacturing and processing facilities, equipment, and water supply pipes that may be affected by trace amounts of organic and inorganic substances originating in water (e.g., cleaning, disinfection and sanitation) is also set up and operated in-house. For this reason, larger plants operate their own water filtration systems (Clause 1.1 of the Table 5). Conversely, food and beverage service industries that operate their own water filtration system (i.e., food service business under the Food Sanitation Act, MFDS, 2024b) may use a direct water filter connected to the water pipe without installing a separate water storage tank because their water usage may be low or fluctuate less than that of manufacturing and processing industries or fisheries; larger food service businesses with fluctuating water usage may apply a multi-stage filtration system (Clause 1.2 of the Table 5). This is to prevent the inevitable consumer organoleptic impairment caused by tap water despite its safety (Kim et al., 2021; March et al., 2020). As indicated thus far, coastal and inland operations have the same methods and operational procedures.
However, in addition to this primary reason, this study also found that the variations in tap water properties in coastal areas because of geographical, social, and seasonal factors, require a more sophisticated filtration system or facility operation system than manufacturing and processing facilities located in inland areas. For example, it has been reported that filters with slower than normal passage rates can cause water pressure changes in the piping system or cause physicochemical disturbances in the piping system, which can lead to the accumulation of microorganisms and metallic contaminants (Nriagu et al., 2018); filtration system replacement intervals that are not set differently in coastal areas than inland will bring negative consequences. For a separate reason, in the food and beverage service industry, which develops in conjunction with the tourism industry, quality, including the organoleptic quality of the final product, is considered to be a separate challenge from “meeting the operator’s own quality standards” and “ensuring that the quality perceived by consumers is uniform everywhere and at any time.” Given that Korea’s modern food and beverage service industry is in the stage of development as a franchise or concession industry, it is difficult to secure product and brand identity as well as consumer trust when consumers feel that the organoleptic experience is not uniform across the places of business they visit (Kim and Ahn, 2012; Oliver, 2014). Even if a company producing an individual product sets high quality targets, and if the organoleptic elements perceived by the consumer are not uniform in time and space, the quality of the product itself is compromised. Therefore, if places of business are located in coastal islands or coastal areas, it will be necessary to have differentiated water pretreatment guidelines (Clause 1.1 of the Table 5).
Operators without a raw water pretreatment system
On the contrary, small-scale seafood businesses that are not required to report their business under the Food Sanitation Act as simple distribution or simple fishery-product processing industry, or that are not required to report their business under the Food Sanitation Act, as other food sales businesses (MFDS, 2024b) because their business premises are smaller than 300 m2 (MFDS, 2024b), are highly unlikely to use their own water filtration system. Filtration systems are legally required for the control of biological hazards in natural water, such as groundwater, which is not tap water, as a food ingredient (Kim et al., 2010; Ko et al., 2011), but the installation of filtration systems or filters when using tap water is not required by the relevant Acts related to the seafood and food industry. This is because, as long as tap water is used as a source of water, it is not a matter of water safety, but rather the properties of the water or the organoleptic quality of the final product, which is not subject to regulation. Consequently, small-scale simple fishery product sales businesses, which are typically clustered in small food and beverage service industries or joint markets, may not be equipped with filtration.
In this case, raw water can be categorized into two types: those that are included in the final product and those that are not included in the final product but come into direct contact with raw materials during manufacturing and processing. Food manufacturing and processing involves highly concentrated processes such as freeze-drying, heating, freezing, deicing, precipitation, and reverse osmosis to impart unique organoleptic properties to the final product, and ensure storage quality and food safety (Deshpande et al., 1984; Sánchez et al., 2011; Tobar-Bolaños et al., 2021). As for the simple fishery-product processing industry, there are mostly simple processing processes (e.g., freezing, promession, de-icing, slow freezing, slow drying, and boiling) where the raw water is highly concentrated (Sánchez et al., 2011; Tobar-Bolaños et al., 2021). Additionally, many types of yield products in the food industry are extremely concentrated to reduce the water activity of the final product to prevent rancidification, spoilage, decay, or the growth of unwanted microorganisms during distribution (Maneffa et al., 2017). While these processes are essential for the safety, preservation, and unique organoleptic qualities of simple processed seafood products, failure to account for changes in water properties has the potential to compromise uniform organoleptic quality. Even if the tap water used to supply inland and coastal locations has only minor differences in properties, the highly concentrated nature of the food and beverage or food manufacturing process can result in uneven organoleptic qualities in the final product at different times of production.
Conversely, as mentioned above, in the absence of a water filtration system, water may come into contact with raw materials during the product’s processing, even if it is not included in the product. For hospitality services, such as keeping seafood fresh, food and beverages, ice-making machines are operated. Many ice-making facilities distributed in Korea are designed to supply water to a tank inside the facility, spray tap water onto electrically cooled ice rods located on top of the tank to grow ice crystals; when the ice crystals grow to a certain size, they conduct heat to the rods and drop them to stockpile ice in the lower storage compartment (Jang and Lee, 2015; Park et al., 2019). While water is continuously supplied to the tank for continuous ice making, only the pure water component is preferentially frozen, and trace residues from the water are continuously concentrated in the tank. At some point, the ice quality may alter owing to concentrated residuals, which, in addition to organoleptic problems, can cause scale formation and reduce the bacteriostatic effect of residual chlorine from tap water. Therefore, the self-management guidelines for these places of business may require reduced cleaning cycles for water-related equipment and appliances or water distribution systems for coastal sites (Clause 2.1 and 2.2 of the Table 5).
Operation of a separate water storage facility
Third, the manufacturing and processing of food products usually involves multiple steps, and some of the processes are time-dependent, which inevitably require more time than other processes (e.g., heating, cooling, freezing, and stowing). Additionally, in the case of seafood, it is difficult to accurately predict the amount and timing of raw material capture; hence, the production and shipment of seafood and simple processed seafood are inconsistent. Furthermore, as for food and beverage services in coastal areas, product consumption and raw water needs can fluctuate dramatically based on seasonal factors. These various causes mean that the amount of raw water required for production is variable, indicating that water storage facilities must be operated.
However, according to the food safety management certification operation standard, if a separate water storage facility is operated, an approved disinfectant must be administered to control biological hazards, and it is required to set management standards for chemical hazards such as DBPs caused by disinfectants (MFDS, 2023). If the places of business are not certified for food safety management, the Food Sanitation Act requires conducting a contracted inspection once a year, and a contracted cleaning and disinfection twice a year, and finally, the DBP standard of the drinking water quality standard must not be exceeded (MFDS, 2023). Chlorine is added at the tap water production stage, and in coastal areas where the supply pipe is distant, DBPs may gradually increase due to increased reaction time, and in drinking water supply networks in coastal areas, the flow rate is augmented through drain field, pressurizing facilities, and re-chlorination (Kim et al., 2010), thus, some DBPs may gradually increase within an extremely safe range, as shown in the results of this study. If food and seafood operators operate their own water storage tanks and perform their own chlorination, they may experience differences in the concentration of DBPs that cause off-flavors in food and beverages compared to inland places of business, and should consider the impact on organoleptic qualities, even within safe ranges (Kim et al., 2021; March et al., 2020). Some DBPs can be addressed through the application of a water filtration system, which may mitigate the impact on organoleptic qualities.
Concession industries
Finally, in tourist destinations that develop tourism, various types of service industries, including food and beverage service industries, develop, and concession industries emerge to achieve synergies between them (Lee and Lee, 2010; Park et al., 2018a, 2020a). The concession industry is a form of spatial convergence of food and beverage service industries with various types of (non-food) consumer goods industries within a specific space with a floating population, which has the advantage of maximizing the profit effect of attracting tourists (Lee and Lee, 2010). The business areas of the concession industry can be concentrated in transportation facilities (e.g., airports, railway stations, interiors of large transportation vehicles, roads, ports, and rest areas), leisure facilities (e.g., parks, theme parks, and accommodation such as resorts or hotels), cultural and sports facilities (e.g., museums and stadiums), shopping malls, and public infrastructure (e.g., government offices and schools); transportation, travel, and accommodation infrastructure can be concentrated in places that have great potential as tourist destinations (Lee and Lee, 2010). In general, the food and beverage service industry is essential to the operation of the concession industry, and contract management with landlords is pivotal for the management strategy of the concession industry (Lee and Lee, 2010); in terms of consumer relations, thorough product quality control, organoleptic quality management, and hygiene management are important because they are always exposed to a large number of tourists (Lee and Lee, 2010). However, buildings in the concession industry are not built in consideration of the “operator compliance under the Food Sanitation Act” or “facility equipment regulations” required for food operators by nature (Park et al., 2018a, 2020a); the concession industry is an industrial trend that emerged to maximize competitiveness and mitigate economic risks stemming from changes in floating population in tourist destinations, not a specific legally regulated business (Park et al., 2018a).
As a result of these inherent limitations, food and beverage service operators in the concession industry may not have the freedom to modify their facilities and may be unable to easily install and operate water filtration systems to control the delicate organoleptic quality of their water and products. In such cases, these aspects must be agreed upon in advance in the management of contracts for the entry of food and beverage service businesses (Park et al., 2020a) (Clause 3.1 and 3.2 of the Table 5). If a filtration system is not feasible, it may be necessary to have different cleaning intervals for equipment, appliances, and supply and drainage pipes than inland places of business, for ice, water, and steam that are directly contained in the final food and beverage product or that come into contact with food during manufacturing and processing (Clause 2.1 and 2.2 of the Table 5).
In the fisheries, as fishery processing industries and food industries, the biohazards in water are ultimately related to the safety of the final product; a great number of studies have been conducted to ensure safety. However, there is not much research on the properties and quality of water; in Korea, when researching and developing new products or searching for original equipment manufacturer (OEM) candidates for new products that have been developed, water filtration systems are often set as a requirement for outsourced production. However, even in these cases, it is primarily to reduce the impact on organoleptic qualities and ensure homogeneity of the raw material, and only a few realize that the properties of tap water change along the length of the supply chain. Therefore, this study will provide important information for efficient water management, water supply and drainage system management, facility management, and uniform quality of final products in various fishery- and food-related industries in coastal cities or coastal islands.
Conclusion
This study attempted to investigate the safety of tap water as industrial water supplied to coastal islands, and the variations in its properties. According to the analysis of a total of 24 items according to the drinking water quality standards for tap water supplied to Seonjae Island and Yeongheung Island over the past five years, all items remained within the safety zone of the statutory standards, despite the process of building and operating pressurizing facilities, drain field, and re-chlorination to respond to the shortage of local water supply in the coastal islands. On the contrary, when comparing the water quality of each coastal island with the S water treatment plant, which is the production site of the tap water supplied to the coastal islands in these coastal areas, trace increases in metals and DBPs were observed within a safe range due to the increase in the geographical distance of the wide-area water supply network. However, in addition to these geographical factors, it was also found that the properties of tap water can change due to seasonal factors that cause changes in the floating population as a coastal tourist island, and social factors such as COVID-19/social distancing policies. In these coastal areas, tourism (food and beverage service industry) and fisheries as well as aquaculture-related industries are developed by local governments, and the influencing factors on coastal water performance derived from this study can be reflected in the setting of water supply and drainage guidelines, water management guidelines, and facility equipment guidelines for these industries. Additionally, the study discussed the impact that changes in tap water properties can have on the water supply and drainage system for manufacturing and processing in coastal industries, or the organoleptic quality of the final product that can be perceived by consumers, and suggested the need and direction for differentiated guidance for inland places of business. Coastal areas and islands have favorable conditions for the development of food and fishery industries as tourist destinations, and coastal industries in particular have various social implications, including the realization of regional balanced development, the implementation of the sixth industrialization, and the establishment of a virtuous cycle of local economies based on local characteristics. Considering that, the national, central, and local governments have supported their development in policy. Considering that the changes in tap water properties as industrial water may be different from those patterns of inland areas, and if the water management guidelines and manuals of marine and fisheries industries can be developed more elaborately based on the checklists finally derived in this study, it will have a positive impact on the sustainable development of these industries.
