

Introduction
Materials and Methods
Materials Used
Experimental Method
Elemental Analysis of Substrate
Chemical Analysis of Substrate
Results and Discussion
Control Environment in the Small Smart Greenhouse
Lettuce Germination Rate Verification
Changes in Lettuce Growth
Changes in Crop and Substrate Weight
Elemental Analysis of Substrate
Chemical Analysis of Substrate
Conclusion
Introduction
Problems such as climate change, ecosystem destruction, and declining agricultural productivity have emerged with the intensification of global warming. As a result, there is growing worldwide interest in sustainable agriculture and food security. Among the major greenhouse gases, significant amounts of nitrous oxide (N2O) and methane (CH4) are known to be released into the atmosphere through agricultural activities (Choi et al., 2018). In response, various studies have investigated ways to reduce greenhouse gas emissions and promote sustainable agriculture. In this context, there has been increasing interest in biochar. Biochar refers to a solid product obtained by thermally treating various organic materials, including agricultural and forestry byproducts, at high temperatures (300-800°C) under limited or no oxygen conditions. Lee et al. (2020) reported that applying biochar at a high ratio significantly reduced methane and nitrous oxide emissions from agricultural soil while increasing organic carbon storage in the substrate. Additionally, studies have shown that biochar is effective for improving soil structure and adsorbing heavy metals and pollutants over an extended period, contributing to soil restoration (Yun et al., 2023). Biochar is known to enhance water retention and nutrient-holding capacity, thereby promoting crop growth. Furthermore, it converts biomass into a stable carbon form through pyrolysis, and when applied to soil, it functions as a carbon sequestration agent (Lee et al., 2021). Jang et al. (2018) reported that biochar reduces the leaching of essential nutrients such as nitrogen, continuously supplies nutrients within the soil, and enhances nutrient uptake by crops.
Cocopeat refers to the processed residue left after removing fibers from coconut fruit. Cocopeat growing medium is widely used because of its excellent physical properties, such as water retention and permeability, making it highly versatile. As of 2024, about 52% of single-span greenhouses in domestic smart farms utilized cocopeat growing medium (Rural Development Administration, 2024). A key drawback, however, is the lack of designated applications after use. Additionally, bamboo, known for its rapid growth rate and widespread distribution, has gained attention as a sustainable biomass resource. Studies have confirmed that bamboo can be thermally processed for use as a solid biofuel (Park et al., 2024). Coffee waste refers to the residue left after coffee extraction; it is a biomass waste generated in large quantities worldwide every year. In South Korea, an individual consumes about 405 cups of coffee annually, resulting in the generation of a significant amount of coffee waste. According to research, about 0.91 kg of coffee waste is produced per 1 kg of coffee (Kim et al., 2016). Coffee waste is reported to be suitable as a raw material for biochar owing to its high carbon content and porous structure (Emmanuel et al., 2016).
Given its high sensitivity to soil conditions, nutrient supply, and environmental changes, lettuce is considered an ideal model crop for quickly evaluating the effects of various soil amendments or treatment methods on crop growth (Han et al., 2014). The application of biochar has been reported to have a positive effect on vegetable seedling growth and improve nutrient absorption (Kim et al., 2020). It has also been shown to increase the seed germination rate of lettuce and enhance leaf length, width, and number. Some studies, however, have found that biochar application in lettuce cultivation might not always be effective under all conditions, and excessive biochar application might negatively affect plant growth (Tisserant and Cherubini, 2019). These conflicting research results highlight the need for further studies using biochar.
This study, therefore, evaluated the effects of biochar application on crop growth by producing biochar from bamboo, cocopeat, and coffee waste and applying them to horticultural substrates in appropriate proportions. The growth changes in lettuce grown in substrates mixed with each type of biochar were examined.
Materials and Methods
Materials Used
The materials used in this study were waste cocopeat, bamboo, and coffee waste. For the waste cocopeat, discarded substrate was collected from the greenhouse at the College of Agriculture and Life Sciences, Kangwon National University. Bamboo was purchased from Korea Bamboo (Hapcheon-gun, Gyeongsangnam-do, South Korea). Coffee waste was purchased in pellet form (coffee waste pellets, Coffee Fire, South Korea). These materials were processed into biochar using an electric furnace (N 7/H/B410, Nabertherm GmbH, Germany) at 500°C for one hour. The resulting biochars were named CO, BB, and CP for waste cocopeat, bamboo, and coffee waste, respectively.
Experimental Method
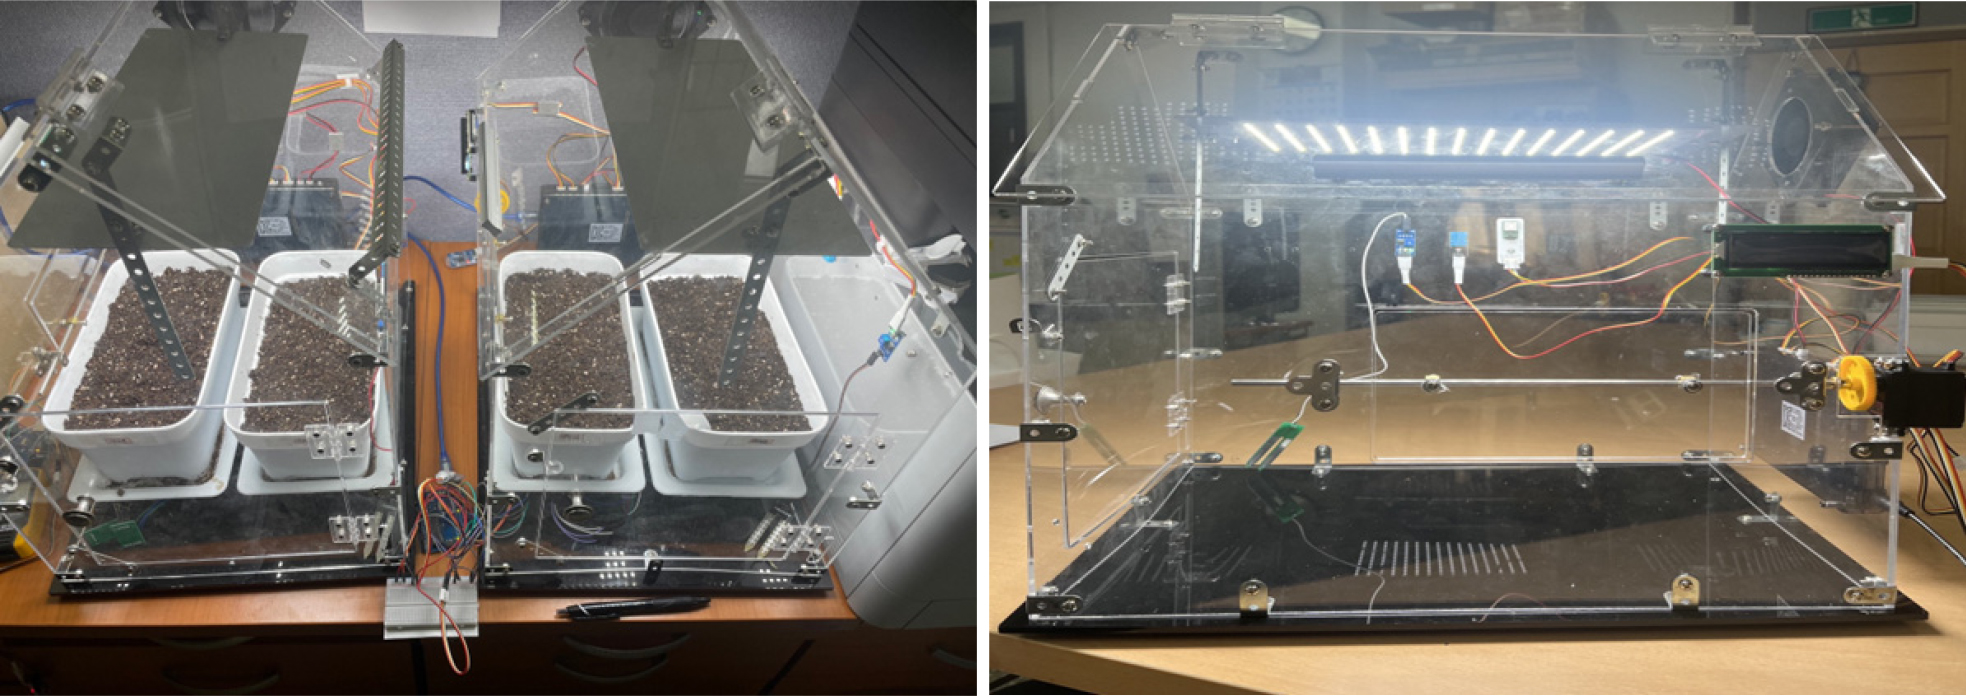
Horticultural substrate was used as the test substrate, and biochar was applied at a rate of 5% (w/w) relative to the substrate weight and then mixed into pots for fertilization. A negative group (NEG) was used as the control. This was chosen because the current biochar mixing ratio used in actual farming practices is around 5%, and there were no growth rate analysis results for this ratio; thus, a 5% mixing ratio was selected for this study. To accurately evaluate the effect of biochar on crop growth, a small-scale smart greenhouse was used to maintain a stable internal environment and control variables. A small-scale smart greenhouse equipped with a Blueino system was used to control the growth environment of the lettuce (Fig. 1). The system was set to operate LED lights for 16 hours, and if the internal temperature of the greenhouse exceeded 26°C or the humidity exceeded 70%, an automatic ventilation fan was activated. Growth environment data, including temperature, humidity, light intensity, and CO2 concentration, were recorded every five seconds via serial communication and then averaged over five-minute intervals. Water was supplied to each pot at a rate of 200 mL three times a week. An Arduino scale (HX711, ShenzenAV, China) was installed to monitor weight changes in the pots.
Lettuce seeds were sown at a rate of 10 seeds per pot. After checking the germination rate, six seedlings were thinned per pot to observe the growth process. To assess growth, changes in length and width were measured using a vernier caliper, and the total number of leaves per plant was counted. Lettuce was grown in three separate periods (April 29, 2024, to May 24, 2024; August 14, 2024, to September 4, 2024; September 23, 2024, to October 14, 2024). To prevent continuous cropping damage, the substrate was replaced after the first cultivation cycle. To assess the effect of continuous cropping, the third cultivation was conducted without replacing the substrate after the second cultivation. External temperature and humidity were measured using a temperature-humidity sensor (DT-172, CEM, China) to compare the effects between the external environment and the small smart greenhouse. A t-test was performed using SAS (SAS 9.4, IBM, USA) to determine statistical significance between the biochar treatment group and NEG.
Elemental Analysis of Substrate
Elemental analysis was performed using an elemental analyzer (FlashSmart, Thermo Fisher Scientific, USA) at the Samcheok Joint Experimental and Practical Laboratory of Kangwon National University, measuring carbon, hydrogen, and nitrogen. Oxygen content was derived using Equation (1):
Table 1 shows the elemental composition of the substrate according to the type of biochar before each lettuce cultivation.
Table 1.
Elemental composition ratio by biochar type
Chemical Analysis of Substrate
In this study, the chemical properties of the collected substrate samples were analyzed at the AT Analysis Center. The analysis included cation exchange capacity (CEC), pH, and electrical conductivity (EC). A substrate with a high CEC is known to provide favorable conditions for crop growth, as it can retain essential nutrients for a longer period (Kim, 2013).
pH indicates the acidity or alkalinity of the substrate. Additionally, EC provides a measure of the concentration of dissolved salts in the substrate. These three indicators allow for the assessment of the chemical status of the substrate, helping to determine whether it is suitable for growing lettuce.
pH and EC were measured using a pH meter (Hanna Instruments, Seoul, Korea) and an EC meter (Thermo Fisher Scientific, Massachusetts, USA), respectively. CEC was measured using an ICP (AMETEK, Pennsylvania, USA). The chemical status of each substrate was confirmed before cultivation and is presented in Table 2.
Results and Discussion
Control Environment in the Small Smart Greenhouse
The key environmental variables affecting lettuce growth, such as temperature, humidity, light intensity, and CO2 concentration, were measured (Fig. 2). In the controlled environment of the small smart greenhouse, temperature and humidity were maintained within the ranges of 21-34°C and 21-69%, respectively. The average temperature was 27.24°C, and the average humidity was 37.6%. Regarding light intensity, the maximum value of 523 lux and the minimum value of 0 lux were recorded from 01:00 to 08:00 when the LED lights were off. Even during the hours when the LED lights were off, some light intensity was still measured. This was likely attributable to the transparent structure of the small smart greenhouse and the arrangement of the experimental setup, allowing ambient light from the surroundings to enter the interior. When the LED lights were on, a maximum light intensity of 7,267 lux was recorded. The CO2 concentration ranged from a minimum of 432 ppm to a maximum of 1,539 ppm, with an average value of 612 ppm. This is considered to be within the optimal range for lettuce growth, which is typically between 350 and 1000 ppm (Kwon et al., 2013).
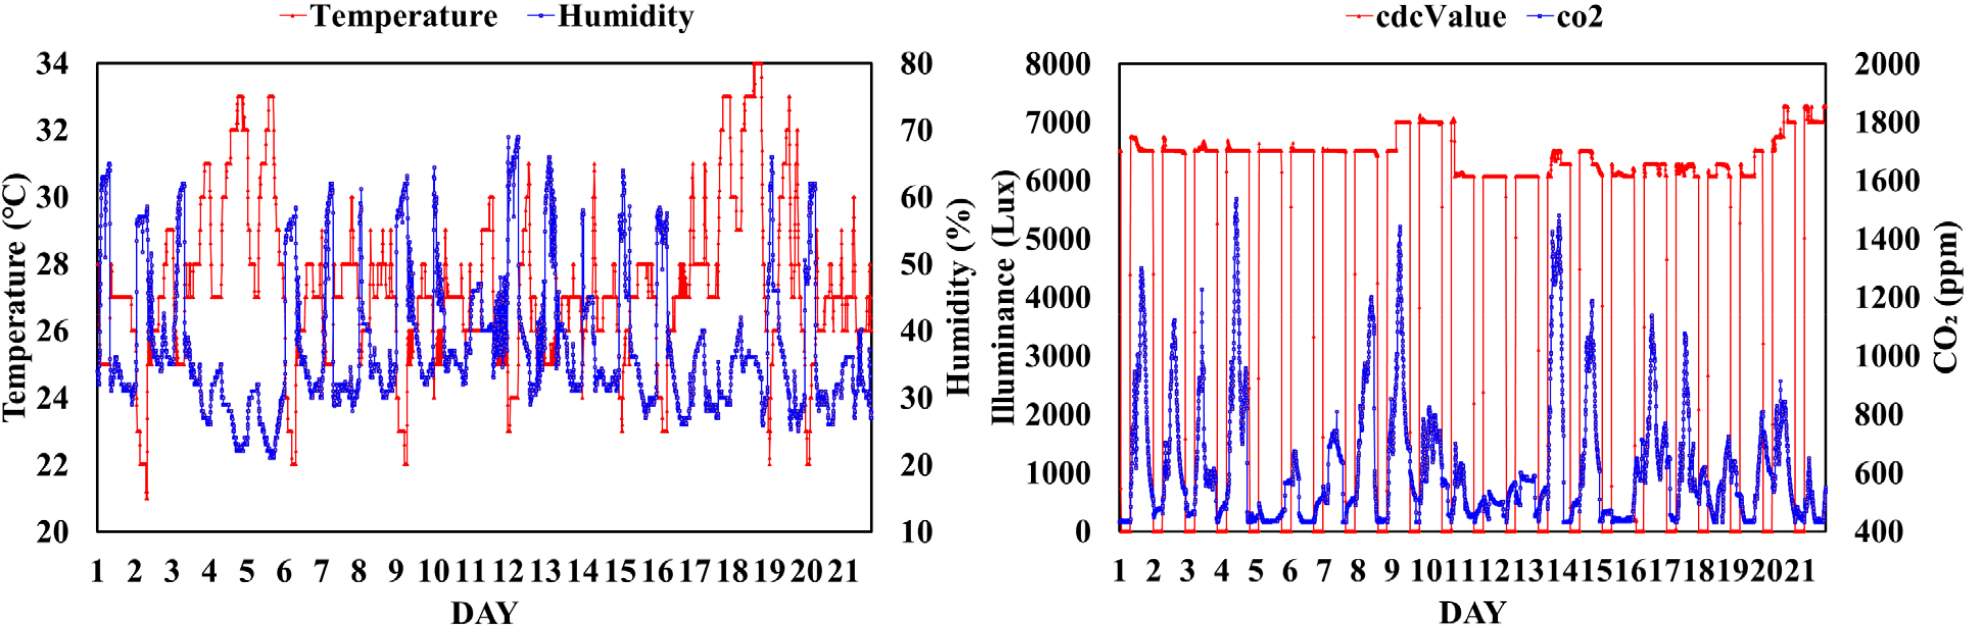
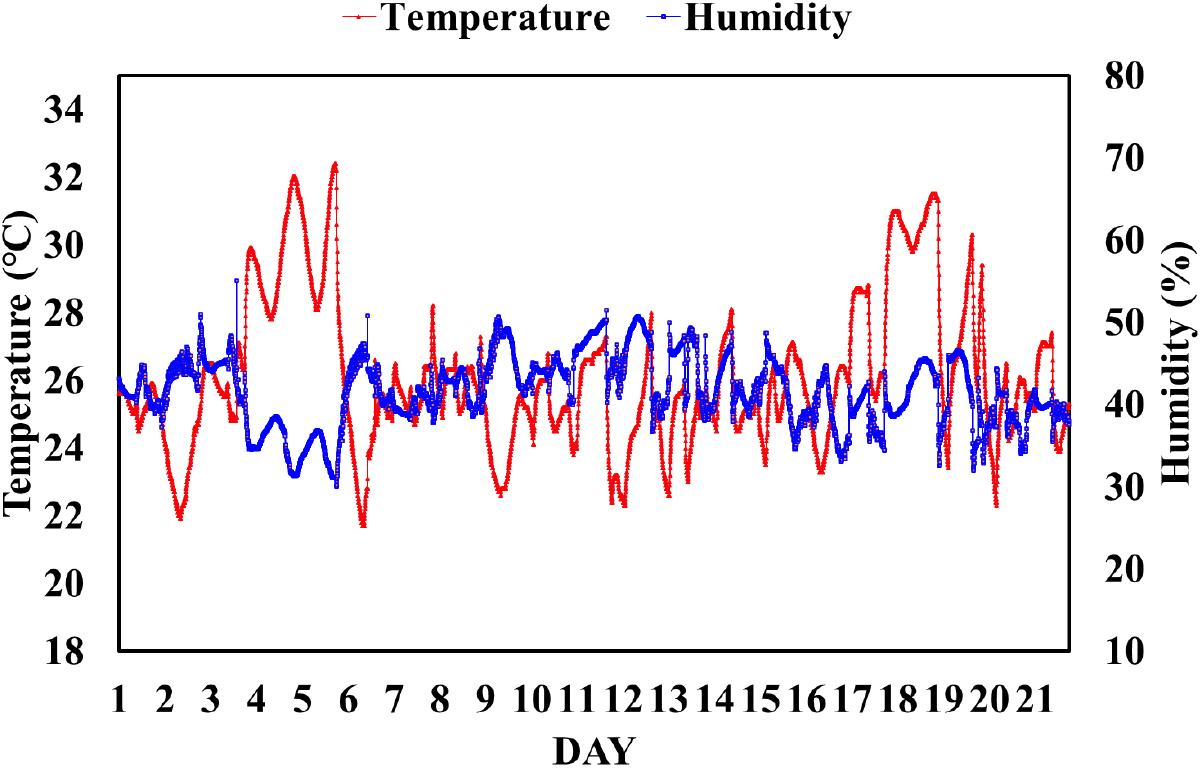
Fig. 3 shows the changes in external temperature and humidity. The external temperature ranged from 21 to 32°C, and the humidity ranged from 30 to 50%, with average values of 26.06°C and 41.54%, respectively. A comparison of the average values revealed that the internal temperature of the small smart greenhouse was about 4.53% higher than the external temperature while the internal humidity was about 10.48% lower than the external humidity. The higher internal temperature compared with the external temperature can be attributed to the heat emitted by the LED lights, which operated for 16 hours, accumulating heat in the enclosed space and limiting heat loss to the outside. Meanwhile, as the fan operated based on changes in temperature and humidity, high-humidity internal air was expelled, and relatively dry external air entered. This process, combined with the higher internal temperature, likely contributed to the observed lower internal humidity compared with the external humidity.
Lettuce Germination Rate Verification
Fig. 4 shows the lettuce germination rates, with various trends observed depending on the treatment group and experimental time points. CO demonstrated the best performance, with a germination rate of over 90% in both the initial and second growing periods. In the third growing period, however, the germination rate decreased, showing a relatively low value. This suggests that while treatments such as biochar can improve the physical properties of the substrate and increase germination rates initially, over time, increased microbial activity could lead to nitrogen depletion or nutrient competition, a result consistent with previous studies (Spokas et al., 2012; Sun et al., 2024).
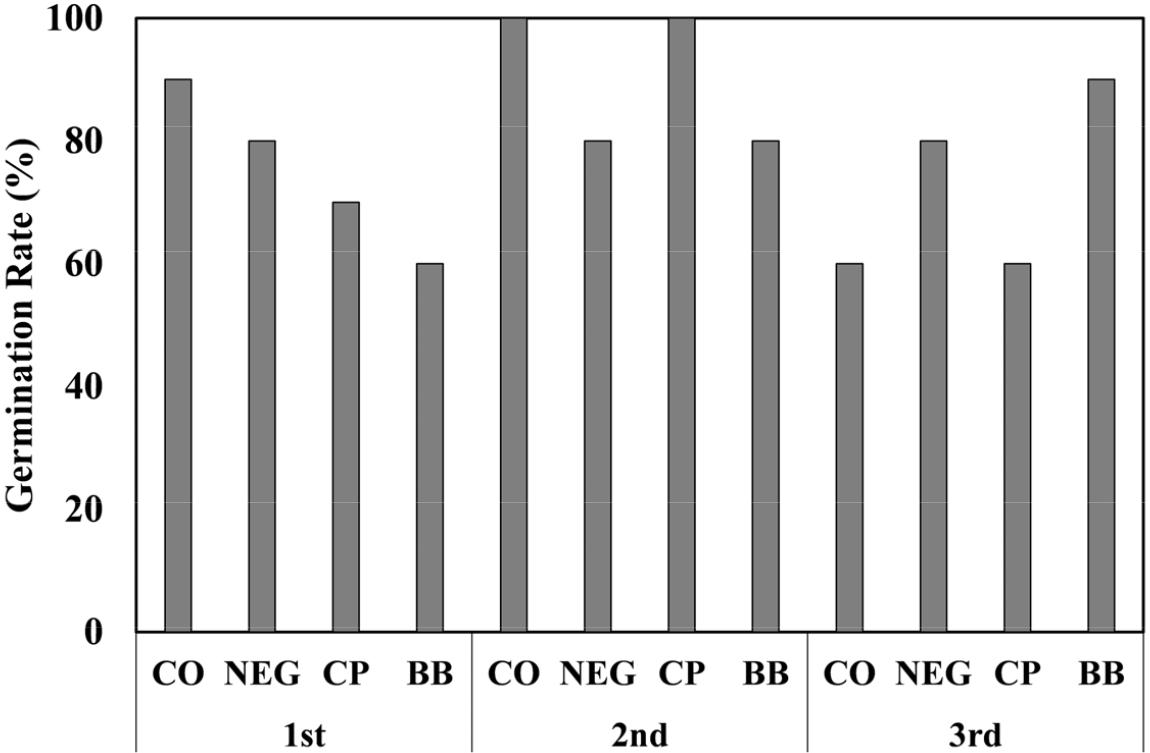
Meanwhile, the NEG group started with an initial germination rate of about 80% and then remained stable without significant fluctuations. The BB treatment group had a low initial germination rate of about 60%, but the germination rate gradually increased and showed a trend of improvement over time. This suggests that the biochar stabilized within the substrate over time, and the initial nitrogen depletion was alleviated, leading to improved germination rates (Jeffery et al., 2017).
In the case of CP, the initial germination rate was about 70%, but it decreased over time and recorded the lowest germination rate of about 60% during the third growing period. This suggests that initially, there might be no significant difference in crop growth or germination rate when applying biochar to the substrate. Over the long term, however, the chemical properties of the substrate improve, which has been reported to positively affect crop growth (Jang et al., 2018).
In conclusion, it is difficult to assert that biochar has a direct impact on germination rates or initial growth. Short-term changes in the germination rate are likely closely related to changes in soil nutrients.
Changes in Lettuce Growth
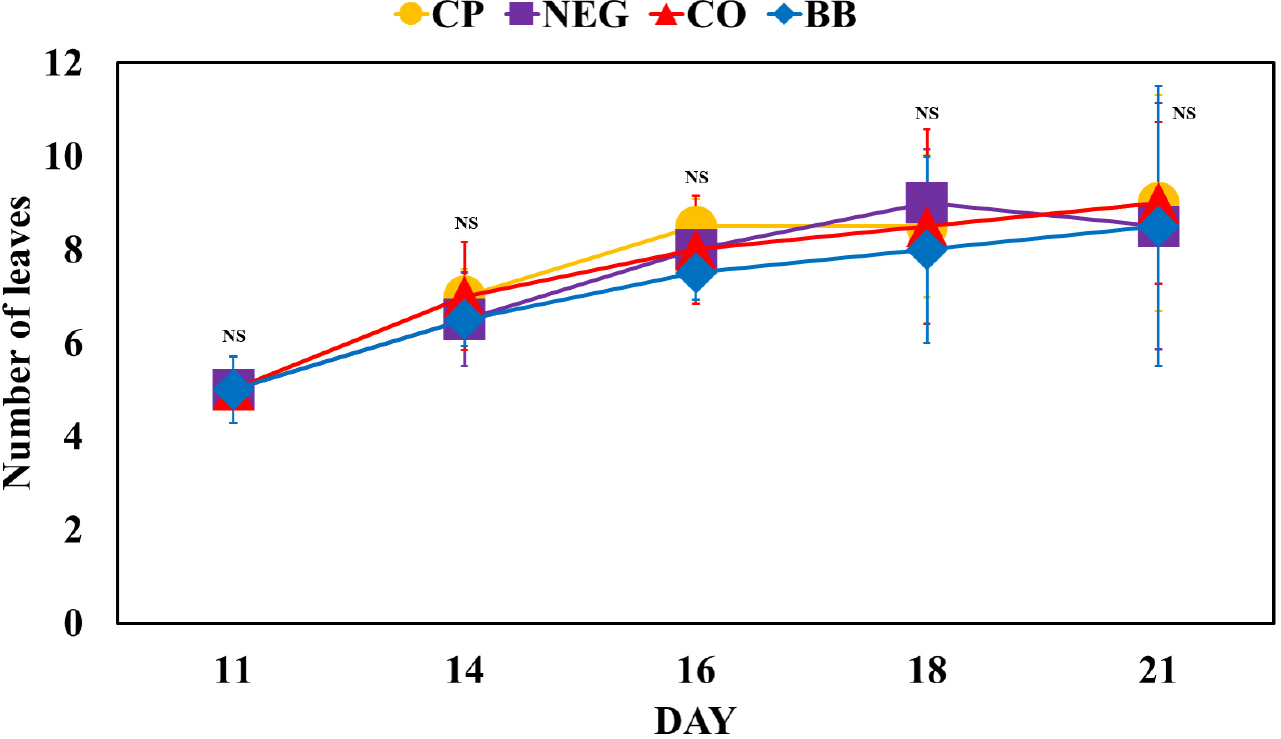
Figs. 5 and 6 present the average values for variations in lettuce length and width from the three cultivation experiments, respectively. Fig. 7 illustrates the changes in the number of lettuce leaves. A general increasing trend in lettuce length, width, and leaf count was observed across all treatment groups over time.
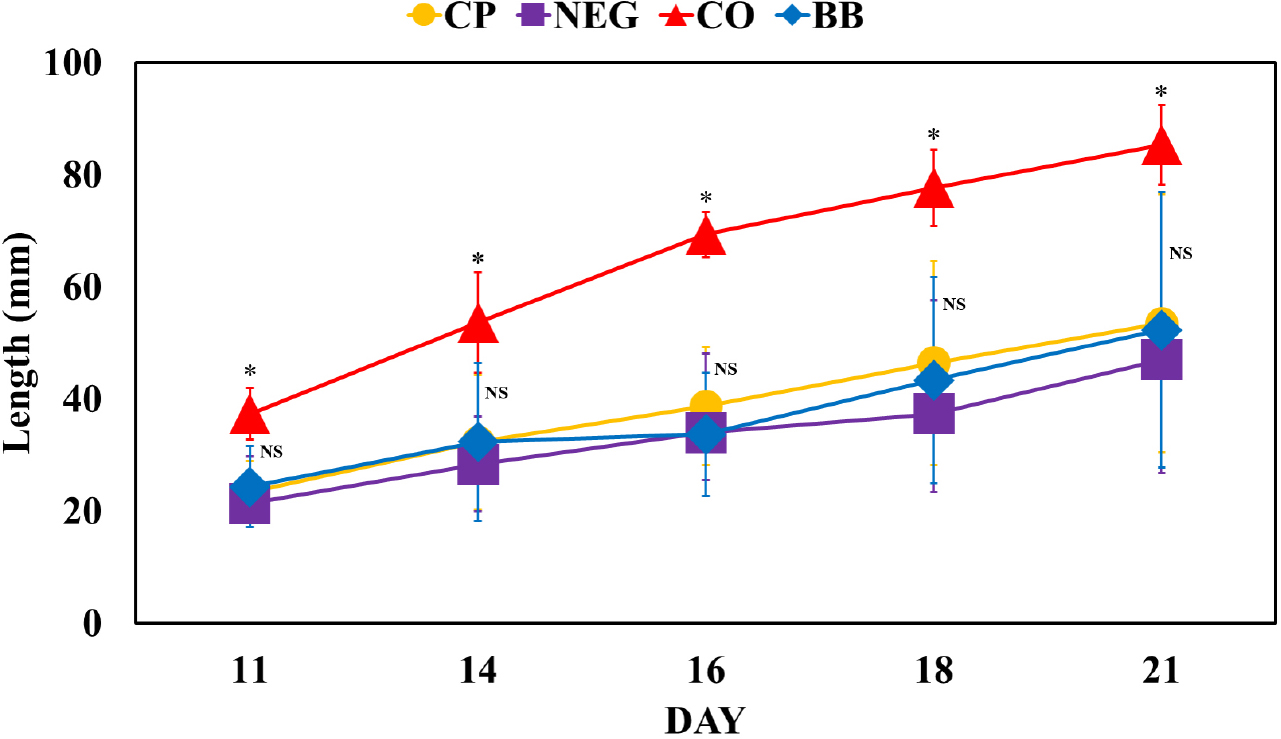
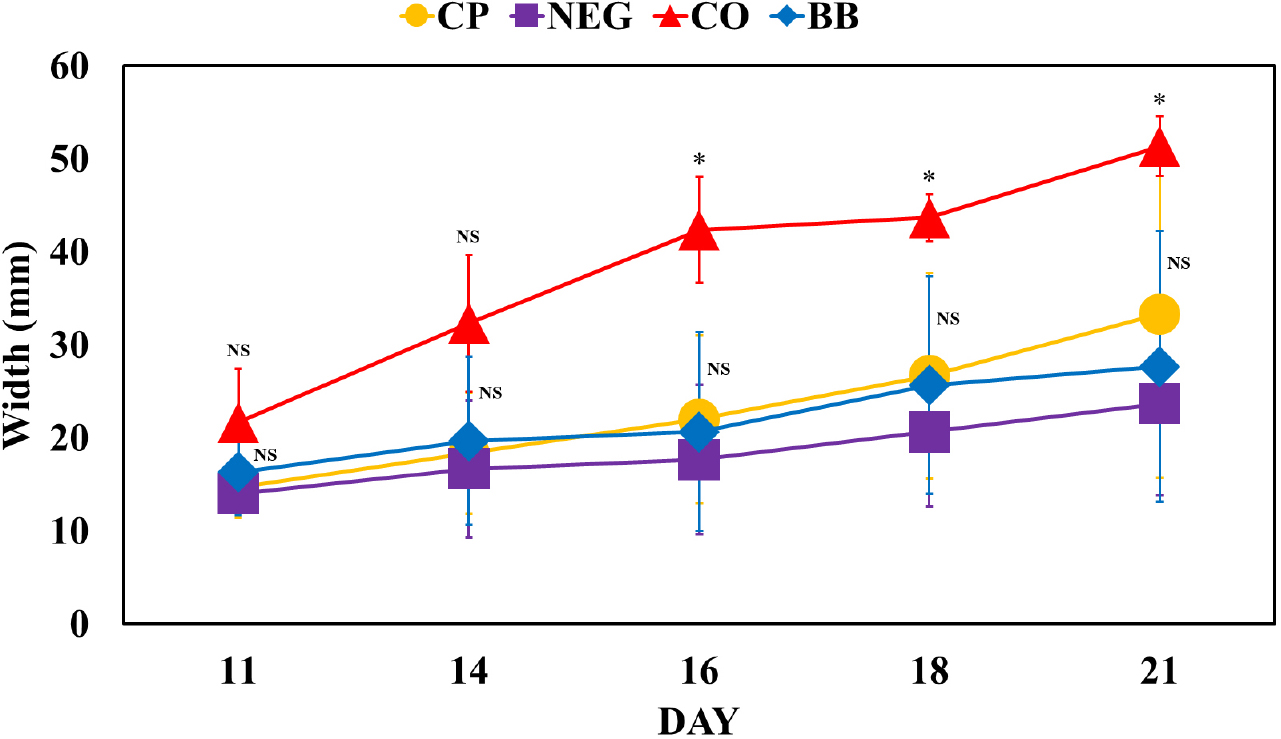
In terms of length variation, the CO group exhibited the most vigorous growth at all time points, reaching a lettuce length of 84 mm on day 21, which was significantly higher than that of the other treatment groups (Fig. 5). The BB group exhibited a steady increase in growth, reaching 52 mm on day 21. The CP group initially showed growth similar to that of the NEG group, recording approximately 30 mm. However, its growth improved over time, reaching 53 mm on day 21, demonstrating a difference of about 10 mm compared with the NEG group. By contrast, the NEG group exhibited the lowest growth across all time points, with a length of 45 mm on day 21. Nevertheless, t-test results indicated no statistically significant differences among the NEG and the other biochar treatment groups, except for the CO group. A similar trend was observed in width variation (Fig. 6). On day 11, the CO group recorded a width of 25 mm, showing a difference of more than 10 mm compared with the other treatment groups. As time progressed, this difference became more pronounced. On day 21, the CO group exhibited the highest leaf width, reaching 51 mm, while the BB, CP, and NEG groups recorded 28 mm, 33 mm, and 24 mm, respectively. Similar to length variation, the BB and CP groups showed a steady increase, whereas the NEG group exhibited a relatively lower width increase. Additionally, no statistically significant difference was observed between the CO 0.05% treatment group and the NEG 0.05% treatment group on days 11 and 14. However, statistical significance was confirmed on days 16, 18, and 21. No significant differences were observed among the other treatment groups.
In terms of leaf count variation, all treatment groups showed an increasing trend in leaf number over time. However, no statistically significant differences were observed between the treatment groups (Fig. 7).
In this study, some differences were observed in the increases in length and width between the biochar treatment groups and the NEG group. However, excluding the CO treatment group, no statistically significant differences were found between the NEG and biochar treatment groups. While the CO treatment group showed relatively higher growth values, the growth enhancement effect was not pronounced in the other biochar treatment groups. This suggests that while biochar might have an immediate effect on short-term crop growth, the magnitude of its effect could vary depending on interactions with environmental changes within the substrate.
Changes in Crop and Substrate Weight
Fig. 8 presents the changes in crop and substrate weight. Weight changes in the crop and substrate were analyzed by comparing the biochar treatment groups with the NEG group over the cultivation period. In Fig. 8, all treatment groups display a typical pattern of weight increase immediately after watering, followed by a decrease. The biochar treatment groups generally show a positive effect on lettuce growth compared with the NEG group.
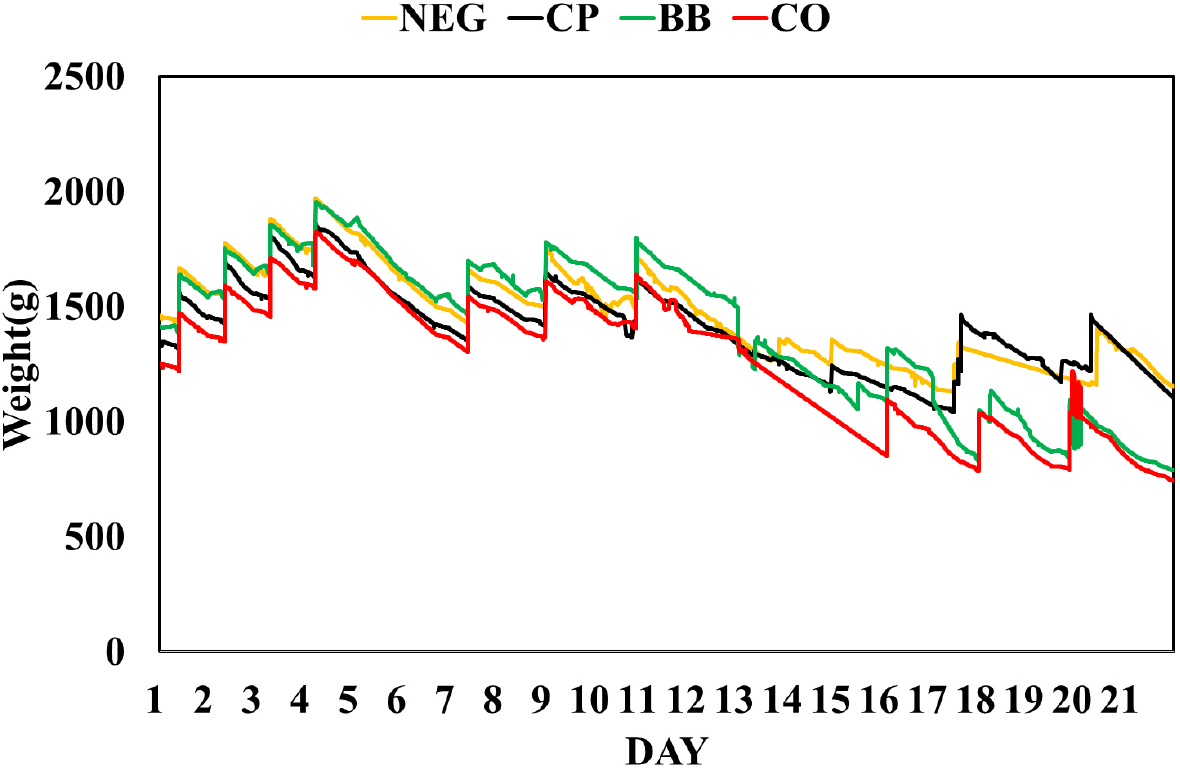
In the early stages of cultivation, the CP and NEG groups exhibited a lower rate of water loss compared with CO and BB, indicating that the substrate’s water retention capacity was relatively better during the initial phase. However, as cultivation progressed, CO and BB showed a faster rate of water loss than CP and NEG. This was likely due to more active lettuce growth in CO and BB, leading to increased transpiration and accelerated water loss. In particular, CO, with its higher growth rate, showed faster water consumption. This trend was similarly observed in other cultivation periods.
Elemental Analysis of Substrate
Fig. 8 shows the results of the elemental analysis of the substrate after biochar was applied. CO maintained a high carbon content of 24 ± 3% throughout all cultivation periods, resulting in the largest increases in lettuce leaf length and width. The high organic carbon content of CO is believed to have enhanced the organic matter concentration in the substrate, improving the root environment and facilitating nutrient absorption by the lettuce.
CP showed an increase in leaf length and width compared with NEG in the early cultivation period. Fig. 9 shows the results of the elemental analysis of the substrate after biochar was applied. CO maintained a high carbon content of 24±3% throughout all cultivation periods, resulting in the largest increases in lettuce leaf length and width. The high organic carbon content of CO is believed to have enhanced the organic matter concentration in the substrate, improved the root environment, and facilitated nutrient absorption by the lettuce.
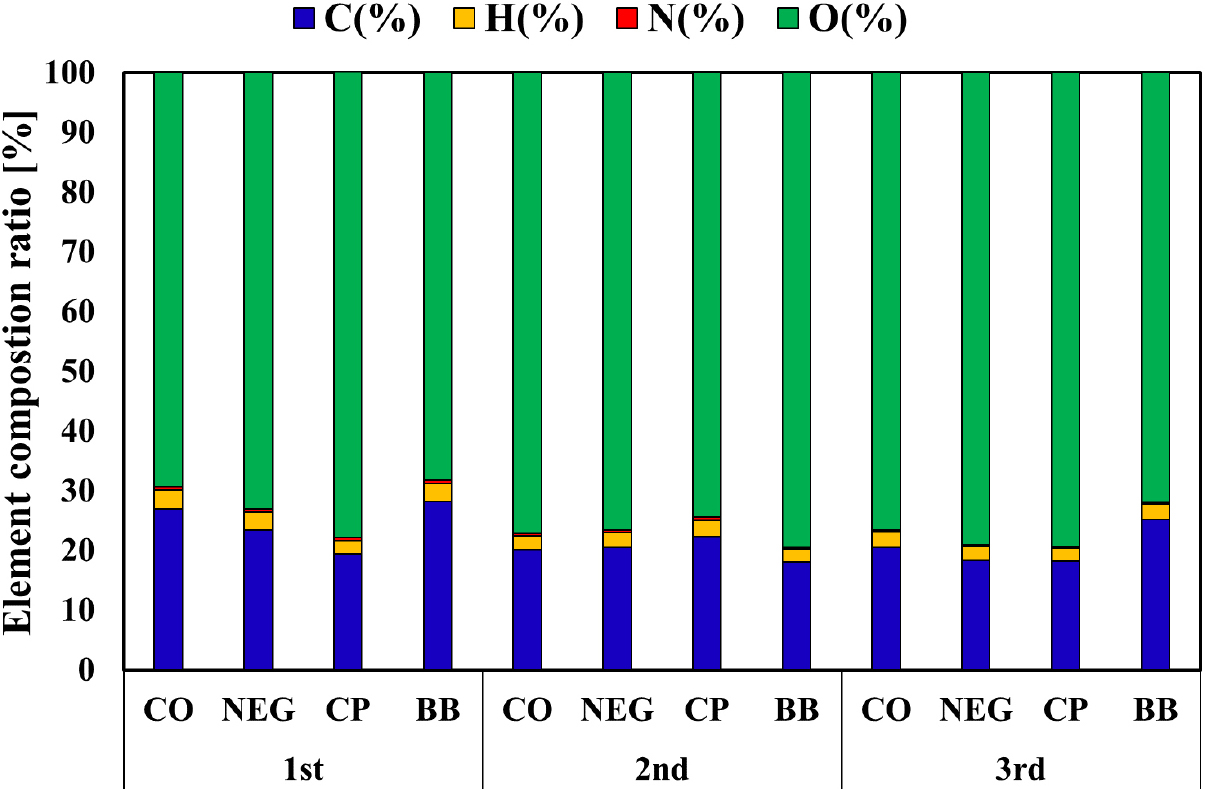
CP and BB showed similar growth results on average, with BB maintaining the highest carbon content of 25 ± 3%, which contributed to stable increases in leaf length and width. The high carbon content of BB is believed to have improved the substrate structure (Woo et al., 2013), resulting in slightly better growth compared with CP. CP showed an increase in leaf length and width compared with NEG in the early cultivation period, but owing to its carbon content of 20 ± 2%, the substrate structure improvement effect was limited, and its long-term growth results were similar to those of BB. Although the carbon content of NEG was higher than that of CP, the increase in lettuce leaf length and width was the lowest, indicating that its effect on lettuce growth was minimal compared with the biochar treatment groups.
Chemical Analysis of Substrate
Fig. 10 shows the results of the chemical analysis of the substrate according to the type of biochar. After completing three cultivation cycles, the substrate was analyzed, and the CO treatment initially exhibited low CEC values. In the second measurement, however, it recorded the highest CEC value, indicating a significant increase in its cation retention capacity. This suggests that while CO initially had a minimal effect, its decomposition and stabilization process improved the substrate’s characteristics, providing favorable conditions for crop growth. The pH and EC values of CO remained relatively stable. It is believed that this stable substrate environment contributed to the significant growth differences in lettuce length and width compared with the other treatment groups.
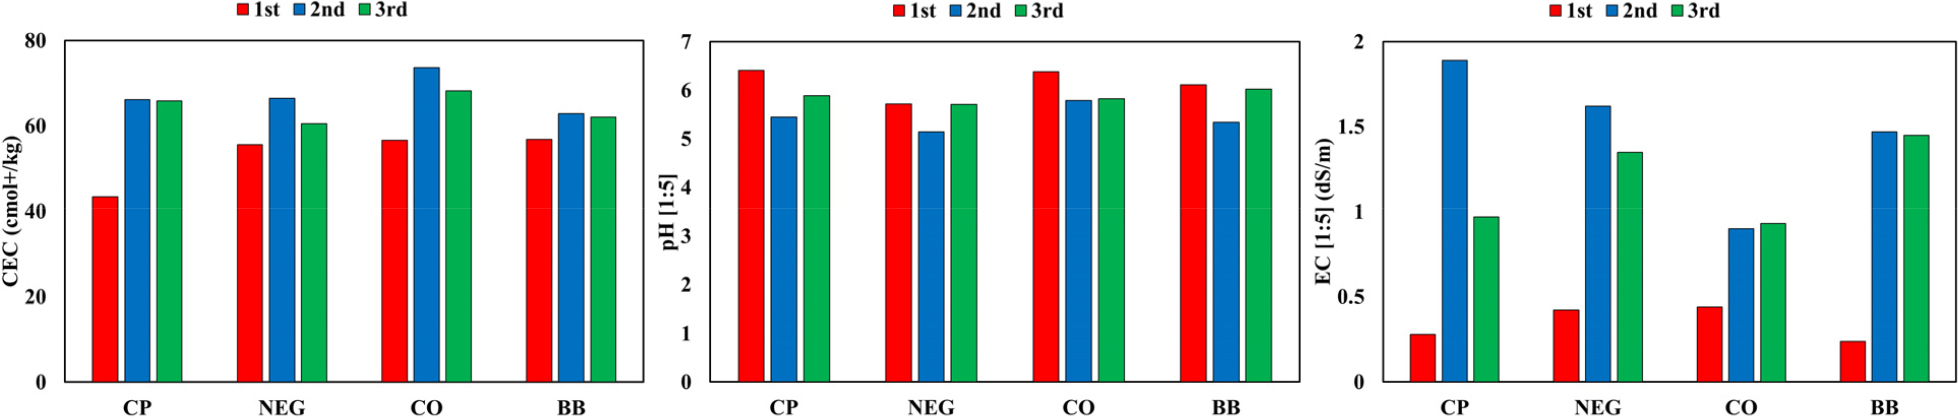
BB maintained stable CEC, pH, and EC values at all stages, confirming its suitability as a material for long-term nutrient supply and substrate environmental stability. However, lettuce growth in the BB group was slightly lower compared with the CO treatment group.
CP initially exhibited low CEC values but gradually increased over time, suggesting a potential medium-term substrate improvement effect. The pH of CP remained stable while the EC value sharply increased during the second cultivation cycle and then decreased, indicating a temporary rise in salinity levels. As a result, the length and width of the lettuce showed a gradual increase.
NEG recorded low CEC and pH values and high EC values at all stages, resulting in the lowest growth levels in lettuce. This suggests that biochar treatment helps improve substrate fertility and chemical stability. The initial pH and EC values of the NEG treatment group were not problematic enough to directly affect crop growth; however, the influence of biochar on pH and EC was found to be limited. Despite this, the pH of NEG was relatively low, indicating a clear tendency for substrate acidification, while the EC value remained high from the beginning, reflecting the negative effect of salt accumulation.
These findings indicate that biochar regulates the chemical environment of the substrate to provide optimal conditions for crop growth. In particular, CO was found to be effective for improving acidic substrates and controlling salinity levels.
Conclusion
In this study, biochar made from unused agrobyproducts, including cocopeat, bamboo, and coffee waste, was applied to the substrate, and changes in lettuce growth and substrate characteristics were analyzed. Examining the growth differences between the biochar treatment groups and the NEG group in the controlled environment of a small smart greenhouse, the CO treatment group exhibited the largest increases in lettuce length and width, with statistically significant differences confirmed. Specifically, the CO treatment group consistently showed significantly higher growth values compared with the other treatment groups throughout the experimental period (p < 0.05), and statistical significance was confirmed. CO created a favorable environment for crop growth through its high carbon content, increased CEC, and stable pH and EC.
In terms of germination rate, the CO treatment group recorded high values in the early and middle stages but showed a declining trend over time. The BB treatment group exhibited a gradual increase in germination rate as time progressed. The CP treatment group showed an initial growth-promoting effect; however, due to fluctuations in salinity levels, its long-term effect was limited. The NEG treatment group showed the lowest growth results.
All biochar treatment groups tended to increase the carbon content of the substrate and improve its chemical stability, with the effect being most pronounced in the CO treatment group. This was likely the result of CO increasing the organic matter content and improving the root environment, which in turn facilitated nutrient absorption by the crops.
This study confirmed that CO biochar can be used as an effective soil amendment for lettuce cultivation and that it can contribute to sustainable agriculture through the resource utilization of agrobyproducts. Furthermore, the use of biochar is expected to help improve crop productivity and address agrobyproduct issues.
In future research, it will be necessary to determine the optimal mixing ratio and application amount of biochar and to verify its practicality through field cultivation experiments beyond laboratory settings. Additionally, studies of carbon fixation capacity and carbon credit estimation should be conducted to evaluate the environmental and economic sustainability of biochar.
