


Introduction
Materials and methods
Plant material and storage conditions
Firmness, SSC, TA, SSC/TA, and color changes
Spectral data acquisition
Spectral preprocessing
PLSR model development and validation
Results and discussion
Changes in physicochemical quality and flesh color during ripening and cold storage
Spectral characteristics of ‘Hongyang’ and ‘Qihong’ red-fleshed kiwi fruits
VNIR spectra vs. reference analysis
Correlation among ripening parameters
Refined ripening index distribution
Conclusions
Introduction
Kiwifruit (Actinidia spp.) is a climacteric fruit that is typically harvested at physiological maturity and subsequently undergoes postharvest ripening to reach acceptable eating quality (Schroder and Atkinson, 2006). During ripening, starch is converted into soluble sugars, fruit softens due to cell wall modification, titratable acidity decreases, and the balance between soluble solids content (SSC) and titratable acidity (TA) shifts, which together determine consumer-perceived quality (Choi et al., 2022; Pareek, 2016). Because ripening behavior varies substantially among cultivars, the timing required to reach the “ready-to-eat” stage differs, making accurate evaluation of ripening status essential for postharvest handling and marketing (Park et al., 2026; Tilahun et al., 2020; Yan et al., 2022).
Conventional quality assessment of kiwifruit relies largely on destructive measurements such as firmness testing, chemical analysis of SSC and TA, and subjective visual inspection. These approaches are labor-intensive, time-consuming, and unsuitable for rapid or continuous monitoring during storage and distribution, thereby limiting their commercial applicability (Lee et al., 2025). The need for objective, rapid, and non-destructive techniques is particularly important for red-fleshed kiwifruit cultivars, which often show cultivar-specific physicochemical characteristics and heterogeneous ripening patterns.
Visible and near-infrared (VNIR) spectroscopy has been widely explored as a non-destructive method for fruit quality evaluation because spectral signals can reflect both chemical composition and structural properties (Lee et al., 2012; Wang et al., 2015). Previous studies demonstrated that VNIR reflectance spectroscopy combined with partial least squares regression (PLSR) can successfully predict SSC, firmness, and acidity in kiwifruit across wide wavelength regions (Lee et al., 2012; Tilahun et al., 2018). However, most studies have used broad spectral ranges or mixed cultivar datasets, while relatively few have focused on cultivar-specific modeling of red-fleshed kiwifruit within the 400-1100 nm range commonly available in portable commercial spectrometers. Moreover, independent external validation under standardized postharvest ripening conditions has rarely been performed, limiting practical deployment of existing models.
Therefore, the present study aims to develop and validate VNIR-based PLSR models for predicting ripening stage and major quality attributes—firmness, SSC, TA, SSC/TA ratio, and color parameters (L*, a*, b*)—in the red-fleshed kiwifruit cultivars ‘Hongyang’ and ‘Qihong’. Spectral preprocessing strategies were compared, and model robustness was assessed through calibration, cross-validation, and independent external validation using separate cold-stored batches after ripening at ambient conditions (22°C, 70% RH). This work provides cultivar-specific prediction models within the practical 400-1100 nm spectral window, contributing to real-time quality monitoring and decision support in commercial postharvest systems.
Materials and methods
Plant material and storage conditions
Red kiwifruits produced in Andeok, Seogwipo, Jeju, Republic of Korea were used in this study. Two commercially prevalent cultivars, ‘Hongyang’ and the ruby gold kiwifruit ‘Qihong’, were evaluated to develop maturity index prediction models. To generate calibration data spanning a wide maturity range (underripe to overripe), fruits were stored at ambient temperature (22°C and 70% RH) for 10 d (3 d during ethylene treatment with ethylene (100 µL L-1), and for 7 d after ethylene treatment, and measurements were performed at 2 d intervals. To prepare an independent test set for external validation, additional fruits were stored under cold storage conditions (0°C and 90% RH) and evaluated at 30-d intervals over a total storage period of 90 d. For model development, spectral variables served as independent variables, while firmness, soluble solids content (SSC), titratable acidity (TA), SSC/TA ratio, and internal flesh color parameters were used as dependent variables.
Firmness, SSC, TA, SSC/TA, and color changes
Kiwifruit firmness was determined using a rheometer (Sun Scientific Co. Ltd., Tokyo, Japan). Each fruit was punctured at the equatorial region using a flat-ended stainless-steel probe (3 mm diameter) under a maximum load of 10 kg, and four readings were recorded per fruit following the procedure described by Choi et al. (2019). Soluble solids content (SSC) and titratable acidity (TA) were analyzed following the method of Tilahun et al. (2017). SSC was measured at 20°C using a digital refractometer (Atago Co. Ltd., Tokyo, Japan), and the results were expressed as percentage. For TA determination, kiwifruit juice was diluted with distilled water at a ratio of 1:19 (v/v), and the diluted solution was titrated with 0.1 N NaOH to an endpoint of pH 8.1 using a DL22 food and beverage analyzer (Mettler Toledo Ltd., Zurich, Switzerland). Titratable acidity was expressed as mg citric acid equivalent per kg fresh weight. The SSC/TA ratio was calculated as the quotient of SSC divided by TA, as previously reported by Choi et al. (2019). Color attributes of the kiwifruit were evaluated using a CR-400 Chroma Meter (Minolta, Tokyo, Japan). Measurements of lightness (L*), redness (a*), and yellowness (b*) were obtained for each cultivar according to the method outlined by Tilahun et al. (2017).
Spectral data acquisition
Spectral measurements were obtained using a USB4000 VNIR spectrometer (Ocean Optics Inc., Dunedin, FL, USA) equipped with a 5 W, 12 V tungsten—halogen light source (OSRAM, München, Germany). Reflectance/interactance spectra were collected in the 400-1100 nm range with an integration time of 10 ms following the approach described by Schaare and Fraser (2000). Each fruit was scanned at four equatorial positions spaced 90° apart, and the averaged spectrum was used for analysis. Two independent datasets were prepared for model calibration and external prediction. The calibration dataset consisted of ethylene-treated fruit sampled repeatedly during short-term ripening, whereas the prediction dataset comprised fruit collected during long-term cold storage. Detailed sampling conditions are summarized in Table 1.
Table 1
Dataset configuration of ‘Hongyang’ and ‘Qihong’ red-fleshed kiwifruits
Spectral preprocessing
Raw spectra included variability related to scattering, instrumental noise, and baseline shifts that were unrelated to chemical composition. To reduce these effects and enhance relevant spectral features, various preprocessing approaches were applied. For comparison, both unprocessed raw spectra and spectra preprocessed using mean normalization, standard normal variate (SNV), multiplicative scatter correction (MSC), and the Savitzky-Golay derivative filtering were evaluated (Lee et al., 2025). Savitzky—Golay derivatives were applied using a window length of 11 and standard polynomial and derivative settings implemented in the preprocessing software.
PLSR model development and validation
Prediction models were developed using partial least squares regression (PLSR). All analytical procedures, including preprocessing, model training, and validation, were performed using Python (v3.8.20) with NumPy (v1.26.4), Pandas (v2.2.2), Scikit-learn (v1.5.1), and SciPy (v1.13.1) libraries.
The total spectral dataset was randomly divided in to calibration and internal prediction sets at an 8:2 ratio. The calibration set (80%) was used for calibration set, while the remaining 20% were used as the cross-validation set. In addition, to assess the practical applicability and generalizability of the model, external prediction was performed using an independent group of cold stored samples not included in the above data partitioning and training process.
The optimal number of latent variables (LV) was determined using 10-fold cross-validation on the calibration set. Cross validation error was examined as model complexity increased, and the number of components that produced the minimum root mean square error of cross-validation (RMSEV) was selected to minimize over fitting. Model performance was evaluated using the coefficient of determination (R2) and the root mean square error (RMSE), calculated as follows:
where n is the number of samples, is the reference value of the i-th sample, is the predicted value from the PLSR model, and is the mean of the reference values. Errors at each stage were reported as RMSEC (Calibration), RMSEV (Cross-validation), and RMSEP (Prediction), for comparative analysis.
Results and discussion
Changes in physicochemical quality and flesh color during ripening and cold storage
Both cultivars softened rapidly during ripening at ambient conditions (Fig. 1A). Firmness decreased sharply from 17.71 N in ‘Hongyang’ and 15.13 N in ‘Qihong’ at day 0 to 2.21 N by day 4 in both cultivars. The overall softening behavior was similar between ‘Hongyang’ and ‘Qihong’, with only minor cultivar differences at later storage days.
Flesh color also changed markedly with ripening (Fig. 1A). Lightness (L*) decreased steadily in both cultivars, decreasing from about 70-75 at day 0 to about 50 by day 10, indicating progressive darkening of the flesh. Redness (a*) increased (values became less negative), with ‘Qihong’ showing a more rapid changes during early storage days, whereas ‘Hongyang’ began at a higher a* and showed a more gradual increase over the storage days. In contrast, yellowness (b*) generally decreased throughout ripening in both cultivars.
Soluble solids content (SSC) increased with ripening in both cultivars (Fig. 1A). In ‘Hongyang’, SSC increased from 10.00 at day 0 to a maximum of 16.70% at day 8, followed by a slight decline to 16.11% at day 10. ‘Qihong’ consistently exhibited higher SSC, increasing from 12.69% at day 0 to 19.90% at day 8, and then decreasing to 17.95 at day 10. Titratable acidity (TA) declined during storage, with the most pronounced decrease occurring early in storage, followed by a more gradual change thereafter. In ‘Hongyang’, TA decreased from 1.22% at day 0 to 0.82% by day 10, whereas ‘Qihong’ declined from 2.20% to 1.39% over the same period.
Consistent with SSC patterns, the SSC/TA ratio increased substantially during ripening (Fig. 1A). In ‘Hongyang’, the ratio increased from 8.32 at day 0 to a maximum of 23.18 at day 6 and then gradually declined. In ‘Qihong’, the SSC/TA ratio increased more gradually from 5.84 at day 0 and reached its peak at day 8 (18.01). These coordinated changes, softening, sugar accumulation, acid loss, and color evolution are consistent with established kiwifruit ripening physiology and cultivar-dependent trajectories reported previously, including studies employing exogenous ethylene to accelerate ripening (Park et al., 2026; Tilahun et al., 2020).
The external validation dataset covered a broad ripening range during cold storage and showed coordinated changes in quality attributes for both cultivars (Fig. 1B). Firmness declined steadily in both cultivars, with ‘Qihong’ softening faster early and remaining softer than ‘Hongyang’ at comparable storage periods. Flesh color changed in parallel: L* decreased, a* increased, and b* declined, with ‘Qihong’ generally showing lower L* and more negative a* early, indicating a stronger color transition. SSC increased over time in both cultivars, while TA decreased, leading to a marked rise in the SSC/TA ratio; notably, ‘Qihong’ showed the sharpest early TA drop, which accelerated the SSC/TA increase. Overall, the prediction set reflects realistic, cultivar-dependent ripening dynamics as previously reported by Choi et al. (2019) for three different kiwifruit cultivars during cold storage, supporting its suitability for testing VNIR model transferability across different ripening stages and cultivars.
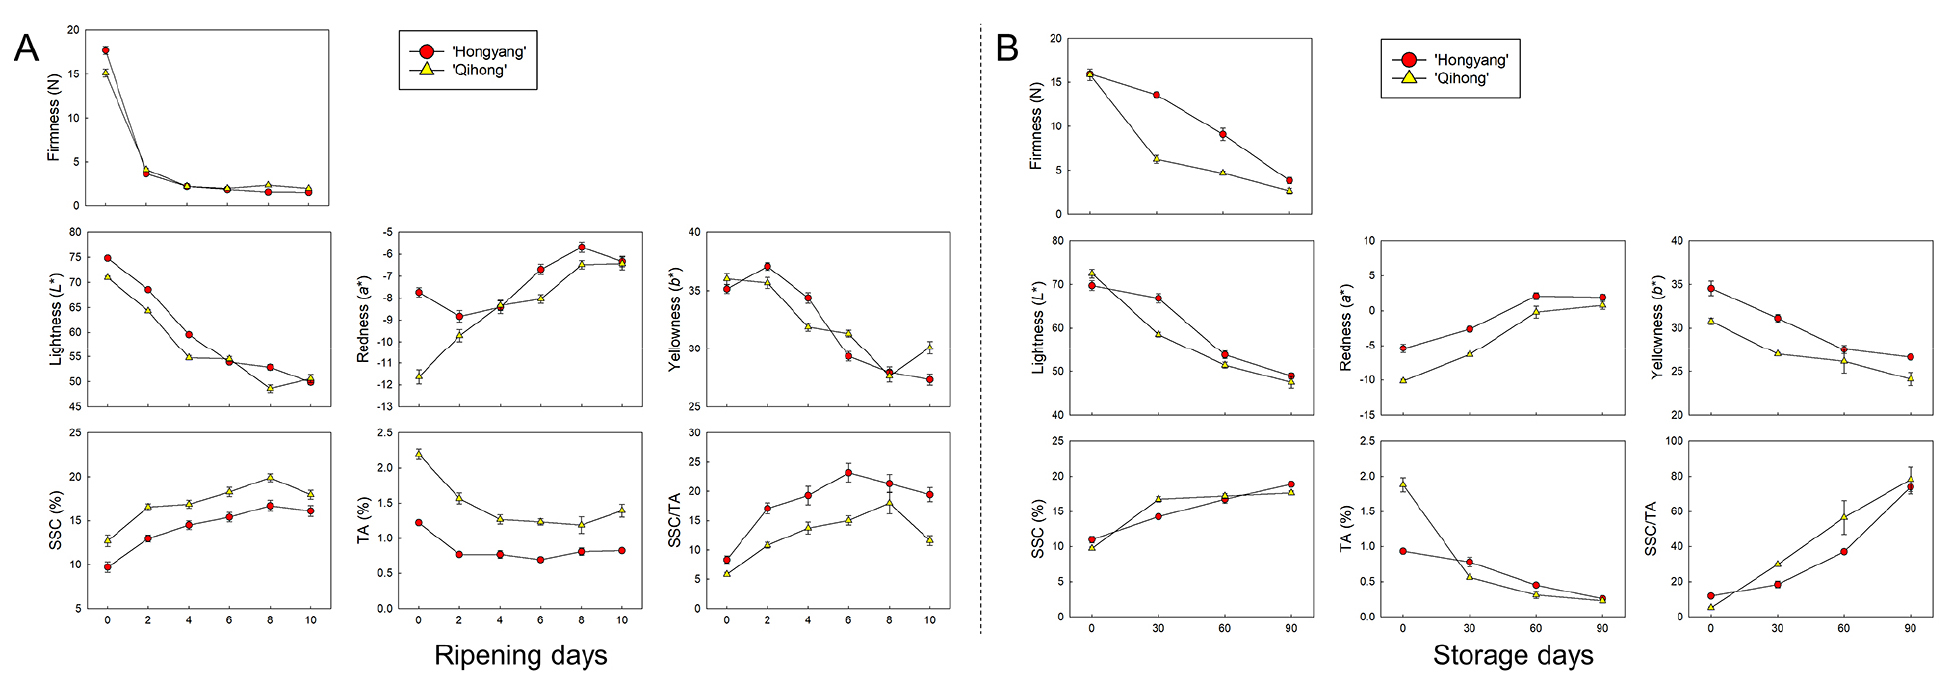
Fig. 1.
Changes in firmness, internal flesh color (L*, a*, b*), soluble solids content (SSC), titratable acidity (TA), and SSC/TA ratio of ‘Hongyang’ and ‘Qihong’ red-fleshed kiwifruits during ripening after ethylene treatment at ambient condition for 10 days (for calibration and cross-validation)(A), and during storage under cold storage conditions (0 °C and 90 % RH) for prediction (B). Values are reported as means with error bars.
Spectral characteristics of ‘Hongyang’ and ‘Qihong’ red-fleshed kiwi fruits
The two cultivars exhibited broadly similar V/NIR spectral profiles, showing comparable overall curve shapes across the 400-1100 nm range (Fig. 2). In both ‘Hongyang’ and ‘Qihong’, the raw spectra showed gradual variation in the visible region, followed by a pronounced intensity rise near the red—NIR transition (around ~700 nm) and a broad NIR region that gradually declined toward longer wavelengths; such patterns are typical of fruit VNIR measurements and are commonly analyzed using reflectance/interactance geometries to capture internal properties (Wang et al., 2015; Schaare et al., 2000). Across samples, the dominant differences in the raw spectra were mainly attributable to baseline offsets and light-scattering effects rather than changes in the overall spectral shape, consistent with the well-known influence of physical/sample-instrument interactions in diffuse spectroscopy (Chen et al., 2013; Wang et al., 2015).
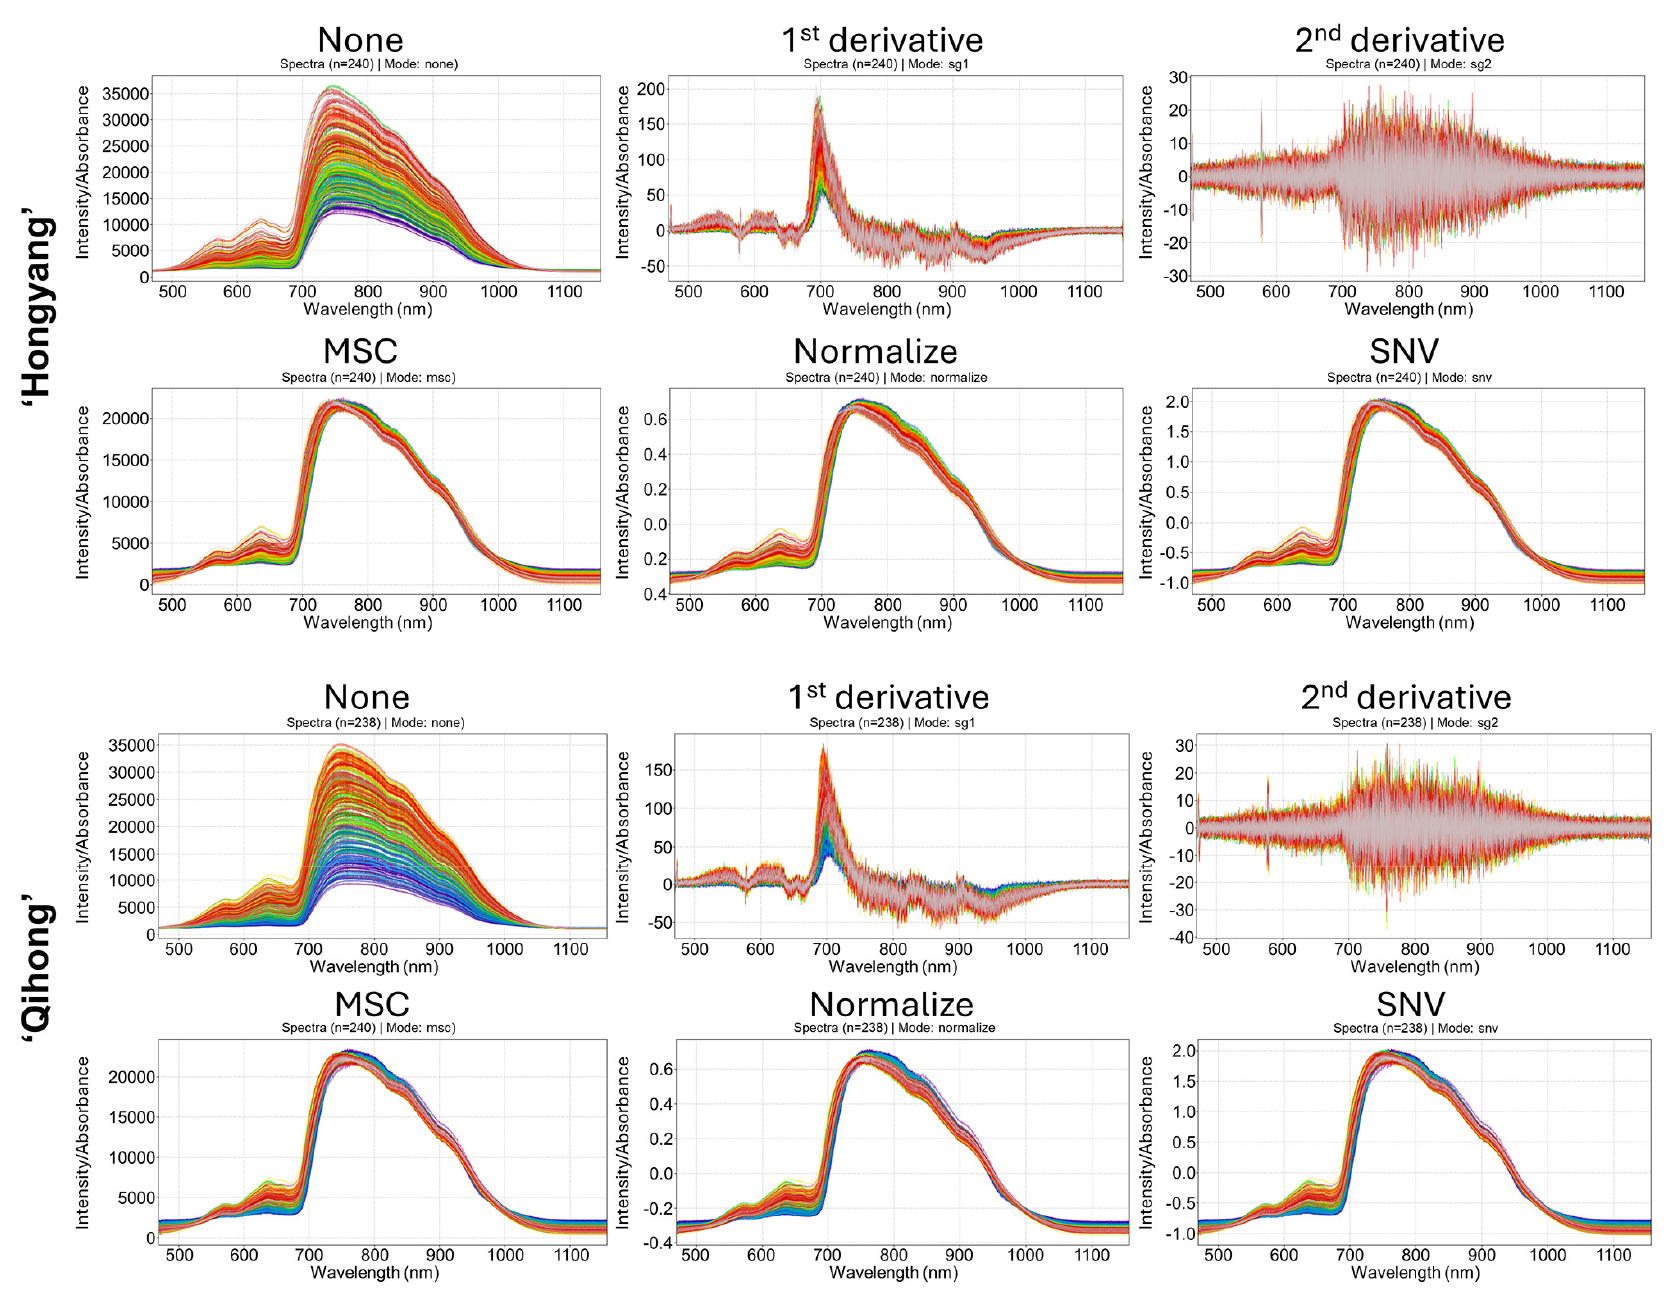
Fig. 2.
Raw and preprocessed V/NIR spectra (400-1100 nm) of ‘Hongyang’ and ‘Qihong’ red-fleshed kiwifruits. Spectra are shown as unprocessed (none) and after Savitzky-Golay first derivative, Savitzky-Golay second derivative, multiplicative scatter correction (MSC), mean normalization (normalize), and standard normal variate (SNV) preprocessing.
Despite the overall similarity, cultivar-dependent differences were evident in the magnitude and dispersion of spectral intensity, suggesting differences in tissue structure and light transport that can alter scattering behavior (Wang et al., 2015). In the raw spectra, both cultivars displayed substantial intensity spread, but ‘Hongyang’ tended to show a wider separation among spectra in the high-intensity region, whereas ‘Qihong’ appeared comparatively more compact, indicating slightly lower variability in raw signal magnitude.
Preprocessing reduced non-chemical variability in both cultivars: mean normalization, SNV, and MSC effectively corrected multiplicative and additive scattering effects and tightened the clustering of spectra for both ‘Hongyang’ and ‘Qihong’, improving comparability for multivariate modeling (Chen et al., 2013; Wan et al., 2024). Savitzky—Golay derivative preprocessing enhanced subtle spectral features by suppressing baseline trends, but higher-order derivatives also amplified high-frequency noise, an expected trade-off reported in VNIR preprocessing literature, particularly in wavelength regions with lower signal-to-noise ratio (Yang et al., 2022). Overall, the two cultivars shared similar underlying spectral structures, while differing mainly in raw intensity dispersion and the extent to which preprocessing, especially derivative methods, amplified noise, highlighting the importance of selecting preprocessing strategies that match cultivar-specific spectral variability.
VNIR spectra vs. reference analysis
VNIR-based PLSR models were developed to predict fruit firmness, SSC, TA, SSC/TA ratio, and internal flesh color parameters, and performance was assessed using calibration, cross-validation, and external prediction following established VNIR chemometric workflows for fruit quality evaluation (Schaare and Fraser, 2000). Model accuracy was quantified using the coefficient of determination (R2) and root mean square error (RMSE), consistent with standard reporting practice for VNIR-PLSR models (Lee et al., 2025; Baek et al., 2023).
For firmnesswas predicted with generally good accuracy in both cultivars (Fig. 3). Calibration performance was high, while validation results indicated moderate but acceptable generalization. ‘Hongyang’ showed relatively consistent performance across validation steps, whereas ‘Qihong’ exhibited a larger calibration—validation gap, suggesting greater sensitivity to sample variability or model complexity. Similar cultivar-dependent robustness differences have been reported in VNIR firmness prediction studies of intact fruit (Mishra et al., 2020).

Fig. 3.
PLSR prediction performance for firmness using V/NIR spectra in ‘Hongyang’ and ‘Qihong’ red-fleshed kiwifruits. Scatter plots show measured (actual) versus predicted values for calibration, 10-fold cross-validation (k = 10), and external prediction sets. The dashed line indicates the 1:1 relationship (y = x). Model statistics (R2 and RMSE) and the number of latent variables are displayed in each panel.
For SSC prediction was feasible for both cultivars, with strong calibration and moderate validation performance (Fig. 4). As observed for firmness, ‘Hongyang’ maintained slightly more stable prediction accuracy than ‘Qihong’, which showed a clearer calibration—validation discrepancy. The generally strong calibration fit for SSC agrees with earlier findings that soluble solids are among the most reliably predicted traits using VNIR spectroscopy in kiwifruit and other fruits (Slaughter and Crisosto, 1998). Reduced transferability across datasets, reflected in lower validation accuracy, is also consistent with reports highlighting population variability effects in VNIR models (Tian et al., 2023).
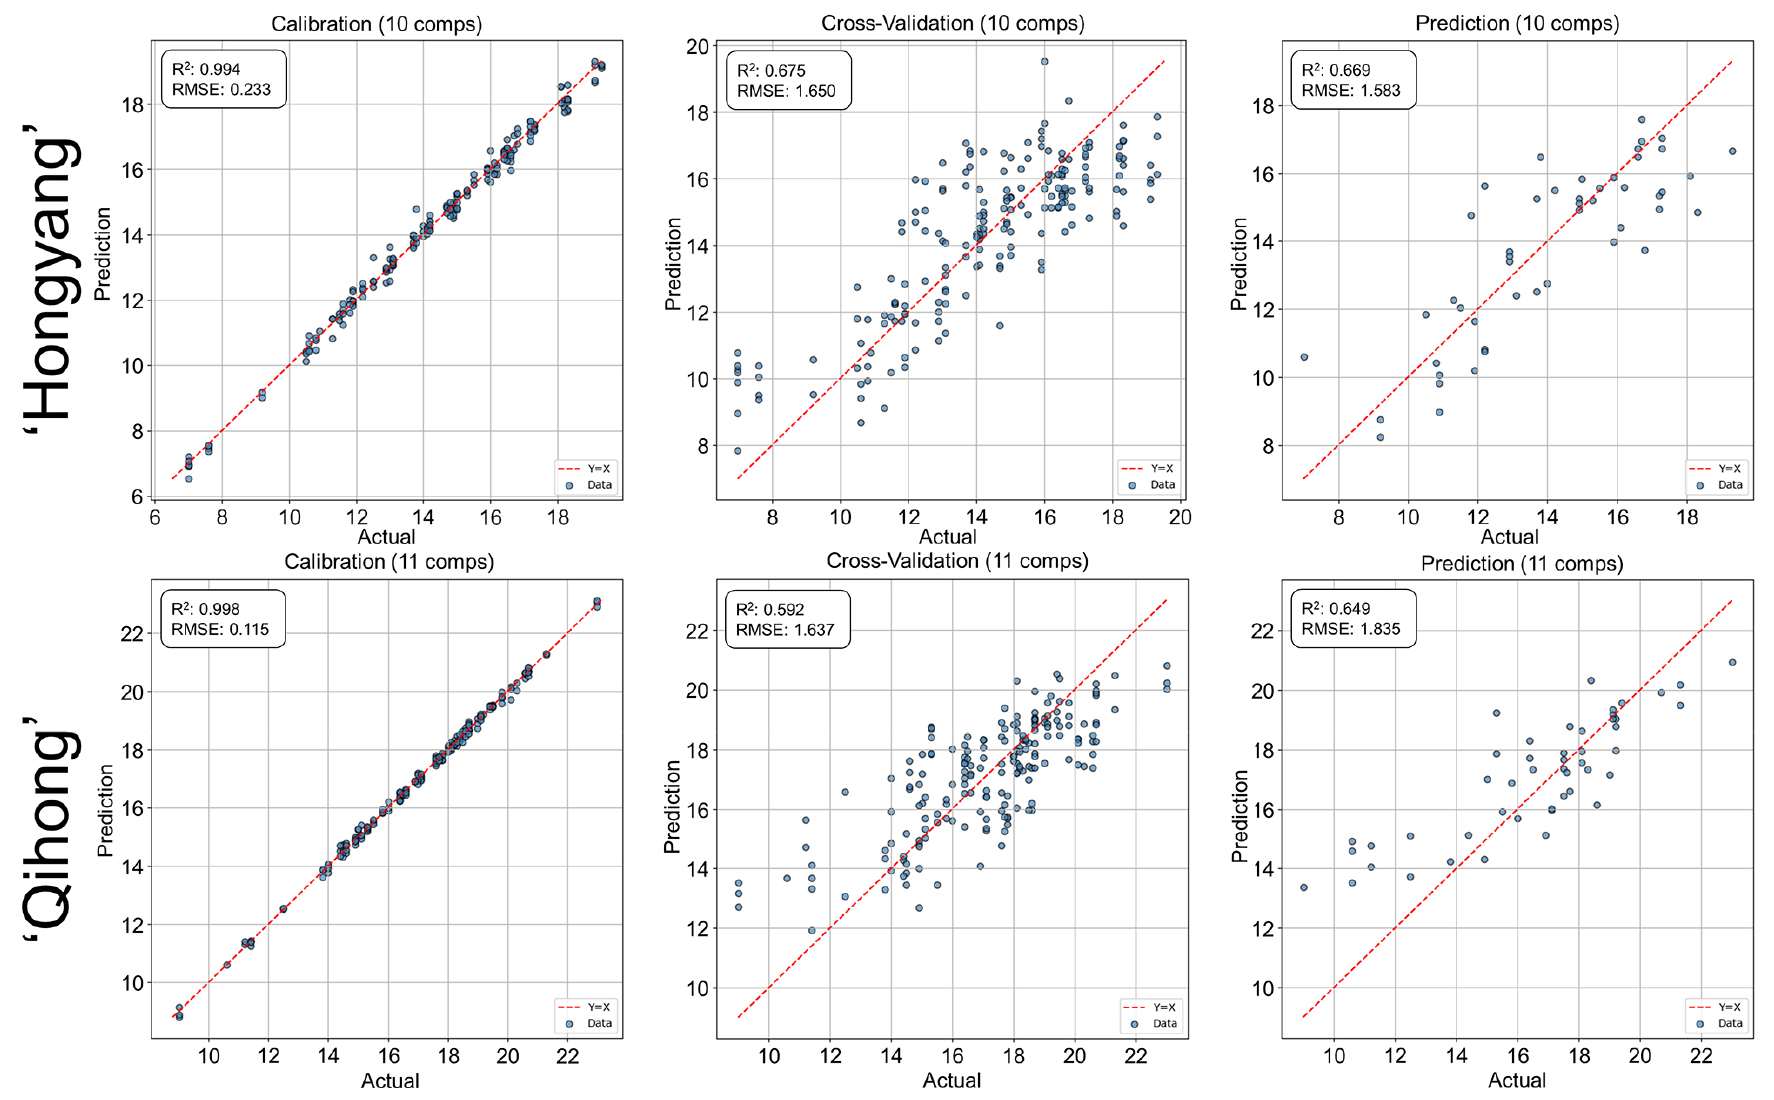
Fig. 4.
PLSR prediction performance for soluble solids content (SSC) using V/NIR spectra in ‘Hongyang’ and ‘Qihong’ red-fleshed kiwifruits. Scatter plots show measured (actual) versus predicted values for calibration, 10-fold cross-validation (k = 10), and external prediction sets. The dashed line indicates the 1:1 relationship (y = x). Model statistics (R2 and RMSE) and the number of latent variables are displayed in each panel.
TA prediction was less robust than firmness or SSC in both cultivars (Fig. 5). Although calibration fits were acceptable, validation accuracy declined substantially, indicating limited model generalization and a pronounced calibration—validation gap. Such behavior is frequently observed in portable VNIR systems, where acidity prediction is strongly influenced by sample heterogeneity, optical path differences, and indirect spectral associations (de Brito et al., 2022).
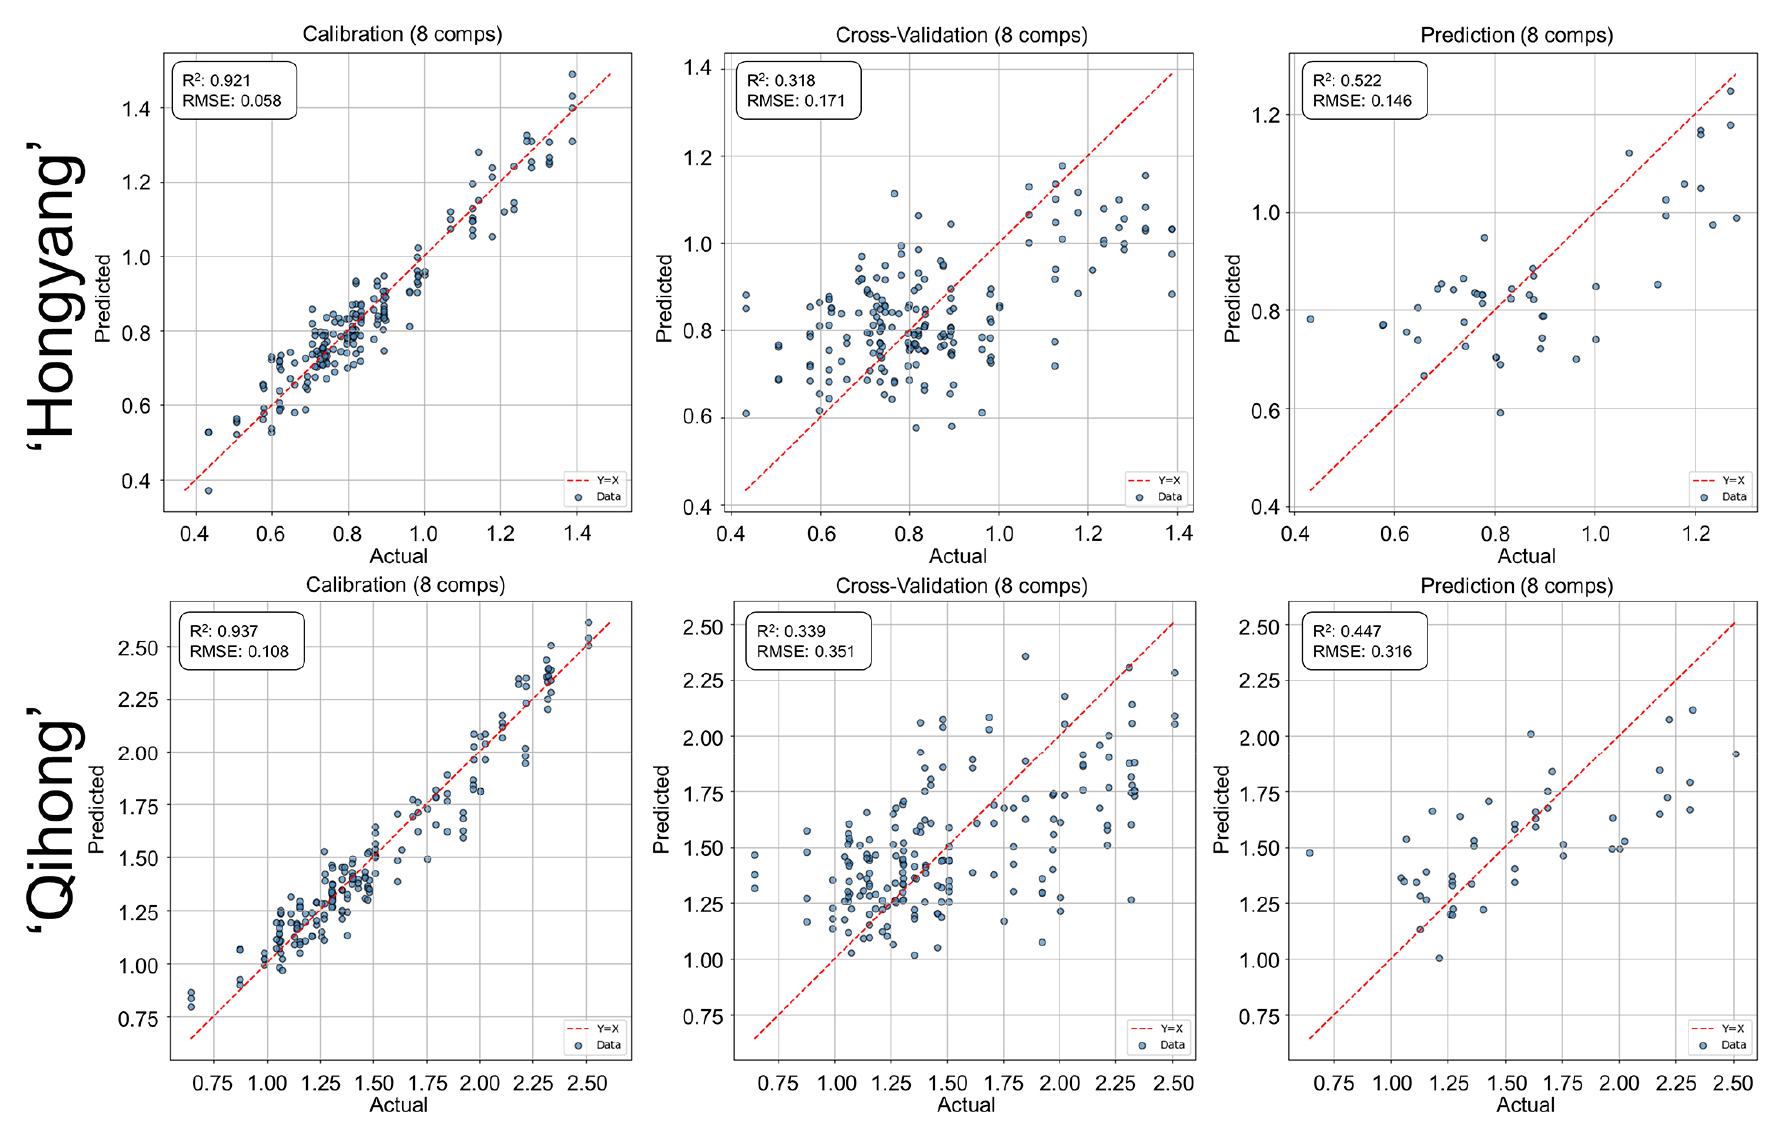
Fig. 5.
PLSR prediction performance for titratable acidity (TA) using V/NIR spectra in ‘Hongyang’ and ‘Qihong’ red-fleshed kiwifruits. Scatter plots show measured (actual) versus predicted values for calibration, 10-fold cross-validation (k = 10), and external prediction sets. The dashed line indicates the 1:1 relationship (y = x). Model statistics (R2 and RMSE) and the number of latent variables are displayed in each panel.
Prediction of the SSC/TA ratio showed moderate calibration performance but weaker validation robustness in both cultivars (Fig. 6). The larger calibration—validation discrepancy compared with SSC alone likely reflects error propagation from both numerator and denominator measurements, which can amplify variability and reduce model transferability. This pattern indicates that derived indices may be more sensitive to cultivar-dependent variability than primary chemical traits.
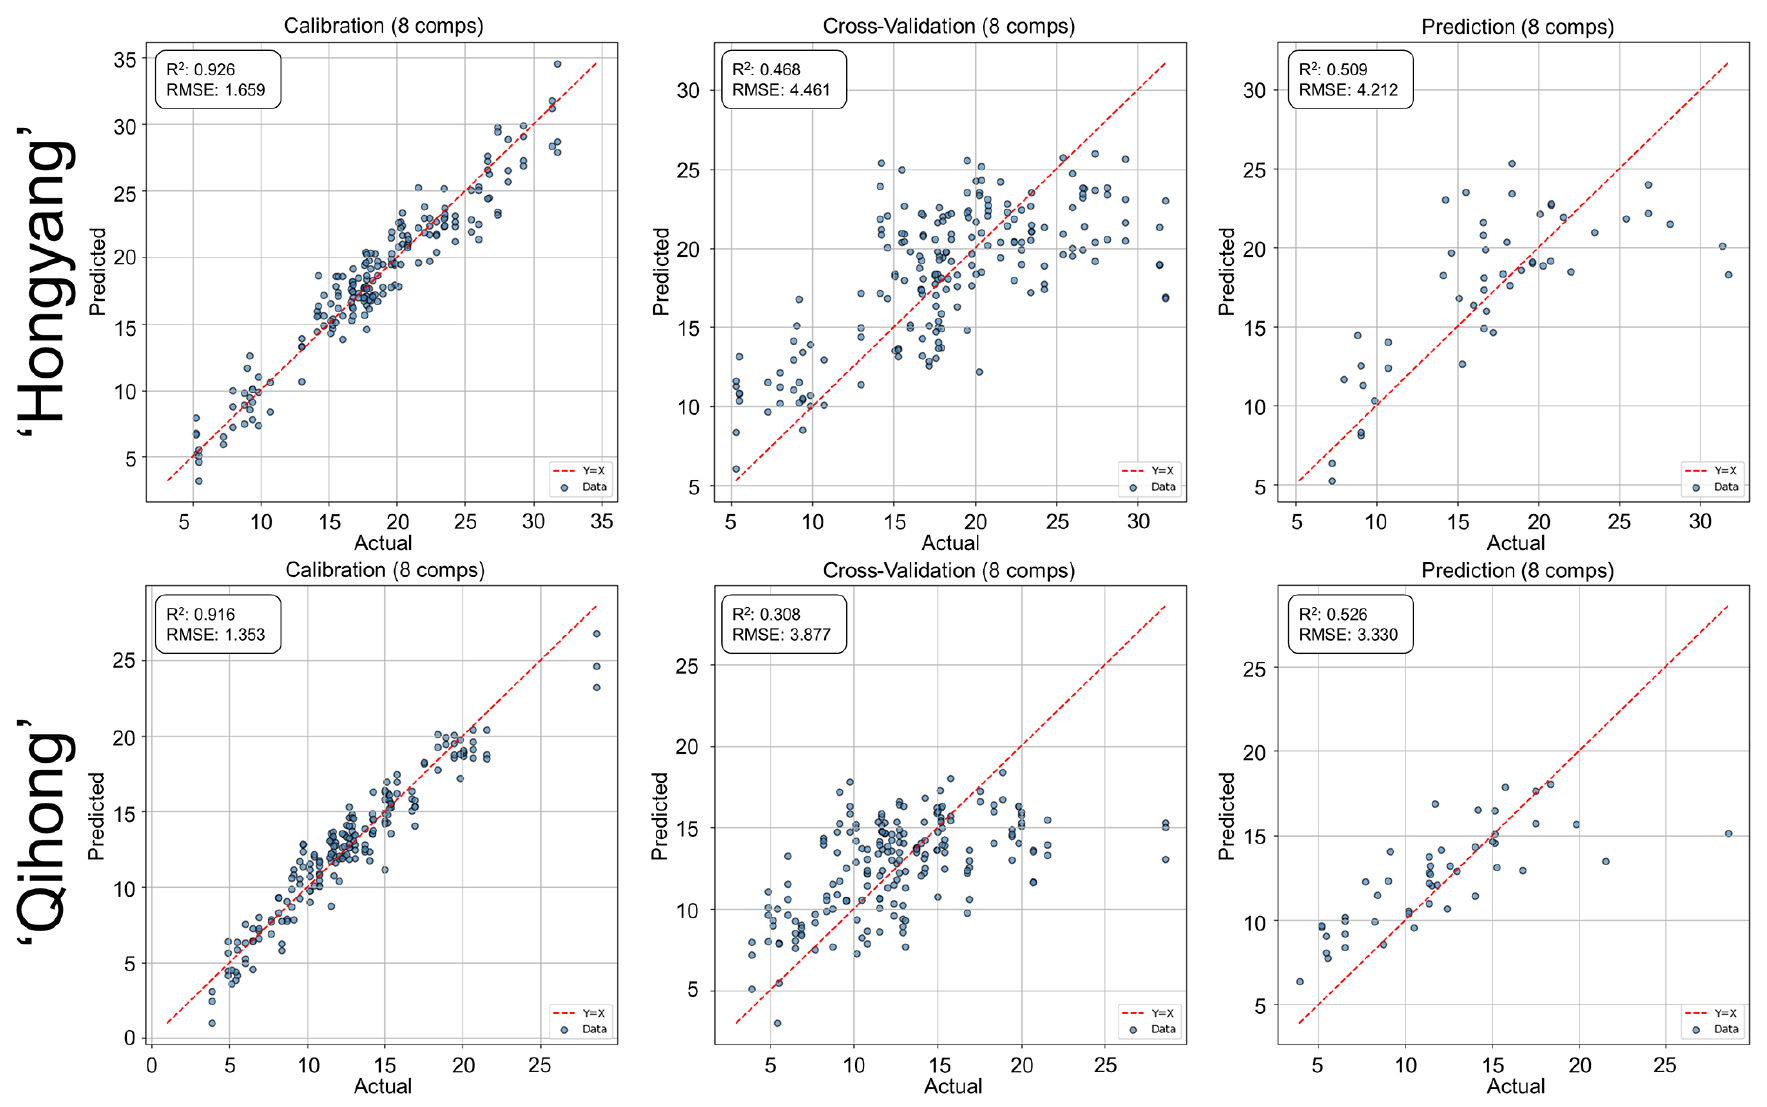
Fig. 6.
PLSR prediction performance for the SSC/TA ratio using V/NIR spectra in ‘Hongyang’ and ‘Qihong’ red-fleshed kiwifruits. Scatter plots show measured (actual) versus predicted values for calibration, 10-fold cross-validation (k = 10), and external prediction sets. The dashed line indicates the 1:1 relationship (y = x). Model statistics (R2 and RMSE) and the number of latent variables are displayed in each panel.
VNIR-based prediction of internal flesh color showed coordinate- and cultivar-dependent performance (Figs. 7, 8, 9). Lightness (L*) was predicted most consistently in both cultivars, with relatively stable agreement across calibration and validation. In contrast, chromaticity coordinates (a* and b*) showed greater variability and larger calibration—validation gaps, particularly in ‘Qihong’.
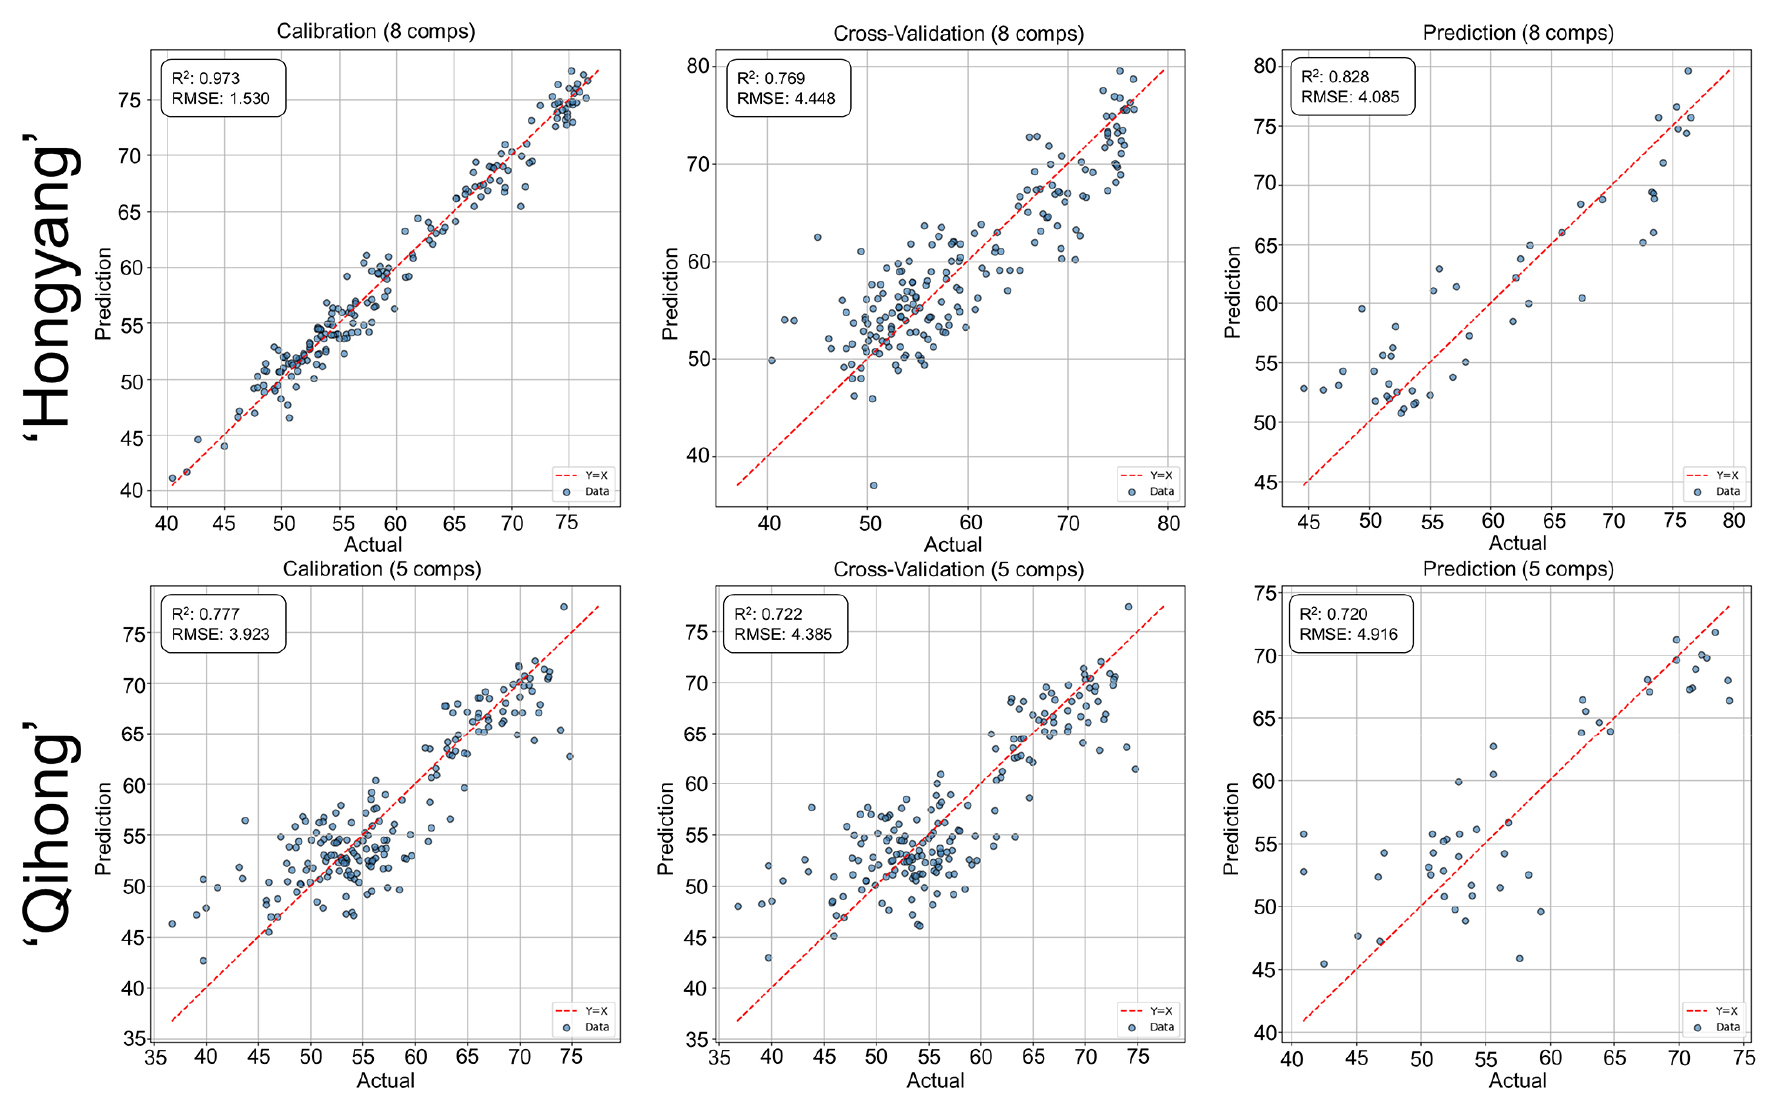
Fig. 7.
PLSR prediction performance for internal flesh color lightness (L*) using V/NIR spectra in ‘Hongyang’ and ‘Qihong’ red-fleshed kiwifruits. Scatter plots show measured (actual) versus predicted values for calibration, 10-fold cross-validation (k = 10), and external prediction sets. The dashed line indicates the 1:1 relationship (y = x). Model statistics (R2 and RMSE) and the number of latent variables are displayed in each panel.
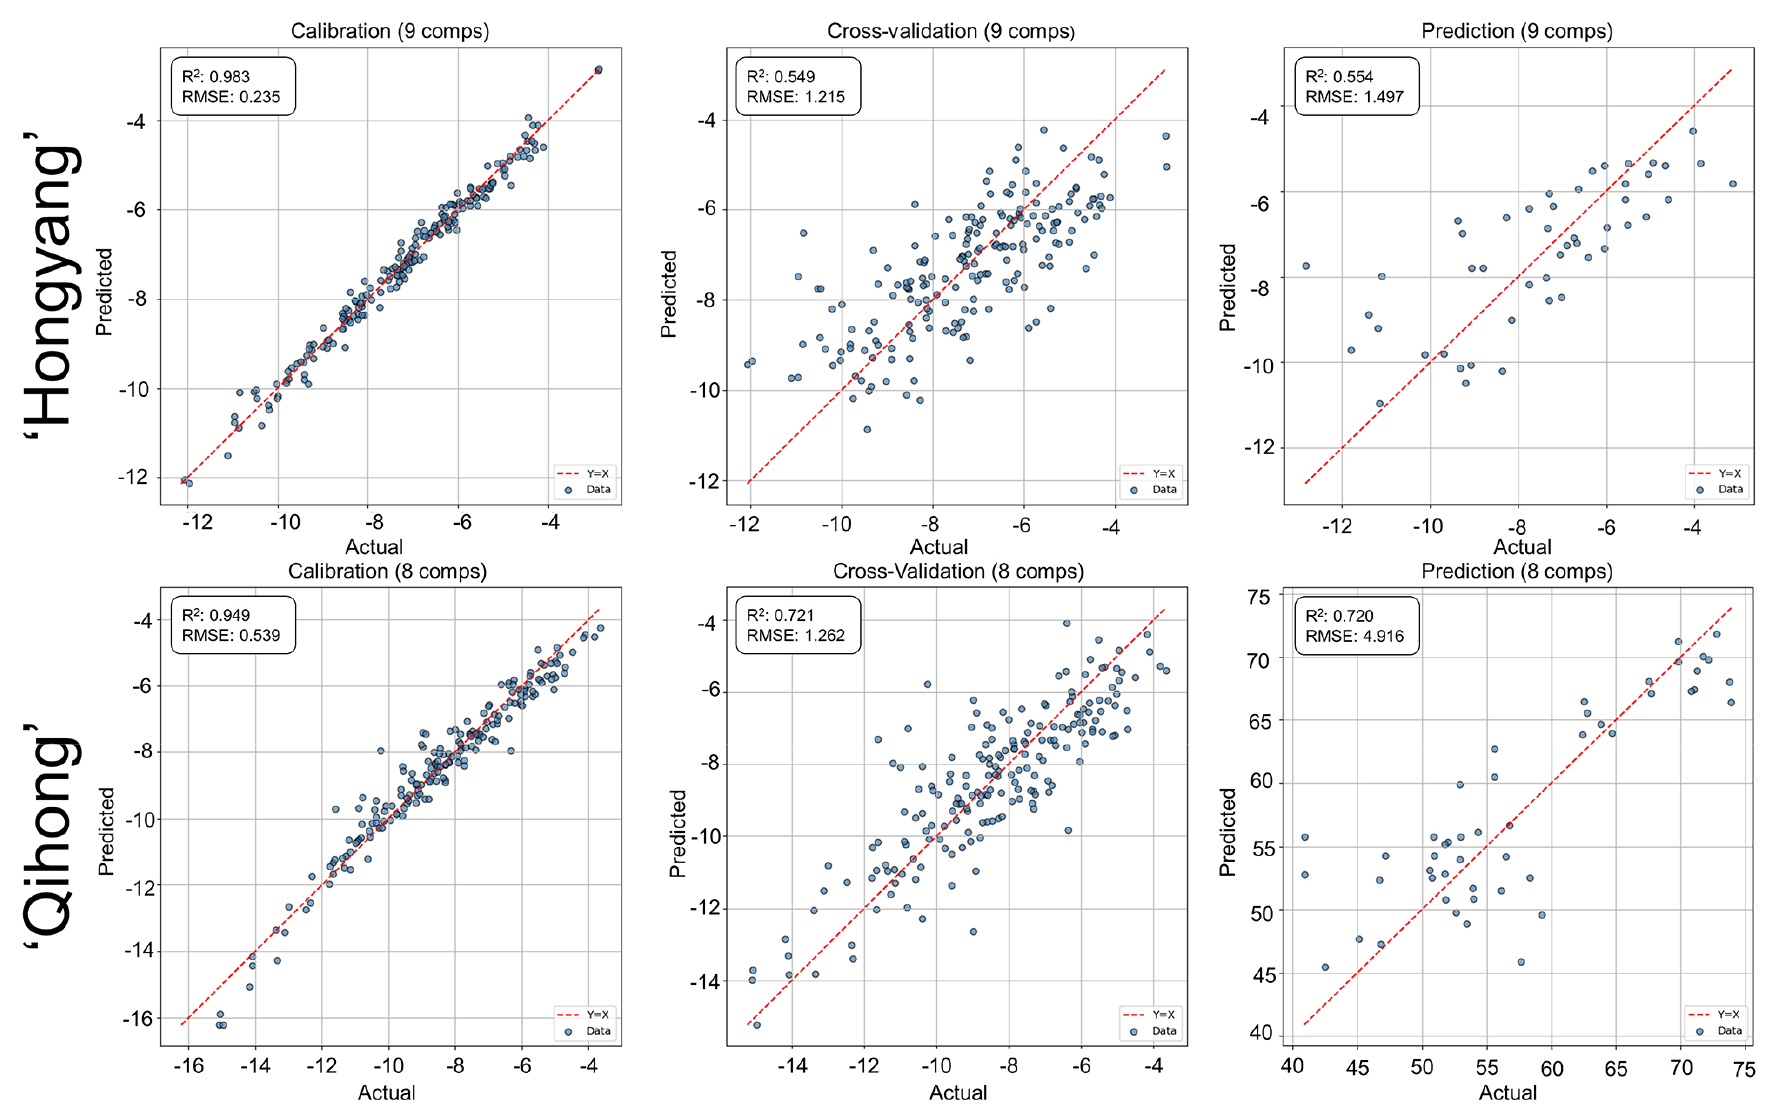
Fig. 8.
PLSR prediction performance for internal flesh color redness (a*) using V/NIR spectra in ‘Hongyang’ and ‘Qihong’ red-fleshed kiwifruits. Scatter plots show measured (actual) versus predicted values for calibration, 10-fold cross-validation (k = 10), and external prediction sets. The dashed line indicates the 1:1 relationship (y = x). Model statistics (R2 and RMSE) and the number of latent variables are displayed in each panel.
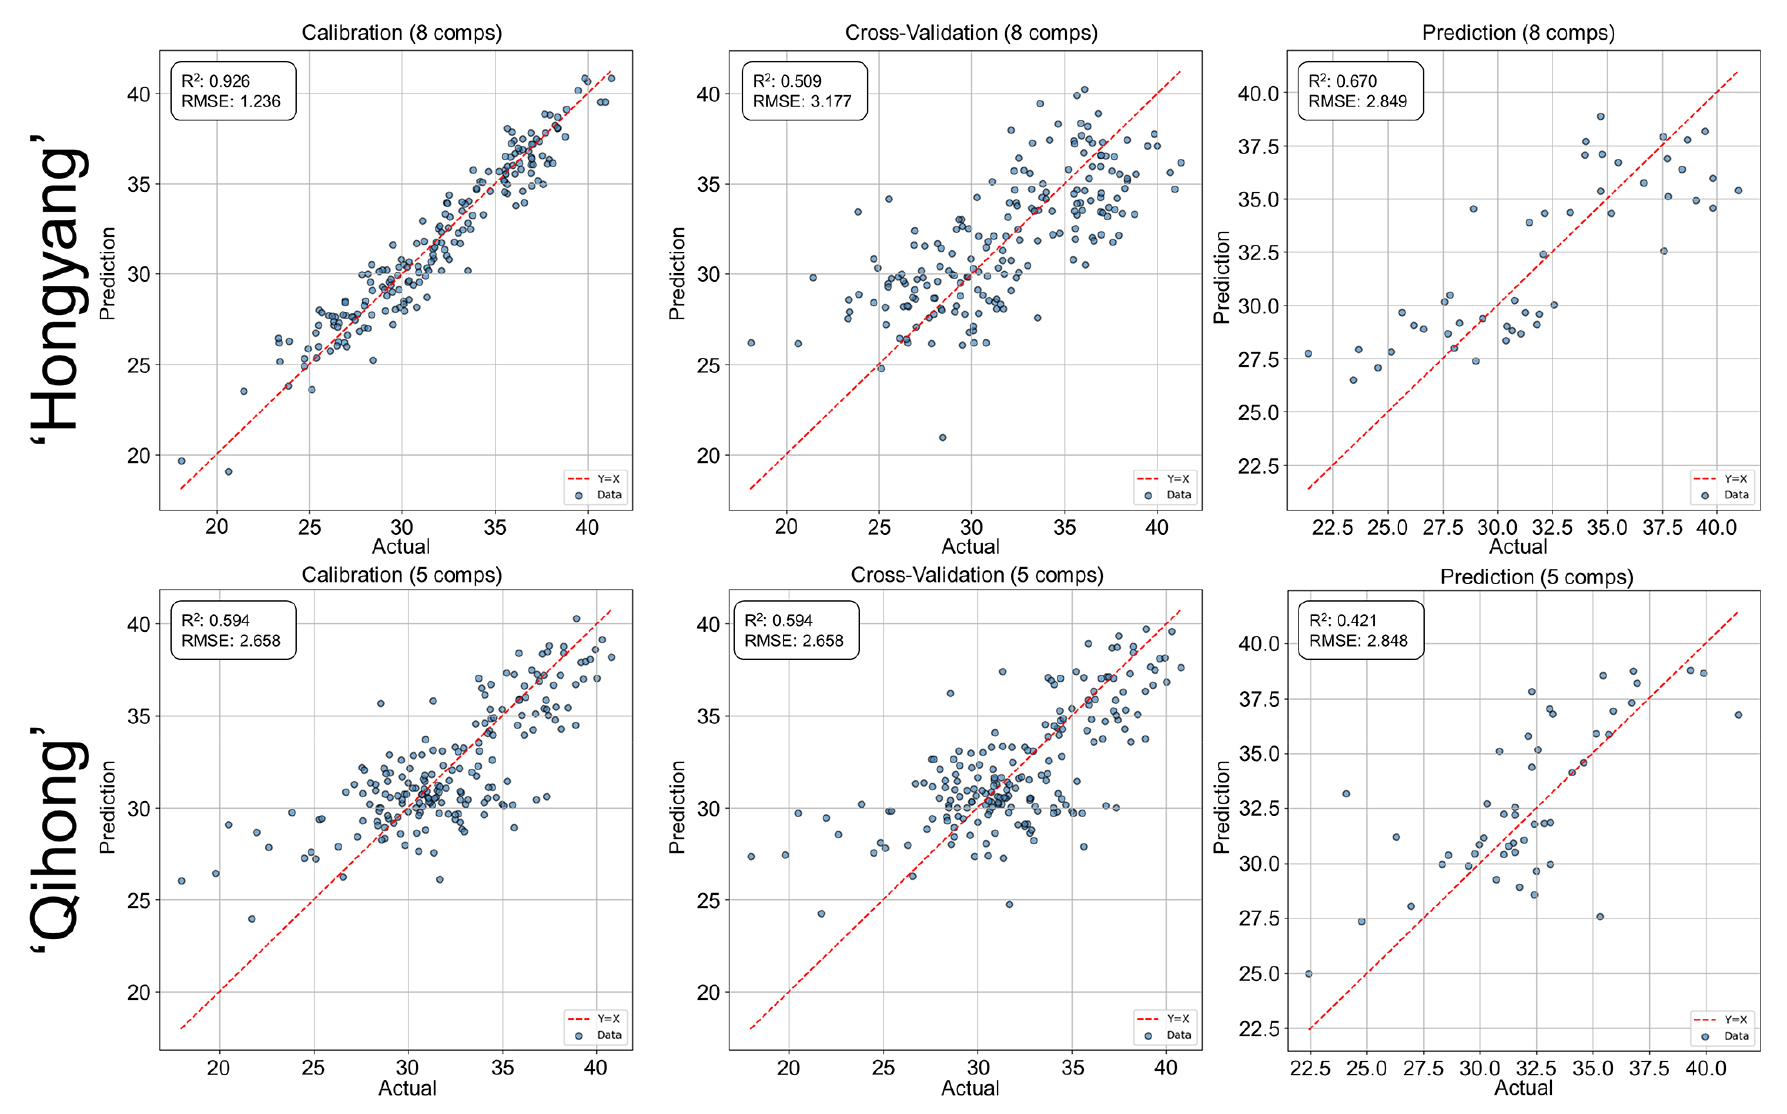
Fig. 9.
PLSR prediction performance for internal flesh color yellowness (b*) using V/NIR spectra in ‘Hongyang’ and ‘Qihong’ red-fleshed kiwifruits. Scatter plots show measured (actual) versus predicted values for calibration, 10-fold cross-validation (k = 10), and external prediction sets. The dashed line indicates the 1:1 relationship (y = x). Model statistics (R2 and RMSE) and the number of latent variables are displayed in each panel.
The higher robustness for L* compared with a* or b* likely reflects its dependence on overall tissue optical density and scattering, whereas chromaticity coordinates are more strongly influenced by pigment composition and spatial heterogeneity during ripening. Similar trends have been reported in VNIR-based color prediction studies of kiwifruit and other fruit species (Afonso et al., 2022).
Correlation among ripening parameters
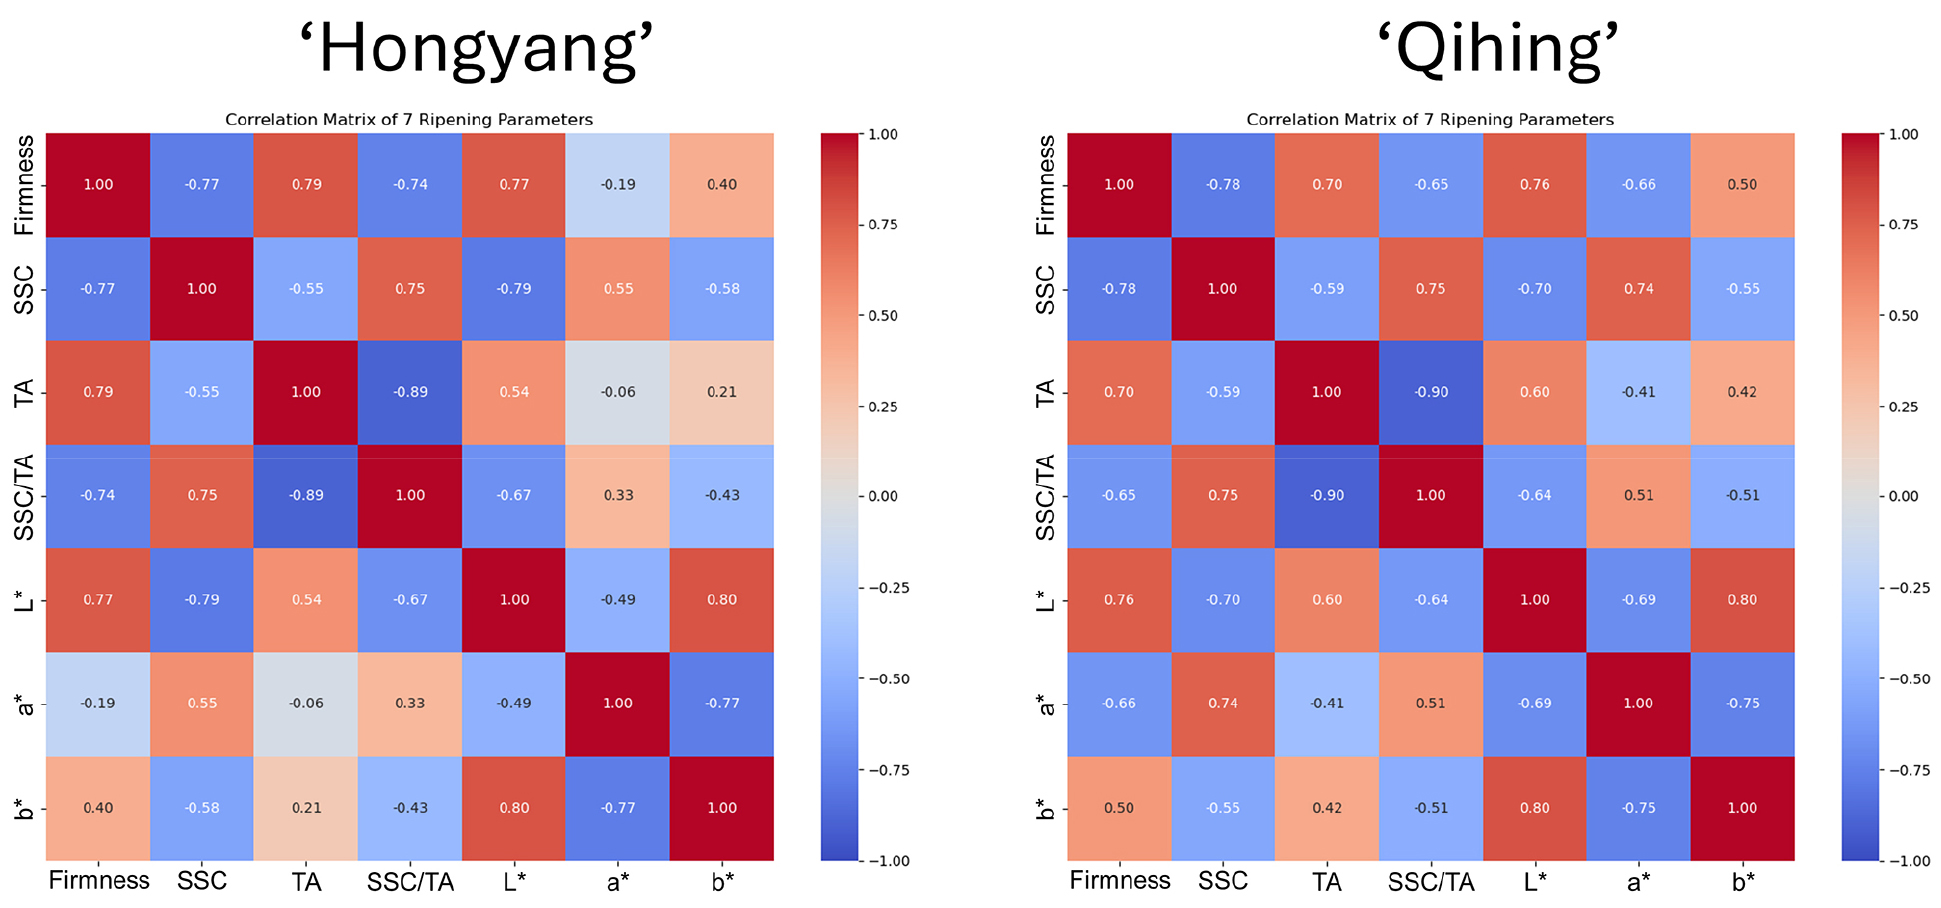
The correlation analysis revealed consistent ripening relationships in both ‘Hongyang’ and ‘Qihong’, consistent with established kiwifruit ripening behavior where softening is accompanied by sugar accumulation and acid loss, resulting in an increased sweetness-acidity balance (Choi et al., 2022). Firmness was strongly negatively correlated with TSS and the TSS/TA ratio (r = -0.65 to -0.78) (Fig. 10), indicating that softening progressed with sugar accumulation and improvement in sweetness-acidity balance, a pattern widely reported during kiwifruit ripening and “ready-to-eat” development (Cha et al., 2019). TA showed the strongest negative correlation with the TSS/TA ratio (r = -0.89 to -0.90), while TSS was positively correlated with the ratio (r = 0.75), reflecting the combined effects of increasing soluble solids and declining acidity that together drive the increase in the Brix-acid (SSC/TA) balance during ripening (Cha et al., 2019). Color variables were also interrelated: L* was strongly positively correlated with b* (r = 0.80), and a* was strongly negatively correlated with b* (r = -0.75 to -0.77), showing coordinated shifts in brightness, yellowness, and redness. A notable cultivar contrast was observed for firmness versus a*, which was weak in ‘Hongyang’ but markedly stronger in ‘Qihong’, supporting the need for cultivar-specific interpretation and modeling of color-linked maturity traits.
Refined ripening index distribution
The refined ripening index (constructed using parameters with correlation ≥ 0.6) spanned the full scale from 0 (unripe) to 10 (overripe) in both cultivars, confirming that the dataset captured a broad range of maturity stages. However, in both ‘Hongyang’ and ‘Qihong’, the distributions were skewed toward mid-to-late ripening, with most observations concentrated between approximately 5 and 9 (Fig. 11). ‘Hongyang’ showed its highest density around 7-8, whereas ‘Qihong’ was more tightly clustered around 6-7 (Fig. 11), indicating a stronger concentration of fruit samples at commercially relevant ripe stages. In both cultivars, early-stage fruit (0-3) were comparatively underrepresented, which is important when interpreting model behavior at the unripe end of the index scale, where predictive robustness may be inherently limited due to fewer samples.
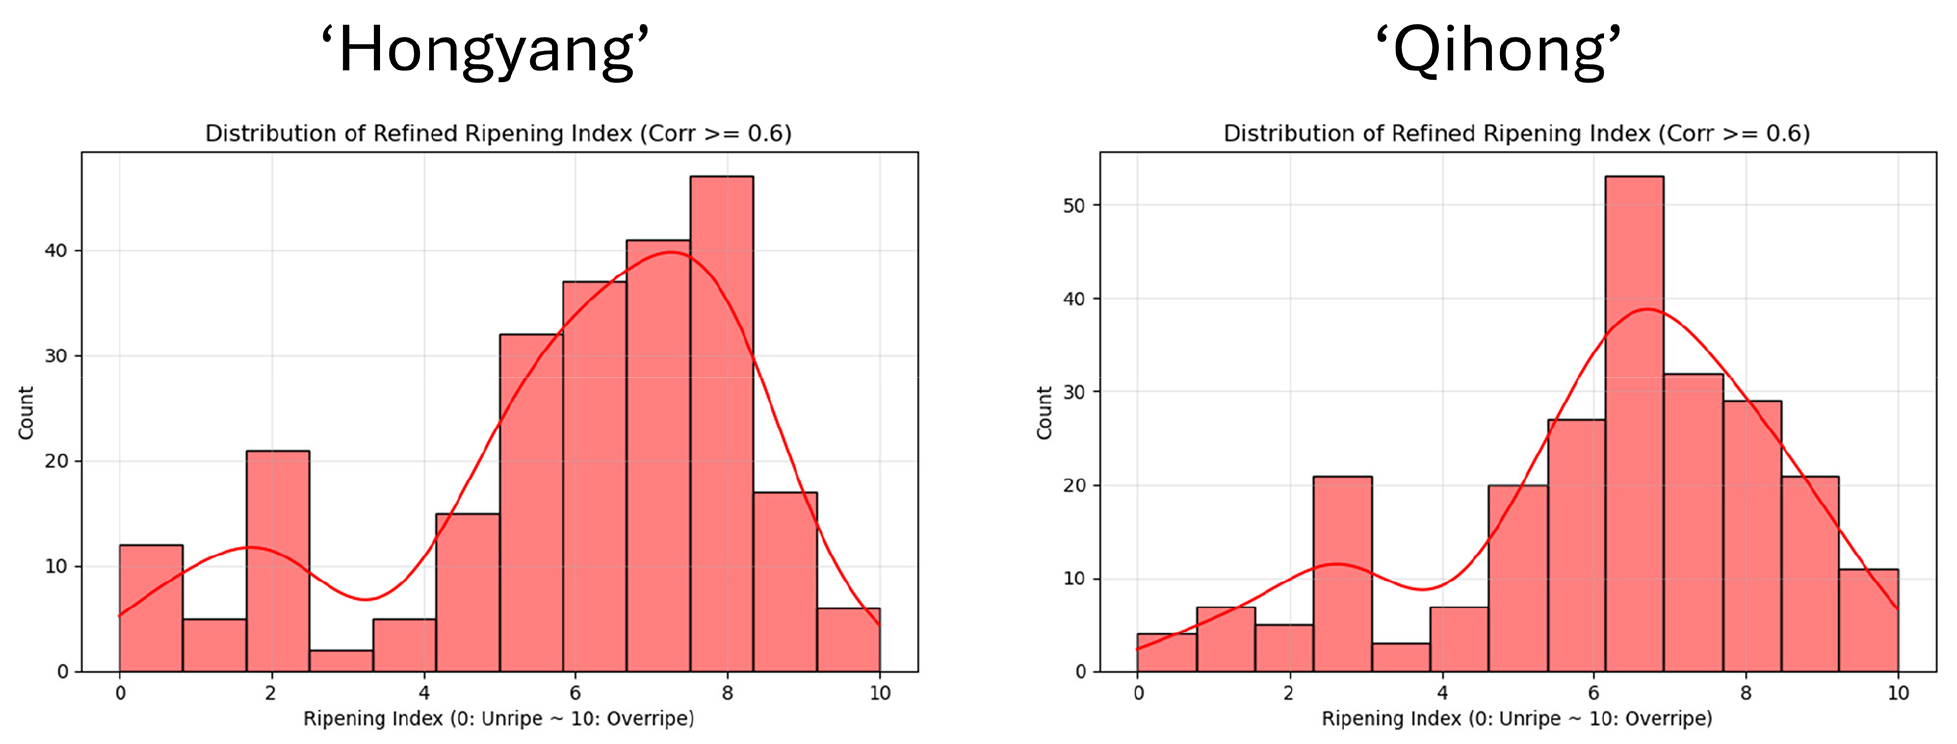
Fig. 11.
Distribution of the refined ripening index for ‘Hongyang’ and ‘Qihong’ red-fleshed kiwifruit cultivars. The refined index was calculated using ripening parameters showing correlations ≥ 0.6 and is expressed on a 0-10 scale (0 = unripe; 10 = overripe). Histograms show the frequency of samples across ripening stages, and the overlaid curve represents the smoothed density trend.
Conclusions
VNIR spectroscopy (400-1100 nm) enabled non-destructive prediction of key ripening attributes in red-fleshed kiwifruit. Among the tested variables, firmness, SSC, and L* showed the most reliable predictive performance, whereas TA, SSC/TA ratio, and chromaticity parameters exhibited lower generalization and stronger cultivar dependency. These results indicate that prediction accuracy depends on both trait type and cultivar-specific variability. Despite these limitations, VNIR-based models demonstrated practical potential for rapid ripening assessment and postharvest quality monitoring when calibrated and validated for individual cultivars.