

Introduction
Materials and Methods
Soil Chemistry and Plant Tissue Analysis
Calculation of Fertilizer Use Efficiency
Survey on Fertilizer Usage Practices in Wild Chive Farming Households
Wild Chive Cultivation Trial by Fertilizer Level
Statistical Analysis
Results and Discussion
Fertilizer Application Practices and Soil Chemical Properties in Wild Chive Farming Households
Growth of Wild Chive in Cultivation Trials at Different NPK Levels
Fertilizer utilization efficiency of Allium monanthum by NPK fertilizer level
Conclusions
Introduction
To enhance crop productivity and quality, an appropriate supply of the three major nutrients—nitrogen, phosphorus, and potassium—is essential. Nitrogen, a component of plant proteins and enzymes, is essential to energy metabolism processes. Phosphorus, necessary for photosynthesis and a component of genetic material, also plays a crucial role in regulating water and nutrient uptake (Zewdie and Reta, 2021). However, farmers tend to apply fertilizers in excess of the recommended rates for various reasons, including uncertainty about fertilizer plant availability, lack of information on crop-specific standard fertilizer application rates, and climate change (Del Rossi, 2023). Excessive fertilizer use reduces biodiversity by disrupting microbial community balance and causing soil acidification, ultimately leading to decreased crop yields (Song et al., 2022). In addition, fertilizer nutrients at excessive levels can leach into groundwater and cause water pollution through eutrophication (Anderson et al., 2008). Excessive use of nitrogen fertilizers, in particular, generates various air pollutants, such as nitrous oxide (N2O), ammonia (NH3), and nitrogen oxides (NO_x) (Good and Beatty, 2011). To minimize adverse effects from fertilizer use, systematic fertilizer management that takes into account the nutrient utilization characteristics of each crop is necessary (Liu et al., 2024).
In Korea, the perennial bulbous plant Allium monanthum Maxim. (Amaryllidaceae), known as wild chive, is a crop cultivated on a small scale. Its bulb is white and round, forming 2-6 bulblets that propagate naturally. The leaves are 25-30 cm long with grooves on the upper surface. It exhibits strong cold tolerance and rapid propagation and growth. Distributed throughout East Asia, including China and Japan, A. monanthum is primarily cultivated in Seosan, Taean, South Chungcheong Province, and Hwacheon, Gangwon Province, in Korea (Choi, 2009). For such minor crops, fertilizer application standards are often not yet established, necessitating further research to determine appropriate fertilizer rates.
This study was conducted as a preliminary investigation to establish fertilizer application standards for wild chive. Soil chemistry, yield, and nutrient use efficiency were analyzed based on a survey of fertilizer usage practices among farmers and cultivation trials involving different levels of NPK fertilizer. The aim was to evaluate the effects of fertilizer use on crop productivity and soil environmental factors.
Materials and Methods
Soil Chemistry and Plant Tissue Analysis
Soil chemical properties and plant component analyses were conducted according to the methods published in the Rural Development Administration’s Comprehensive Testing Laboratory Manual (RDA, 2023). Soil samples were collected using an auger from the topsoil layer at a depth of 0-15 cm. The samples were air-dried and sieved through a 2-mm mesh to prepare the final sample. pH and electrical conductivity (EC) were measured using a pH and an EC meter after mixing the sample with distilled water at a 1:5 (w/w) ratio and shaking. Organic matter was analyzed using the Tyurin method, and available phosphorus using the Lancaster method, both determined with a spectrometer (UV-2600, Shimadzu, Japan). Exchangeable cations were extracted with 1M NH4OAC (pH 7.0) and analyzed using an Inductively coupled plasma-optical emission spectrometer (Integra XL DUAL, GBC Scientific, Australia). In preparation for analysis, wild chive was dried at 80°C and then ground to obtain analytical samples. Total nitrogen (T-N) was measured using the Kjeldahl distillation method, P2O5 using the vanadate method, and K2O using an Inductively coupled plasma-optical emission spectrometer (Integra XL DUAL, GBC Scientific, Australia).
Calculation of Fertilizer Use Efficiency
To evaluate the fertilizer utilization efficiency of wild chive under different NPK fertilizer levels, Fertilizer Partial Factor Productivity (FPFP), Fertilizer Agronomic Efficiency (FAE), and Fertilizer Recovery (FR) were calculated using the following Eq. (1), (2), (3) (Baligar et al., 2001; Lee et al., 2023, 2024; Saleem et al., 2022).
Fertilizer Partial Factor Productivity (FPFP) is an indicator representing yield relative to fertilizer application rate, evaluating the overall efficiency of fertilizer use. Fertilizer agronomic efficiency (FAE) indicates the extent to which fertilizer contributes to actual growth improvement by determining the additional growth and yield increases resulting from fertilizer use. Fertilizer recovery rate (FR) refers to the proportion of nutrients supplied by fertilizer that are actually absorbed and accumulated by plants, serving as an indicator of nutrient absorption and utilization efficiency.
Survey on Fertilizer Usage Practices in Wild Chive Farming Households
A survey on fertilizer usage practices was conducted by selecting 41 farms in major wild chive production areas, such as Hwacheon, Gangwon Province, and Taean and Seosan, South Chungcheong Province. Fertilizer application rates per farm were investigated, and the amounts of N-P2O5-K2O components were converted to values per hectare. To analyze soil chemistry, plant composition and calculate fertilizer use efficiency, wild chive plants and topsoil samples were collected from the farmlands of the 41 wild chive growers during the growing season (August-October). These samples were analyzed according to the comprehensive testing manual of the National Institute of Agricultural Sciences (RDA, 2023).
Wild Chive Cultivation Trial by Fertilizer Level
The cultivation trial for wild chive was conducted on plots selected for their relatively low fertility. The study was carried out over two years (2023-2024) at the experimental research plots of the Gangwon Special Self-Governing Province Agricultural Research Institute, where exchangeable calcium and magnesium levels, as well as the organic matter content, were somewhat below the optimal range. Soil chemistry of the experimental research plots in the cultivation trial is described in Table 1. Soil samples for the 2023-2024 cultivation trial were collected in August. Additional samples were taken on September 11, 2023, and September 9, 2024, for chemical analysis during the trial. Each treatment block was arranged using a completely randomized design with a single-block system. The fertilizer application rate for wild chive was based on the crop-specific standard fertilizer prescription, set at N-P2O5-K2O = 111-67-107 kg・ha-1 and applied entirely as a basal application (NAAS, 2022). Using the standard allium fertilization rate as the baseline (1.0×), five levels (0×, 0.5×, 1.0×, 1.5×, and 2.0×) of each component of N-P2O5-K2O were applied, resulting in 15 independent treatment plots of 40 m2 (Table 2). Nitrogen fertilizer was in the form of urea, phosphorus as superphosphate, and potassium as potassium chloride. Additionally, 7,600 kg・ha-1 of mixed livestock manure compost, as an organic matter source, was applied before transplanting. As the experimental plots were newly established, soil organic matter content remained low in the first year of the trial despite the application of mixed livestock manure compost. Wild chives were sown in rows spaced 20 cm apart on ridges 120 cm wide. Growth surveys were conducted in triplicate on a 2 m2 area per treatment. Yield (dry weight), plant height, and number of leaves were measured. Yield data were analyzed using regression analysis to determine the optimal fertilizer application rate for maximum yield for each NPK component.
Table 1
Chemical properties of the soils used in the Allium monanthum cultivation experiment
| Category |
pH (1:5) |
EC (dS・m-1) |
Organic Matter (g・kg-1) |
Av. P2O5 (mg・kg-1) | Exchangeable Cations (cmolc・kg-1) | |||
| K | Ca | Mg | ||||||
|
Pre-experimental soils | 2023 | 6.9 | 0.29 | 14 | 464 | 0.58 | 3.5 | 0.8 |
| 2024 | 7.5 | 0.26 | 19 | 462 | 0.26 | 3.3 | 0.6 | |
|
Soils during the experiment (range) | 2023 |
6.9 (6.4-7.5) |
0.25 (0.17-0.33) |
12 (8-15) |
402 (229-674) |
0.51 (0.19-0.85) |
3.7 (3.1-4.9) |
0.8 (0.6-1.1) |
| 2024 |
6.9 (6.5-7.4) |
2.88 (1.27-5.44) |
23 (19-33) |
713 (605-842) |
1.21 (0.61-2.37) |
6.1 (5.0-8.2) |
1.1 (1.0-1.5) | |
| Optimum range1) | 6.0-7.0 | < 2.0 | 20-30 | 300-550 | 0.50-0.80 | 5.0-6.0 | 1.5-2.0 | |
1)Optimum range in upland soils recommended by NAAS (2022).
Table 2
Amount of fertilization by treatment in the Allium monanthum cultivation experiment
Statistical Analysis
Soil and plant body analyses represent the mean of three replicates. Statistical processing and visualization of the data were performed using the R statistical program (ver. 4.4.1, The R Foundation for Statistical Computing, Vienna, Austria). Statistical significance for mean comparisons among treatments at different fertilizer levels was tested using Duncan’s Multiple Range Test (DMRT). Furthermore, the relationship between fertilizer application rates and wild chive yield (dry weight) in the cultivation trials was analyzed using simple regression analysis. The relationship between fertilizer application rates and soil chemical properties was analyzed using Pearson’s correlation coefficients.
Results and Discussion
Fertilizer Application Practices and Soil Chemical Properties in Wild Chive Farming Households
A survey of fertilizer application rates was conducted among 41 farming households in the main wild chive-producing region (Table 3). The results showed that the average fertilizer application rates were 162 kg N・ha-1, 93 kg P2O5・ha-1, and 117 kg K2O・ha-1. Significant variation in fertilizer application rates was observed among individual farms. Nitrogen (N) application ranged from 18 to 406 kg・ha-1, phosphate (P2O5) from 0 to 234 kg・ha-1, and potash (K2O) from 4 to 473 kg・ha-1. This variation is thought to have occurred from differences in conventional fertilizer application rates and soil fertility across regions. Furthermore, basal fertilizer accounted for the majority of total fertilizer application, while topdressing was relatively low. Topdressing with phosphate and potash was almost non-existent. This fertilizer application pattern is presumed to result from the short cultivation period inherent in the leaf-production-focused growth characteristics of wild chive.
Table 3
Fertilizer application rates of Allium monanthum cultivated farms (n = 41)
| Statistics | Base fertilization (kg・ha-1) | Additional fertilization (kg・ha-1) | Total (kg・ha-1) | ||||||
| N | P2O5 | K2O | N | P2O5 | K2O | N | P2O5 | K2O | |
| Mean + SD1) | 129 ± 68 | 86 ± 62 | 95 ± 57 | 31 ± 55 | 5 ± 22 | 13 ± 33 | 162 ± 90 | 93 ± 63 | 117 ± 84 |
| Maximum | 289 | 234 | 234 | 218 | 91 | 127 | 406 | 234 | 473 |
| Minimum | 18 | - | 4 | 14 | - | - | 18 | - | 4 |
Soil chemistry analysis at 41 wild chive-growing farms, compared with the optimal range for field soils (NAAS, 2022) (Table 4), showed an average pH of 6.8, with 53.6% of farms falling within the optimal range. However, the mean concentrations of available phosphorus (Av. P2O5) and exchangeable cations potassium (K) and calcium (Ca) exceeded the optimal range. In terms of farm soil chemistry, 78% of farms had available phosphorus in excess of the optimal range, 83% had excess potassium, and 61% had excess calcium. Organic matter content averaged 35 g・kg-1 but showed significant variation among farms (19-67 g・kg-1), with some farms exhibiting low organic matter levels. Electrical conductivity (EC) was within the optimal range for the majority of farms (97.6%).
Table 4
Chemical properties and distribution of the soils under Allium monanthum cultivation (n = 41)
| Category |
pH (1:5) |
EC (dS・m-1) |
Organic Matter (g・kg-1) |
Av. P2O5 (mg・kg-1) |
Exchangeable Cations (cmolc・kg-1) | |||
| K | Ca | Mg | ||||||
|
Mean + SD1) (range) |
6.8 ± 0.7 (5.1-8.2) |
0.81 ± 0.57 (0.24-3.14) |
35 ± 12 (19-67) |
878 ± 494 (229-2,781) |
1.46 ± 0.91 (0.40-5.72) |
7.2 ± 3.2 (2.6-20.4) |
2.6 ± 3.2 (0.5-18.0) | |
| Optimum range2) | 6.0-7.0 | < 2.0 | 20-30 | 300-550 | 0.50-0.80 | 5.0-6.0 | 1.5-2.0 | |
|
Distribution of soil samples (%) | Super optimal | 36.6 | 2.4 | 58.5 | 78.0 | 82.9 | 61.0 | 41.5 |
| Optimal | 53.6 | 97.6 | 31.7 | 17.1 | 17.1 | 19.5 | 29.2 | |
| Suboptimal | 9.8 | - | 9.8 | 4.9 | - | 19.5 | 29.3 | |
2)Optimum range in upland soils recommended by NAAS (2022).
Correlation analysis results between fertilizer application rates and soil chemical properties (Fig. 1) showed that, overall, soil nitrogen content increased significantly with increasing nitrogen fertilizer application rates. In particular, a significant positive correlation was observed between phosphate fertilizer application rates and soil available phosphorus content. Furthermore, strong positive correlations were found among the three major fertilizer nutrients (nitrogen, phosphate, and potassium), likely reflecting the tendency for farms to primarily use nitrogen-phosphate-potassium compound fertilizers as basal fertilizers. Conversely, nitrogen application rates showed no clear correlation with soil pH, electrical conductivity (EC), or organic matter content. Excessive fertilizer use can cause environmental pollution through nutrient accumulation and salt buildup in the soil, making it crucial to prevent this by applying fertilizers at appropriate rates.
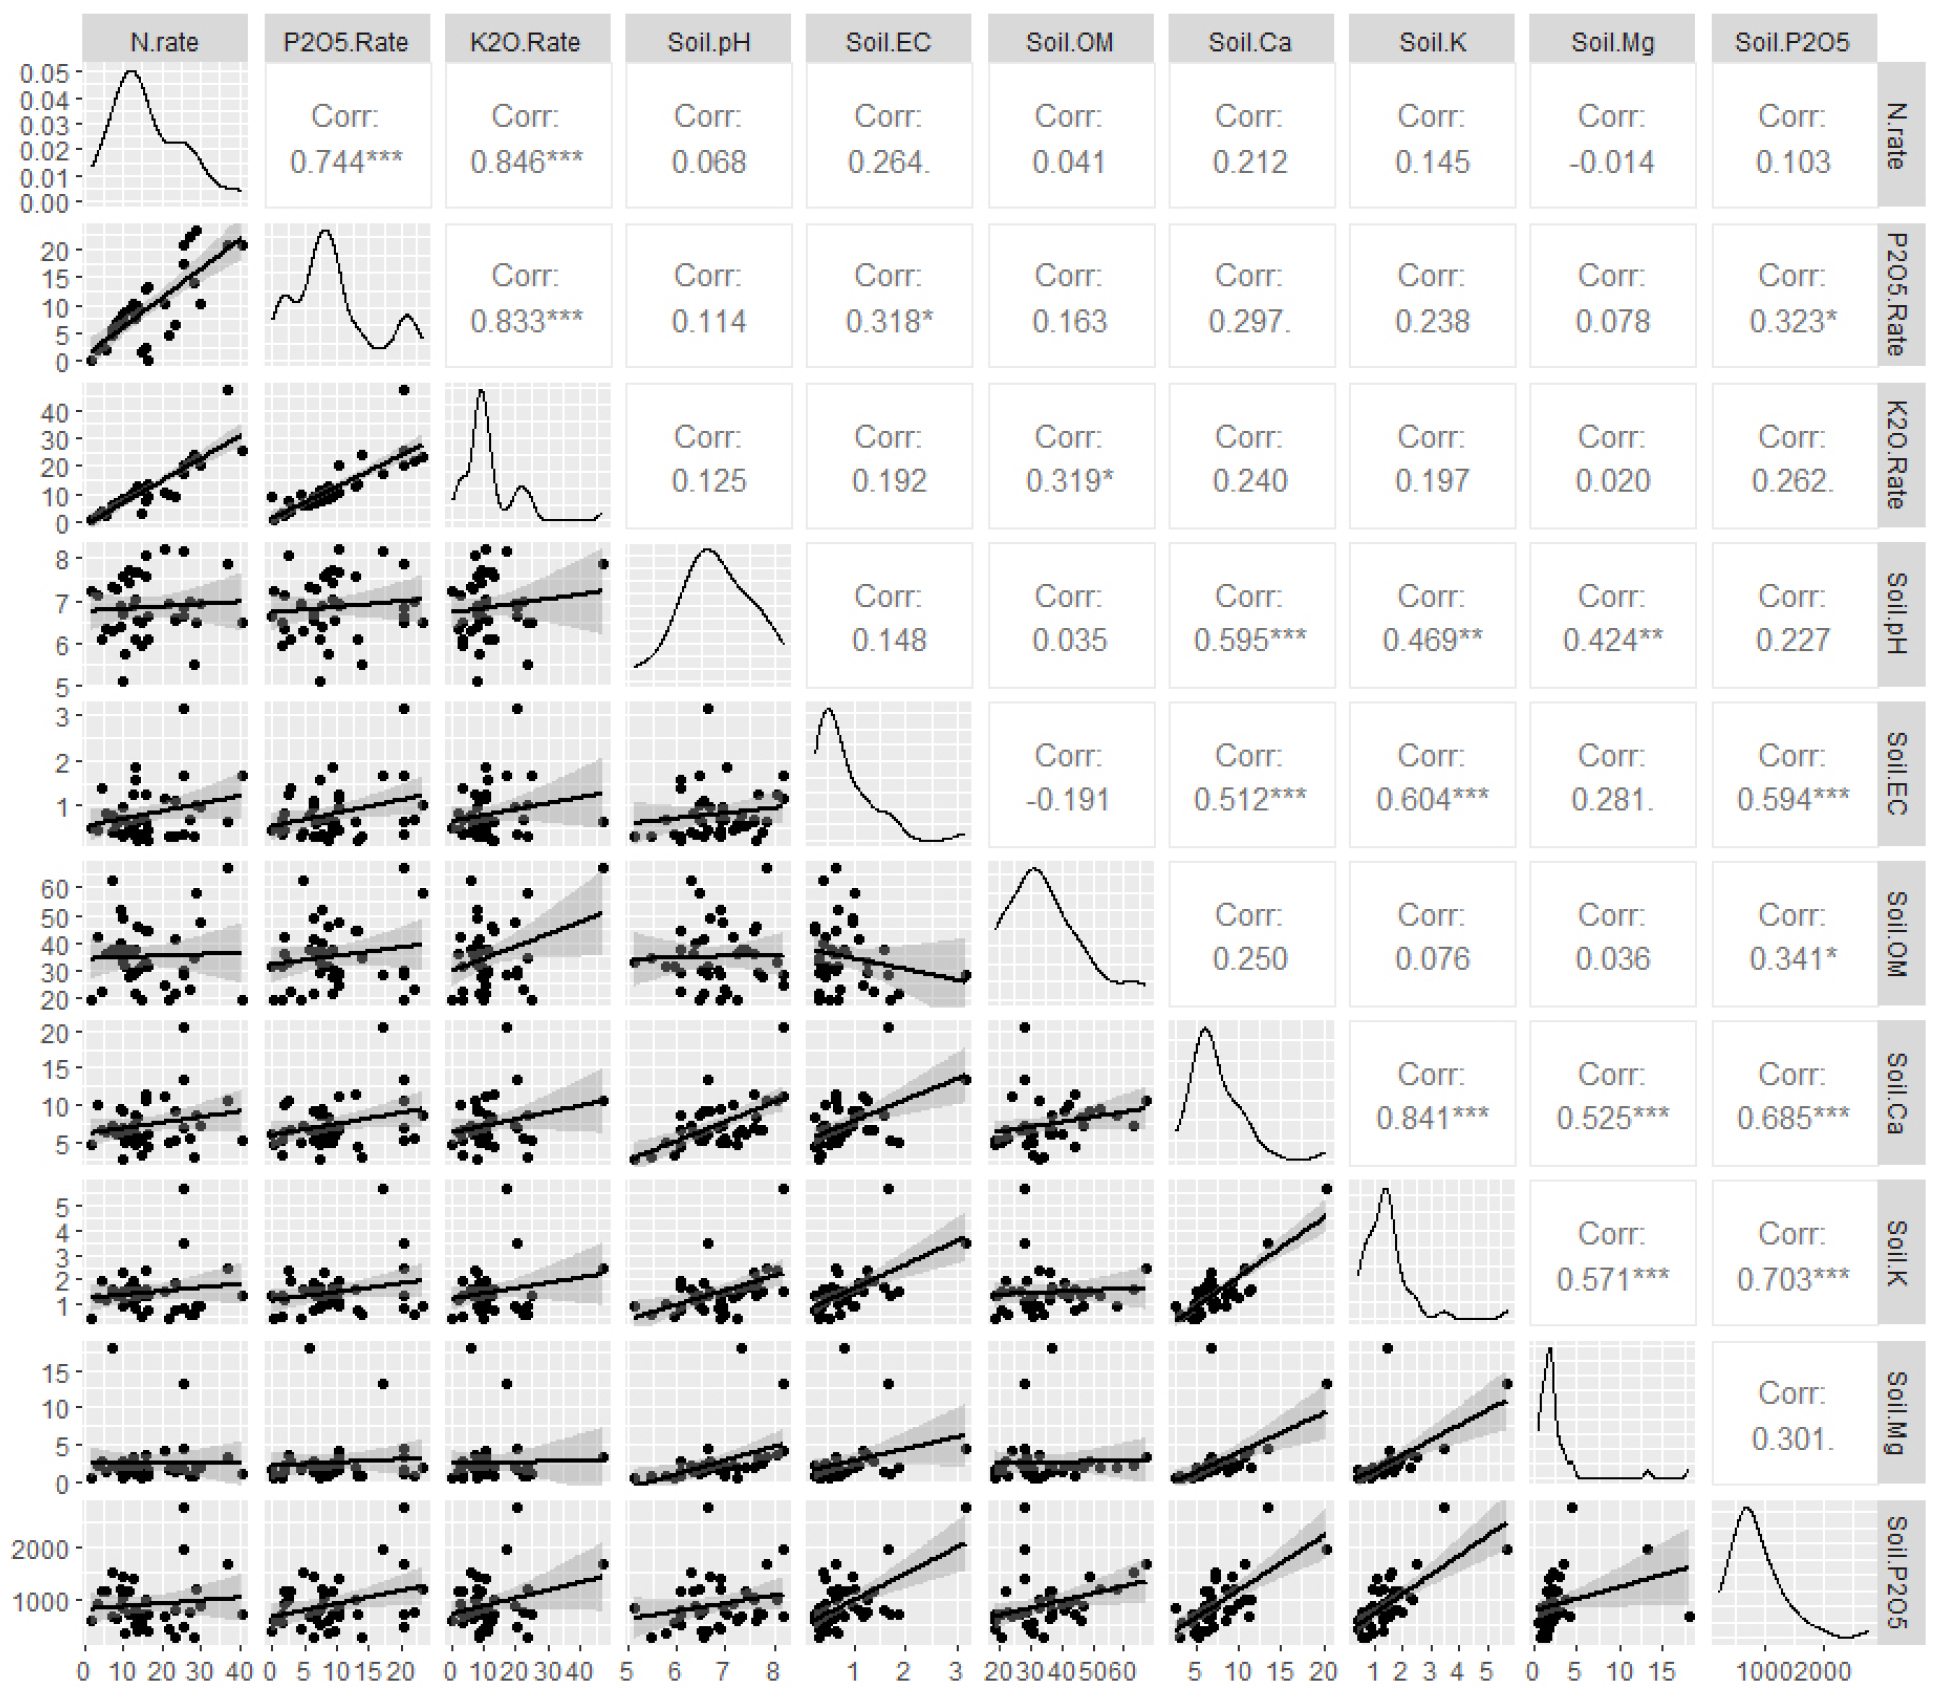
Fig. 1.
Correlation between fertilizer application rates and soil chemical properties in Allium monanthum crops (n = 41). Upper panels indicate Pearson correlation coefficients with significance levels (*p < 0.05, **p < 0.01, ***p < 0.001); diagonal panels represent the distribution of each variable; lower panels display pairwise scatter plots with fitted regression lines.
Growth of Wild Chive in Cultivation Trials at Different NPK Levels
Analysis of growth and yield responses of wild chive at different NPK fertilizer levels (Table 5, Fig. 2) showed that dry weight increased with fertilizer application, then decreased, exhibiting a parabolic pattern. In 2023, while statistical significance was not large in the nitrogen and phosphorus treatment plots, the potassium treatment plot showed a maximum dry weight of 591 kg・ha-1 at the 0.5× rate, indicating a significant difference between treatments. Yields actually decreased at the 1.5× and 2.0× rates. In 2024, the nitrogen treatment plot showed a maximum dry matter yield of 822 kg・ha-1 at the 0.5× rate, with yields decreasing significantly at higher application rates. Both 2023 and 2024 showed optimal growth at the 0.5-1.0× rate range. Plant height showed distinct trends depending on fertilizer treatment, but generally increased most significantly with nitrogen application. In 2024, plant height in the 0.5-1.5× nitrogen treatment plots ranged from 42 to 45 cm, significantly greater than the corresponding result in the no-fertilizer plot (37.5 cm), and the number of leaves also showed a similar trend. Conversely, the 2.0× application reduced both plant height and leaf number. Among the three major nutrients, phosphorus exhibited a relatively mild growth response. This is likely due to the strong binding of phosphorus with Ca, Fe, and Al in the soil, leading to immobilization and fixation and, consequently, a relatively lower growth-enhancing effect from phosphorus fertilizer compared with nitrogen and potassium (Penn and Camberato, 2019). Regression analysis of the 2023-2024 average dry weight (Fig. 2) showed that wild chive dry weight exhibited a quadratic curve, peaking at 0.5× nitrogen, 1.5× phosphorus, and 1.0× potassium before decreasing. The regression Eq. (4), (5), (6) for each fertilizer component are:
Table 5
Yield and crop growth according to fertilizer application rates of Allium monanthum
| Treatment | Yield (dry weight, kg・ha-1) | Shoot length (cm・plant-1) | No. of leaves (leaves/plant) | |||||||
| N | P2O5 | K2O | N | P2O5 | K2 O | N | P2O5 | K2O | ||
| 2023 | 0.0 | 471 | 473 | 358bc1) | 24.5 | 26.0 | 22.1bc | 4.1 | 4.0 | 3.5 |
| 0.5 | 453 | 492 | 591a | 24.5 | 23.0 | 26.4a | 4.1 | 4.0 | 4.3 | |
| 1.0 | 504 | 504 | 504ab | 23.4 | 23.4 | 23.4ab | 4.0 | 4.0 | 4.0 | |
| 1.5 | 311 | 593 | 337bc | 20.2 | 24.5 | 22.4bc | 3.9 | 4.2 | 3.6 | |
| 2.0 | 311 | 569 | 265c | 24.0 | 26.4 | 18.9c | 3.9 | 4.1 | 3.5 | |
| F-value | 1.94 | 0.40 | 4.34 | 1.94 | 0.16 | 4.90 | 0.17 | 0.10 | 2.01 | |
| 2024 | 0.0 | 498b | 461 | 494 | 37.5b | 47.9a | 47.9a | 4.2ab | 5.8 | 4.1b |
| 0.5 | 822a | 540 | 755 | 42.8a | 41.3b | 41.3b | 4.4ab | 5.1 | 4.3b | |
| 1.0 | 610ab | 610 | 610 | 42.7a | 42.7b | 42.7b | 5.1a | 5.1 | 5.1ab | |
| 1.5 | 583b | 685 | 623 | 44.5a | 44.6ab | 44.6ab | 4.8ab | 4.9 | 5.7a | |
| 2.0 | 515b | 588 | 479 | 37.0b | 43.2b | 43.2b | 3.9b | 4.6 | 4.5b | |
| F-value | 3.10 | 1.28 | 2.33 | 6.18 | 2.84 | 6.24 | 2.70 | 1.72 | 3.44 | |
| t-test2) | *** | ns | *** | *** | *** | *** | ** | *** | *** | |
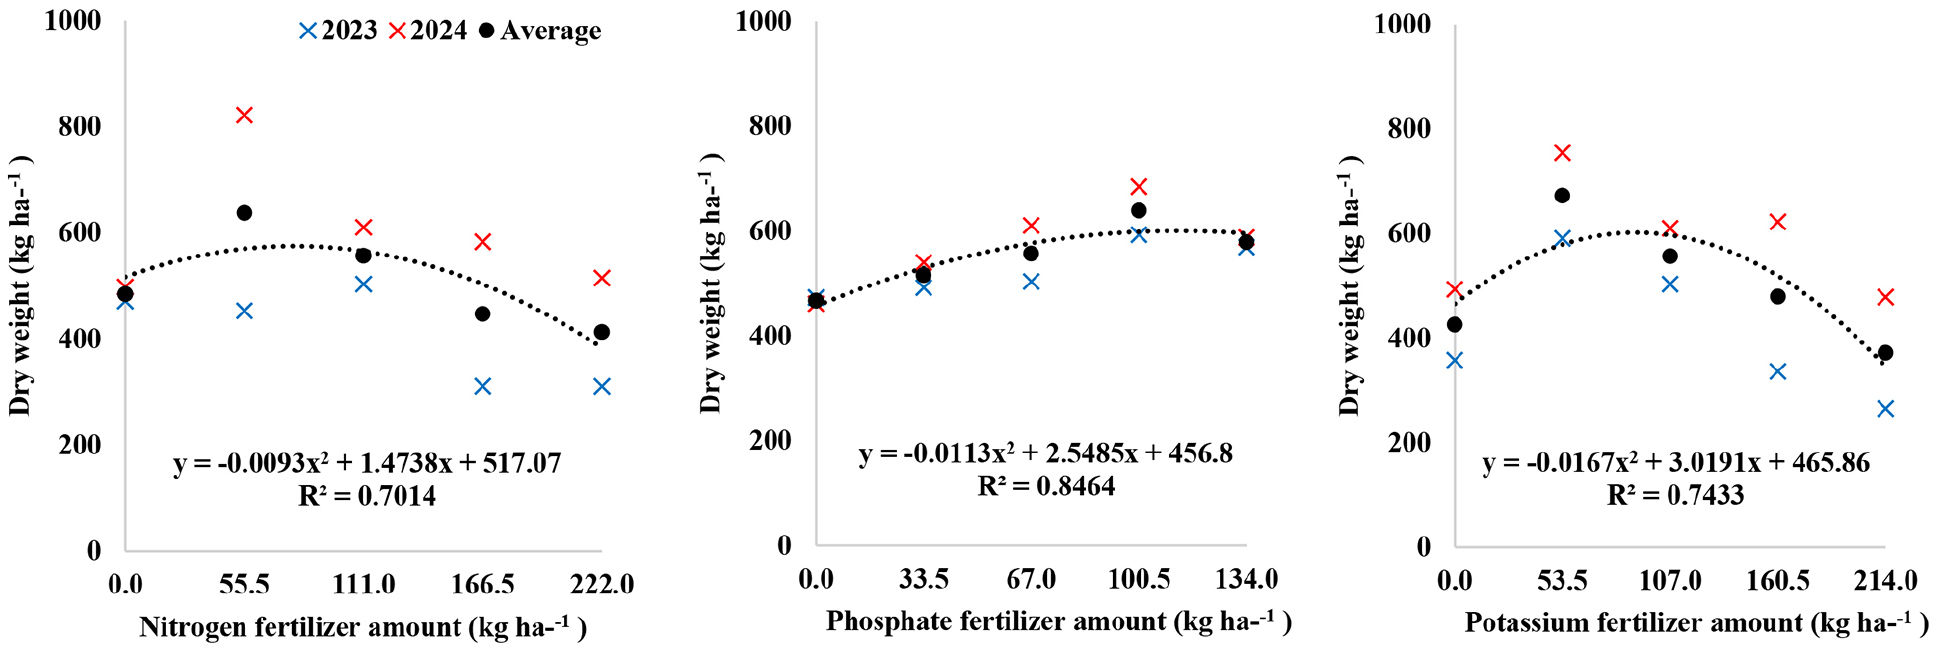
From the regression equation, the optimal application rate of N-P2O5-K2O (yielding maximum crop yield) was 79-113-90 kg・ha-1. Particularly in 2023, yields in the over-fertilized plots (1.5× or more nitrogen and potassium) were significantly lower than those in the no-fertilizer plots. This is likely due to the low organic matter content of soil in the 2023 cultivation trial, resulting in insufficient overall nutrient buffering capacity. Under these conditions, over-fertilization caused nutrient imbalance and physiological stress in the crops, leading to diminishing returns in yield. Based on these results, fertilizer application at 0.5-1.0× the standard N-P2O5-K2O (111-67-107 kg・ ha-1) rate is optimal in terms of yield increase in wild chive crops and consequently, economic viability.
Fertilizer utilization efficiency of Allium monanthum by NPK fertilizer level
The evaluation of fertilizer utilization efficiency for wild chive showed that the highest efficiency was obtained at the 0.5× application rate for all fertilizer components (N, P2O5, and K2O). Subsequently, as the application rate increased, FPFP, FAE, and FR exhibited a sharp decreasing trend (Table 6). In 2023, N-FPFP was highest at 8.2 kg・kg-1 in the 0.5× treatment and decreased to 1.4 kg・kg-1 in the 2.0× treatment. FAE was approximately 0.3 kg・kg-1 in the 1.0× treatment but turned negative at 1.5× and above, confirming the yield suppression effect due to over-fertilization. FR also peaked at 1.1% in the 0.5× treatment but turned negative at 1.5× and above, indicating that the nutrient absorption efficiency of the plant decreased with excessive fertilizer supply. In 2024, overall fertilizer utilization efficiency improved, likely due to enhanced soil fertility in the second year and the effective utilization of residual nutrients in the soil. In all fertilizer components across the 2023-2024 cultivation trials, FPFP, FAE, and FR decreased sharply in treatments exceeding 1.5× the standard rate. In some treatments, FAE and FR showed negative values, confirming that excessive fertilizer application caused growth inhibition and nutrient imbalance. In summary, the fertilizer utilization efficiency of wild chive decreased as fertilizer application rate increased beyond 1.0× of the standard rate, indicating a low yield increase relative to fertilizer input. Therefore, a fertilizer application rate of approximately 0.5-1.0× the standard rate of N-P2O5-K2O 111-67-107 kg・ha-1 is considered optimal in terms of fertilizer use efficiency and environmental sustainability.
Table 6
Fertilizer use efficiency of Allium monanthum in relation to application rates (FPFP; Fertilizer Partial Factor Productivity, FAE; Fertilizer Agronomic Efficiency, FR; Fertilizer Recovery)
| Treatment | FPFP (kg・kg-1) | FAE (kg・kg-1)1) | FR (%)2) | |||||||
| N | P2O5 | K2O | N | P2O5 | K2O | N | P2O5 | K2O | ||
| 2023 | 0.5 | 8.2a3) | 14.7a | 11.0a | -0.3 | 0.6 | 4.4a | 1.1 | 0.3 | 9.9a |
| 1.0 | 4.5b | 7.5b | 4.7b | 0.3 | 0.5 | 1.4b | 3.2 | 0.5 | 0.7b | |
| 1.5 | 1.9c | 5.9b | 2.1c | -1.0 | 1.2 | -0.1b | -1.1 | 1.0 | -1.3b | |
| 2.0 | 1.4c | 4.2b | 1.2c | -0.7 | 0.7 | -0.4b | -1.6 | 0.5 | -2.5b | |
| F-value | 17.54 | 12.53 | 39.05 | 0.78 | 0.07 | 9.51 | 2.44 | 0.21 | 13.35 | |
| 2024 | 0.5 | 14.8a | 16.1a | 14.1a | 5.8a | 2.4 | 4.9a | 14.9a | 3.3 | 13.2a |
| 1.0 | 5.5b | 9.1b | 5.7b | 1.0b | 2.2 | 1.1b | 3.7b | 1.9 | 3.7b | |
| 1.5 | 3.5bc | 6.8bc | 3.9bc | 0.5b | 2.2 | 0.8b | 3.9b | 1.0 | 3.2b | |
| 2.0 | 2.3c | 4.4c | 2.2c | 0.1b | 0.9 | -0.1b | 1.0b | 1.0 | 0.6b | |
| F-value | 51.47 | 14.90 | 41.43 | 11.47 | 0.26 | 7.16 | 16.73 | 1.73 | 8.69 | |
| t-test4) | ns | ns | ns | ** | ns | ns | ** | * | * | |
Conclusions
The effects of NPK fertilizer application rates on soil chemistry, growth and fertilizer use efficiency were evaluated in experimental cultivation of wild chive (Allium monanthum Maxim.). A survey of fertilizer usage practices at 41 wild chive farms revealed excessive accumulation of phosphorus and potassium in a high proportion of the farm soils, likely due to long-term over-fertilization. Results from cultivation trials at different fertilizer levels showed that wild chive yield peaked at 0.5-1.0× the standard N-P2O5-K2O fertilizer rate of 111-67-107 kg・ha-1 and decreased at rates exceeding 1.5× of the standard. Regression analysis indicated that maximum yield was observed at N-P2O5-K2O of 79-113-90 kg・ha-1. Furthermore, in plots treated with phosphorus and potassium at application levels of 1.5× the standard or higher, growth rates were lower than in the control plots. This suggests that using appropriate fertilizer amounts is advantageous for maintaining yield in wild chive farming. Liu et al. (2024) reported that excessive fertilizer application can disrupt nutrient balance and cause antagonistic effects in the soil, reducing root nutrient uptake. In particular, excessive nitrogen levels can delay leaf senescence and growth of other organs, ultimately leading to reduced crop growth. Fertilizer utilization efficiency (FPFP, FAE, FR) was highest at the 0.5× rate relative to the standard fertilizer application rate. Excessive fertilization showed negative values in fertilizer utilization efficiency indicators, confirming reduced efficiency due to over-application. Therefore, applying an appropriate amount of fertilizer within the standard N-P2O5-K2O application rate of 111-67-107 kg・ha-1 can balance both productivity and agricultural sustainability.
