


Introduction
Materials and Methods
Chemicals and reagents
Preparation of Complex Extract
HPLC Analysis of Marker Compounds
Method Validation
Cell Culture and Differentiation
Cell Viability Assay
Oil Red O Staining Assay
NBT Assay
Molecular Docking Analysis
Statistical Methods
Results and Discussion
Chromatographic Conditions and Specificity
Method Validation
Contents of Marker Compounds in the Complex Extract
Cell Viability
Inhibitory Effect on Lipid Accumulation
Inhibitory Effect on ROS Production
Molecular Docking Simulation of Marker Compounds with Adipogenic Targets
Conclusion
Introduction
Obesity is a chronic metabolic disorder characterized by excessive accumulation of body fat, and its prevalence has increased steadily worldwide. As obesity develops progressively and is difficult to reverse once established, its management requires approaches that can be sustained over long periods. Edible plant resources, which can be consumed continuously with minimal safety concerns, are considered promising candidates for such approaches (Malongane et al., 2017).
Adipose tissue expansion arises from both hypertrophy of mature adipocytes and differentiation of preadipocytes into adipocytes. The latter process, termed adipogenesis, is governed by a tightly regulated transcriptional cascade in which peroxisome proliferator-activated receptor gamma (PPARγ) and CCAAT/enhancer-binding protein alpha (C/EBPα) act as master regulators, subsequently inducing lipogenic enzymes such as fatty acid synthase (FAS) (Lee and Ge, 2014; Rosen and MacDougald, 2006). ROS generated during differentiation also participate in this cascade; intracellular ROS are essential regulators of adipocyte differentiation, and treatment with ROS scavengers inhibits ROS production, lipid accumulation, and the expression of adipogenic proteins in 3T3-L1 cells (Kim et al., 2017). Suppression of both lipid accumulation and ROS production has therefore been regarded as a rational strategy for anti-obesity candidates, and the 3T3-L1 preadipocyte model has been widely employed for this purpose.
Cirsium setidens Nakai and Chamaecrista nomame (Siebold) H. Ohashi are edible plants native to Korea that have long been consumed as food and used as traditional medicinal resources (Kim et al., 2026; Park et al., 2021). C. nomame in particular has a long history of consumption as a traditional functional tea in Korea and Japan and has been designated as a Traditional Knowledge Target Species by the National Institute of Biological Resources of Korea (Kim et al., 2026). Both species are rich in polyphenols and flavonoids and have been reported to exhibit antioxidant and metabolic regulatory activities (Choi et al., 2019; Park et al., 2021). Standardized extracts of each species have individually been shown to suppress adipocyte differentiation in 3T3-L1 cells and to attenuate obesity in obese mice through regulation of adipogenesis- and lipogenesis-related transcription factors (Choi et al., 2022; Heo et al., 2023). While such single-species extracts have demonstrated efficacy, their activity is often constrained by the limited range of constituents present in a single material, and combining plants with distinct phytochemical profiles has been proposed as a means of achieving effects greater than those of the individual materials through complementary mechanisms (Malongane et al., 2017).
In our previous study, a 50:50 combination of C. setidens and C. nomame extracted with 40% aqueous ethanol at 70°C for 2 h exhibited the highest antioxidant capacity among the tested conditions (Oh et al., 2025). Practical application of such a complex extract, however, requires that its quality be consistently controlled, which in turn depends on the availability of an analytical method capable of quantifying marker compounds derived from both constituent materials in a single run. Pectolinarin has been established as the representative marker of C. setidens (Jeong et al., 2013) and luteolin has been reported as the marker compound of C. nomame (Lim et al., 2025). Each compound is the established marker of its respective source material and occurs in the complex extract at a quantifiable level; their simultaneous determination therefore enables the contribution of each constituent material to be monitored, rendering the pair an appropriate index for the standardization and quality control of the complex extract. The two compounds have been quantified together in Cirsium species (Thao et al., 2011), but no method has been reported for determining markers originating from two different materials in a single run in a complex extract. Furthermore, the anti-adipogenic activity of the complex extract remains to be evaluated.
The present study therefore established and validated an HPLC method for the simultaneous determination of pectolinarin and luteolin in the C. setidens-C. nomame complex extract, evaluated its anti-adipogenic activity in 3T3-L1 adipocytes by measuring lipid accumulation and intracellular ROS production, and explored the molecular basis of the observed activity through docking of the two marker compounds with key adipogenic regulators.
Materials and Methods
Chemicals and reagents
Pectolinarin and luteolin standards, 3-isobutyl-1-methylxanthine (IBMX), dexamethasone, Oil Red O, nitroblue tetrazolium (NBT), formic acid, and dimethyl sulfoxide (DMSO) were purchased from Sigma-Aldrich Co. (St. Louis, MO, USA). HPLC-grade acetonitrile, methanol, and water were obtained from Daejung Chemical Co. (Siheung, Korea). Dulbecco’s modified Eagle’s medium (DMEM) was purchased from Lonza (Basel, Switzerland). Bovine serum, fetal bovine serum (FBS), penicillin-streptomycin, phosphate-buffered saline (PBS), and insulin were purchased from Gibco (Grand Island, NY, USA). The WelCount Cell Proliferation Assay Kit used for the cell viability assay was purchased from Welgene (Gyeongsan, Korea). All other reagents were of analytical grade.
Preparation of Complex Extract
Cirsium setidens Nakai was collected in Jeongseon-gun, Gangwon State, Korea, in April 2025 (Jeongseon Gondre Farm), and Chamaecrista nomame (Siebold) H. Ohashi was collected in Wonju-si, Gangwon State, Korea, between August and September 2024 (Gangwon Herb). Both materials were homogenized to a particle size of 20 mesh or smaller and stored at 4°C.
The complex extract was prepared by mixing the two materials at a ratio of 50:50 (w/w) under the optimal extraction conditions established in our previous study (Oh et al., 2025). This ratio was selected based on our previous study, in which complex extracts prepared at C. setidens-to-C. nomame blending ratios of 100:0, 75:25, 50:50, 25:75, and 0:100 were compared and the 50:50 formulation exhibited the highest ABTS radical-scavenging activity, ferric reducing antioxidant power, and total phenolic content among the ratios tested (Oh et al., 2025). Single extracts of C. setidens (CSE) and C. nomame (CNE) were also prepared under the same extraction conditions. Briefly, each material (or the 50:50 mixture for the complex extract) was extracted with 40% (v/v) ethanol at a solid-to-solvent ratio of 1:20 (w/v) using a circulating extractor at 70°C for 2 h, followed by filtration. The filtrates were concentrated to 15°Brix and spray-dried to obtain the corresponding extract powders.
HPLC Analysis of Marker Compounds
Simultaneous determination of pectolinarin and luteolin was performed using an HPLC system (LC-40XR Series, Shimadzu, Kyoto, Japan) equipped with a photodiode array detector (PDA). The analytical conditions are presented in Table 1.
Stock solutions of pectolinarin and luteolin were prepared individually in DMSO and diluted with methanol to give seven mixed calibration standards containing 12.5, 25, 50, 100, 200, 400 and 600 µg/mL pectolinarin and 1.5625, 3.125, 6.25, 12.5, 25, 50 and 100 µg/mL luteolin. For sample preparation, the spray-dried powder was dissolved in 40% aqueous ethanol at 30,000 µg/mL, sonicated for 20 min, and filtered through a 0.45-µm syringe filter prior to injection. The contents of the marker compounds in each sample were calculated using the corresponding calibration curves.
Table 1.
HPLC conditions for simultaneous analysis of pectolinarin and luteolin
| Instrument | Conditions | ||
| Column | CapcellPack C18 UG120 (250 × 4.6 mm, 5 µm) | ||
| Column temp. | 35°C | ||
|
Mobile phase (Gradient) | Time (min) | A1 (%) | B2 (%) |
| 0 | 92 | 8 | |
| 20 | 92 | 8 | |
| 25 | 85 | 15 | |
| 30 | 70 | 30 | |
| 35 | 30 | 70 | |
| Detector | PDA 350 nm | ||
| Flow rate | 1.0 mL/min | ||
| Injection volume | 10 µL | ||
| Run time | 35 min | ||
Method Validation
The developed method was validated according to the International Council for Harmonisation (ICH) Q2(R1) guidelines with respect to linearity, limit of detection (LOD), limit of quantification (LOQ), precision, accuracy, and recovery (ICH, 2005). Linearity was evaluated using calibration curves constructed from seven concentration levels, and the coefficient of determination (R2) was calculated. The LOD and LOQ were determined from the standard error of the y-intercept (σ) and the slope (S) of the calibration curve according to the following Eq. (1), (2).
Intra-day precision was assessed by analyzing three concentration levels in triplicate within a single day, and inter-day precision was evaluated on three consecutive days. Precision was expressed as the relative standard deviation (RSD, %). Accuracy was evaluated by standard addition: standard solutions corresponding to 50, 100 and 150 µg/mL pectolinarin and 5, 10 and 15 µg/mL luteolin were spiked into the 30,000 µg/mL sample solution, analyzed in triplicate under the same conditions, and recovery was calculated from the concentrations measured in the spiked (Cs) and unspiked (C0) sample solutions and the concentration added (Ca) according to the following Eq. (3).
Cell Culture and Differentiation
3T3-L1 preadipocytes were obtained from the American Type Culture Collection (CL-173, ATCC, Manassas, VA, USA) and maintained in DMEM supplemented with 10% bovine serum and 1% penicillin-streptomycin at 37°C in a 5% CO2 incubator. Two days after reaching confluence, differentiation was induced by replacing the medium with MDI medium consisting of DMEM containing 10% FBS, 1% penicillin-streptomycin, 0.5 mM IBMX, 1 µM dexamethasone, and 1 µg/mL insulin. The medium was subsequently changed every 2 days to DMEM containing 10% FBS and 1 µg/mL insulin until day 8.
Test samples were added throughout the differentiation period. The single extracts, CSE and CNE, and the complex extract (Mix) were dissolved in distilled water; CSE and CNE were treated at 200 µg/mL, and Mix at 100 and 200 µg/mL. The marker compounds were dissolved in DMSO and treated as a mixture of pectolinarin (1.88 µg/mL) and luteolin (0.065 µg/mL) (PEC+LUT), at concentrations corresponding to their quantified contents in Mix at 200 µg/mL; the final concentration of DMSO in the culture medium did not exceed 0.1%. Garcinia cambogia extract (GAR, 400 µg/mL), a widely used anti-obesity ingredient, was used as a positive control (Kim et al., 2008).
Cell Viability Assay
3T3-L1 preadipocytes were seeded into 96-well plates at a density of 1 × 10⁵ cells/well and differentiated with MDI medium in the presence of the test samples for 8 days. On day 8, XTT and N-methyl dibenzopyrazine methyl sulfate (PMS) reagents were mixed at a ratio of 1,000:20, added to each well, and incubated for 4 h at 37°C. The soluble formazan salt generated in the medium was measured at 450 nm against 690 nm using a microplate reader (SpectraMax i3, Molecular Devices, San Jose, CA, USA). Cell viability was expressed as a percentage relative to the untreated control.
Oil Red O Staining Assay
Lipid accumulation in 3T3-L1 cells differentiated in 24-well plates for 8 days was determined using Oil Red O staining. Briefly, the cells were washed with PBS and fixed in 10% formaldehyde in distilled water for 1 h. The cells were then dried with 60% isopropanol and stained with Oil Red O solution for 1 h, followed by washing with distilled water. The stained lipids were eluted with 100% isopropanol, and absorbance was measured at 490 nm using the microplate reader. Lipid accumulation was expressed as a percentage relative to the differentiated control.
NBT Assay
Intracellular ROS production during adipocyte differentiation was determined using the NBT assay. 3T3-L1 cells differentiated in 24-well plates for 8 days were washed twice with sterile PBS (pH 7.4) after removal of the culture medium, and 0.2 mL of 0.2% NBT solution was added to each well. After incubation for 90 min at 37°C in a 5% CO2 incubator, the dark blue formazan formed was completely dissolved with a mixture of DMSO and 1 N KOH (7:3, v/v), and absorbance was measured at 570 nm using the microplate reader. ROS production was expressed as a percentage relative to the differentiated control.
Molecular Docking Analysis
The three-dimensional structures of PPARγ (PDB ID: 2Q5S), the thioesterase domain of FAS (PDB ID: 2PX6), and C/EBPα (PDB ID: 1NWQ) were retrieved from the RCSB Protein Data Bank (https://www.rcsb.org). Chain A was used for PPARγ, chain B for FAS, and both protein chains for the C/EBPα homodimer. Water molecules, co-crystallized ligands, and other heteroatoms were removed using PyMOL 3.1.5.1 (Schrödinger, New York, NY, USA), and the bound DNA chains were additionally removed for C/EBPα. Polar hydrogen atoms and Kollman charges were added using AutoDockTools 1.5.7 (The Scripps Research Institute, La Jolla, CA, USA), and the prepared structures were saved in PDBQT format.
The three-dimensional structures of pectolinarin (PubChem CID: 168849) and luteolin (PubChem CID: 5280445) were obtained from the PubChem database, converted to PDB format using PyMOL, and prepared as flexible ligands with Gasteiger charges using AutoDockTools; 15 and 5 rotatable bonds were assigned to pectolinarin and luteolin, respectively.
Molecular docking was executed using AMDock 1.5.2 (Valdés-Tresanco et al., 2020) utilizing the AutoDock Vina 1.2.1 docking algorithm (Eberhardt et al., 2021), with an exhaustiveness of 56 and 20 output poses. For PPARγ and FAS, grid boxes were centered on the respective co-crystallized ligands, at 17.4, 19.6, 9.6 with dimensions of 23 × 23 × 23 Å and at –17.3, -6.8, 2.4 with dimensions of 27 × 29 × 34 Å. As no co-crystallized small-molecule ligand is available for C/EBPα, the grid box was centered on the DNA-binding basic region at 14.7, 2.0, 32.2 with dimensions of 26 × 32 × 40 Å. The docking protocol was validated by redocking the co-crystallized ligands into their respective binding sites. The docking results were evaluated based on binding affinity values (kcal/mol), and the poses with the lowest binding energies were selected for further analysis. Ligand efficiency was calculated as the absolute binding energy divided by the number of heavy atoms of the ligand. The interactions between the ligands and the amino acid residues within the binding pockets were visualized and analyzed using BIOVIA Discovery Studio Visualizer 2025 (Dassault Systèmes, San Diego, CA, USA).
Statistical Methods
The cell viability assay was performed in six independent experiments (n = 6), and the Oil Red O and NBT assays in three independent experiments (n = 3). Data are presented as mean ± standard deviation. Statistical analysis for each test group was performed using IBM SPSS Statistics software ver. 29 (IBM SPSS). One-way ANOVA and Duncan’s multiple range test were performed at the p < 0.05 level.
Results and Discussion
Chromatographic Conditions and Specificity
Under the established gradient conditions, pectolinarin and luteolin eluted at 16.04 and 16.99 min, respectively, and were baseline-separated within a single run (Fig. 1A). In the complex extract, both analytes were clearly resolved from adjacent matrix peaks with no interference at their retention times, confirming the specificity of the method (Fig. 1B).
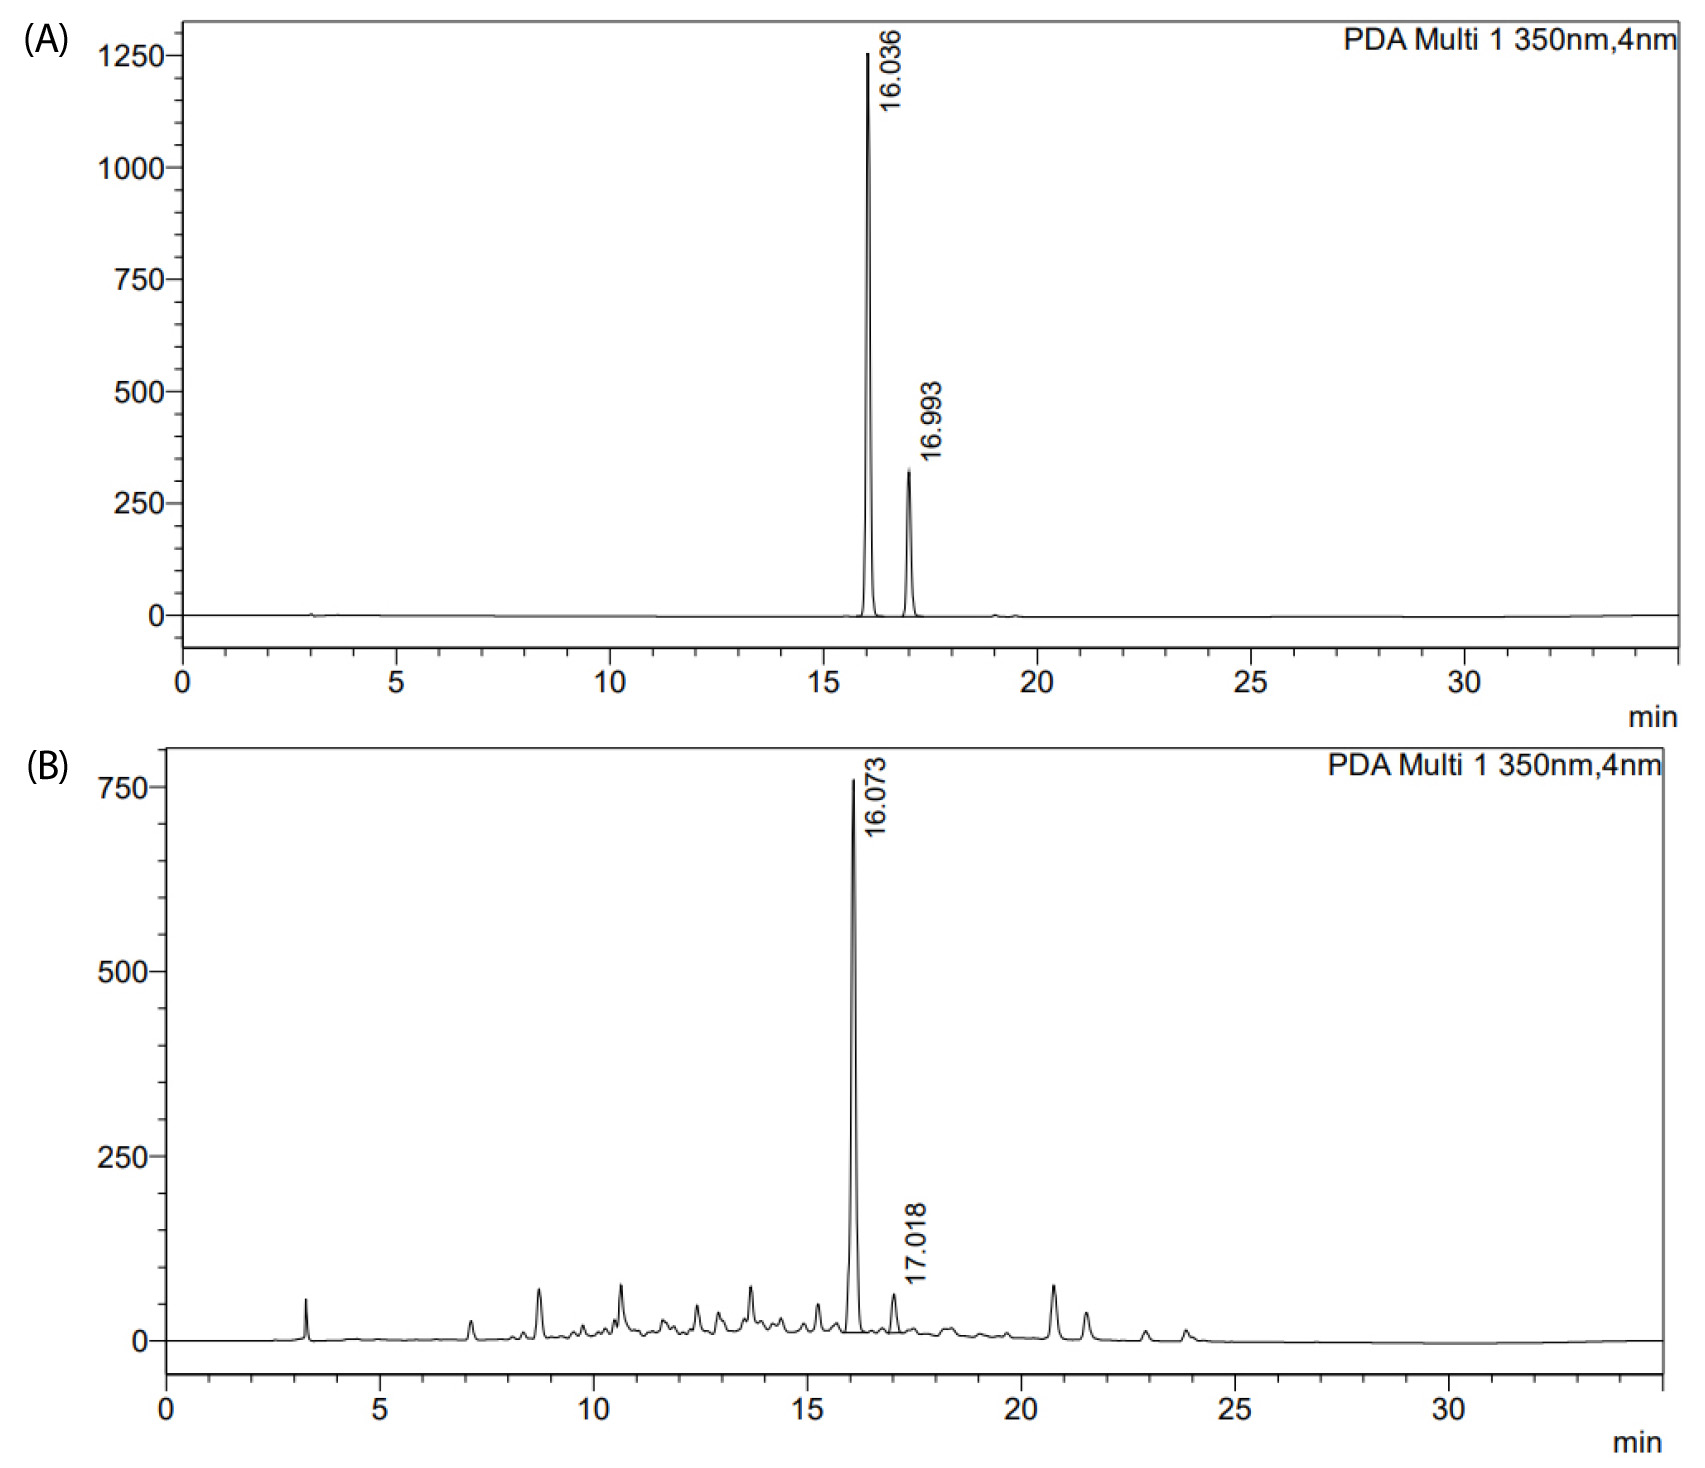
A detection wavelength of 350 nm was selected on the basis of the band I absorption of flavones, which arises from the cinnamoyl chromophore of the B-ring and appears between 320 and 385 nm. Pectolinarin has been monitored at 335 nm in C. setidens (Jeong et al., 2013) and flavonoids of Cirsium species at 254 nm (Thao et al., 2011); the wavelength adopted here lies where the band I absorptions of both analytes appear, allowing detection of the two markers at a single wavelength without switching.
Simultaneous determination from a single injection requires that both analytes fall within their respective calibration ranges at one common sample concentration. Given the approximately 29-fold difference in their contents in the complex extract, the sample concentrations satisfying this requirement span roughly 4,800 to 63,900 µg/mL, the lower bound being the point at which luteolin falls below its lowest calibration level and the upper bound the point at which pectolinarin exceeds its highest. This window of about 13-fold means that the two markers can be quantified together from a single dilution and a single injection despite their disparate abundance. A concentration of 30,000 µg/mL was adopted within this window, placing pectolinarin at approximately half of its highest calibration level and luteolin at approximately 120 times its limit of quantification. At this concentration neither analyte showed peak distortion, and specificity was retained despite the high matrix load.
Method Validation
Both calibration curves were linear with R2 values of 0.9999 (Table 2). The LOD and LOQ were 0.23 and 0.71 µg/mL for pectolinarin and 0.03 and 0.08 µg/mL for luteolin. For pectolinarin these values are lower than those of the HPLC-DAD method previously reported for C. setidens (LOD 0.52 µg/mL, LOQ 1.57 µg/mL; Jeong et al., 2013). ICH Q2, however, permits visual evaluation, the signal-to-noise ratio, and the standard deviation and slope of the calibration curve as alternative approaches, and the values obtained depend on which is used (ICH, 2005), so this comparison should be read as indicative only.
Table 2.
Linearity, LOD and LOQ of pectolinarin and luteolin
| Analyte |
Range (µg/mL) | Slope | Intercept | R2 |
LOD1) (µg/mL) |
LOQ2) (µg/mL) |
| Pectolinarin | 12.5-600 | 19290.88 | 16056.69 | 0.9999 | 0.23 | 0.71 |
| Luteolin | 1.5625-100 | 43281.93 | -9707.03 | 0.9999 | 0.03 | 0.08 |
The calibration slope of luteolin was approximately 2.2-fold that of pectolinarin, accounting for its lower LOD and LOQ. This ratio corresponds closely to the difference in molecular weight between the two compounds (622.6 versus 286.2 g/mol; Cheriet et al., 2020) and thus appears to derive largely from that difference, indicating that at equivalent mass concentration the aglycone delivers approximately twice as many chromophores to the detector. The sugar moiety of pectolinarin thus contributes mass without contributing absorbance, and the resulting sensitivity advantage for luteolin is analytically valuable given that luteolin is the minor constituent of the complex extract.
All RSD values were below 2% and recoveries ranged from 99.04 to 101.09% (Table 3), meeting the ICH criteria (ICH, 2005) and comparing favorably both with the method previously reported for C. setidens, in which intra- and inter-day RSD reached 1.65 and 2.78% and recovery spanned 98.06-105.81% (Jeong et al., 2013), and with the method reported for flavonoids of Cirsium species, in which intra- and inter-day variation was below 6% and recovery spanned 90.01-100.05% (Thao et al., 2011). Inter-day variation generally exceeded intra-day variation for both analytes, as expected from the additional sources of variability introduced across days. The absence of significant matrix interference is notable given the high sample concentration required for the determination.
Table 3.
Precision and accuracy of pectolinarin and luteolin
| Analyte |
Spiked (µg/mL) |
Intra-day recovery (%) |
RSD1) (%) |
Inter-day recovery (%) |
RSD1) (%) |
| Pectolinarin | 50 | 100.72 ± 0.25 | 0.25 | 100.27 ± 1.50 | 1.50 |
| 100 | 101.09 ± 0.68 | 0.67 | 100.99 ± 0.72 | 0.72 | |
| 150 | 100.24 ± 0.64 | 0.64 | 99.28 ± 0.66 | 0.64 | |
| Luteolin | 5 | 99.20 ± 0.49 | 0.49 | 99.04 ± 0.66 | 0.66 |
| 10 | 100.75 ± 0.25 | 0.24 | 100.91 ± 0.64 | 0.64 | |
| 15 | 99.89 ± 0.58 | 0.58 | 100.25 ± 0.66 | 0.66 |
Contents of Marker Compounds in the Complex Extract
The complex extract contained 9.39 ± 0.25 mg/g pectolinarin and 324.39 ± 7.44 µg/g luteolin (n = 3), with RSD values below 3%. At the injection concentration of 30,000 µg/mL these corresponded to approximately 282 and 9.7 µg/mL, both falling within their respective linear ranges.
Pectolinarin was present at approximately 29-fold higher levels than luteolin, reflecting the different forms in which the two compounds occur: pectolinarin accumulates as the principal flavonoid glycoside of C. setidens (Cheriet et al., 2020), whereas luteolin is an aglycone that constitutes only part of the polyphenol fraction of C. nomame (Kim et al., 2026; Lim et al., 2025). Despite this disparity, both analytes were quantified within their calibration ranges under a single set of conditions, demonstrating that the method accommodates the two markers derived from the constituent materials in one determination. As the composition of a complex extract is governed by the blending ratio, quantification of both markers provides a basis for verifying the consistency of the formulation process.
Cell Viability
Treatment with GAR (400 µg/mL), CSE (200 µg/mL), CNE (200 µg/mL), Mix (100 and 200 µg/mL) or PEC+LUT did not reduce cell viability relative to the untreated control, with all values remaining above 97% (Fig. 2). This confirmation is essential in the 3T3-L1 model, since reduced Oil Red O absorbance can arise from cell damage rather than from suppressed differentiation (Lee et al., 2013). The concentrations employed accord with those established as non-cytotoxic for C. setidens (Choi et al., 2022; Lee et al., 2013) and C. nomame extracts (Heo et al., 2023) in this cell line.
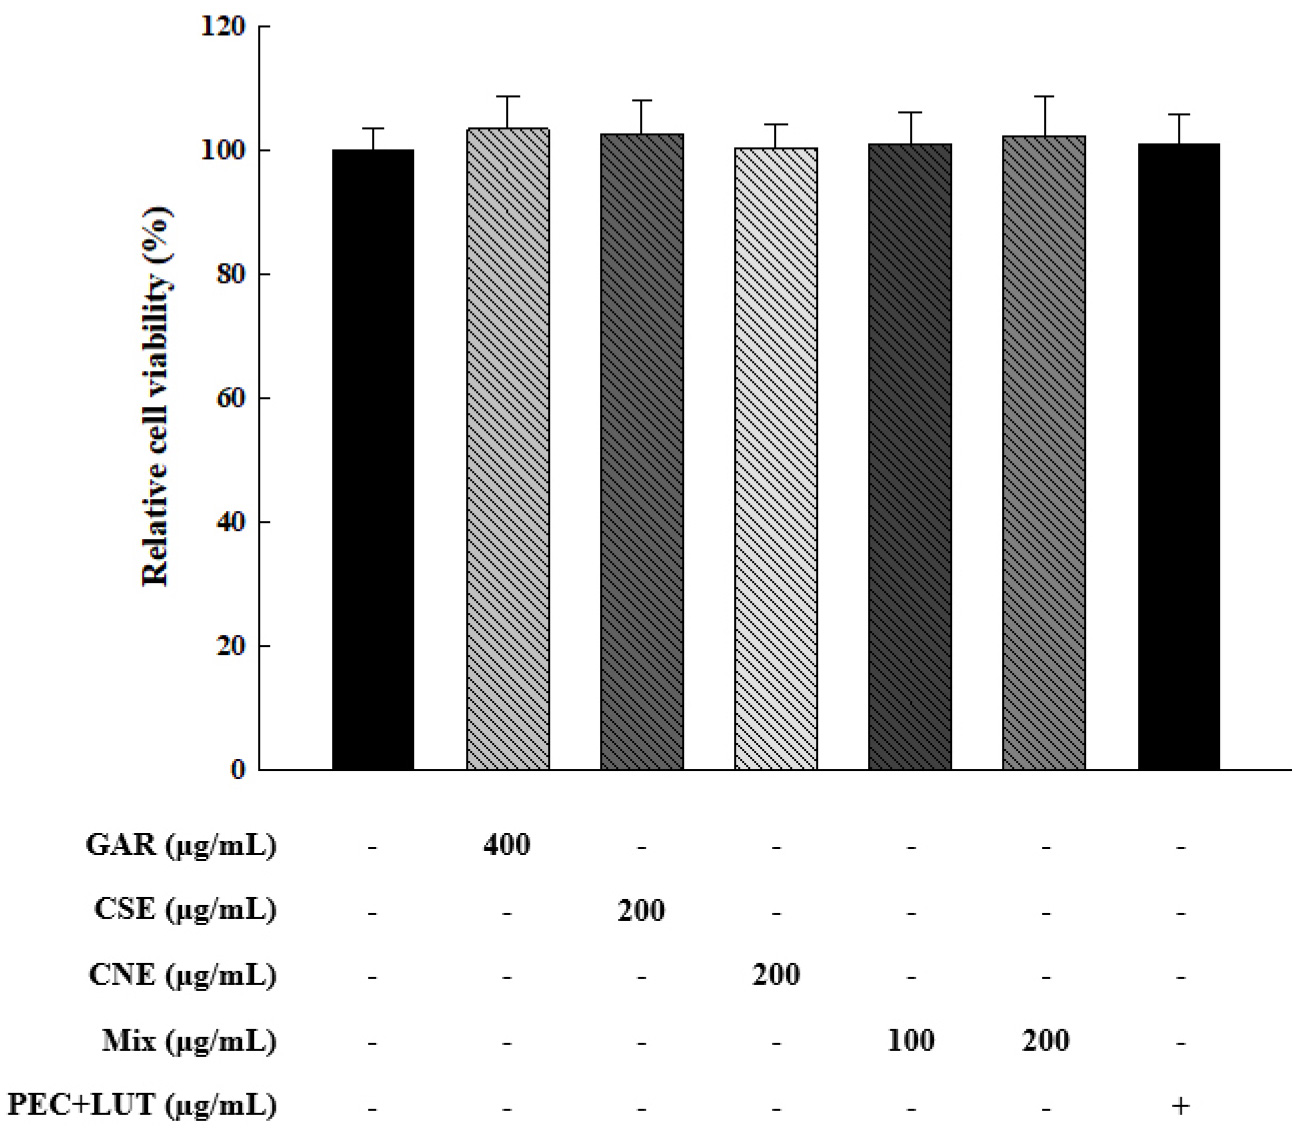
Fig. 2.
Effects of GAR, CSE, CNE, Mix, and PEC+LUT on cell viability in 3T3-L1 cells. Preadipocytes were differentiated for 8 days in the presence of each treatment and viability was determined by the XTT assay. Treatment concentrations are indicated below each bar; PEC+LUT corresponds to the quantified contents of the two markers in Mix at 200 µg/mL. Results are expressed as a percentage of the untreated control and presented as the mean ± standard deviation of six independent experiments (n = 6). No significant difference was found among the groups at p < 0.05 according to Duncan’s multiple range test. GAR, Garcinia cambogia extract; CSE, Cirsium setidens extract; CNE, Chamaecrista nomame extract; Mix, complex extract of CSE and CNE (50:50); PEC+LUT, mixture of pectolinarin (1.88 µg/mL) and luteolin (0.065 µg/mL).
Inhibitory Effect on Lipid Accumulation
At 200 µg/mL, CNE inhibited lipid accumulation more strongly than CSE (67.22 ± 3.93% versus 88.71 ± 2.43%; Fig. 3A). Both single extracts were active, consistent with previous reports that standardized extracts of each species suppress adipocyte differentiation in 3T3-L1 cells (Choi et al., 2022; Heo et al., 2023). Mix acted concentration-dependently, reducing lipid accumulation to 78.91 ± 4.07% at 100 µg/mL and to 56.37 ± 2.61% at 200 µg/mL, the latter significantly below the positive control GAR (71.96 ± 3.54%).
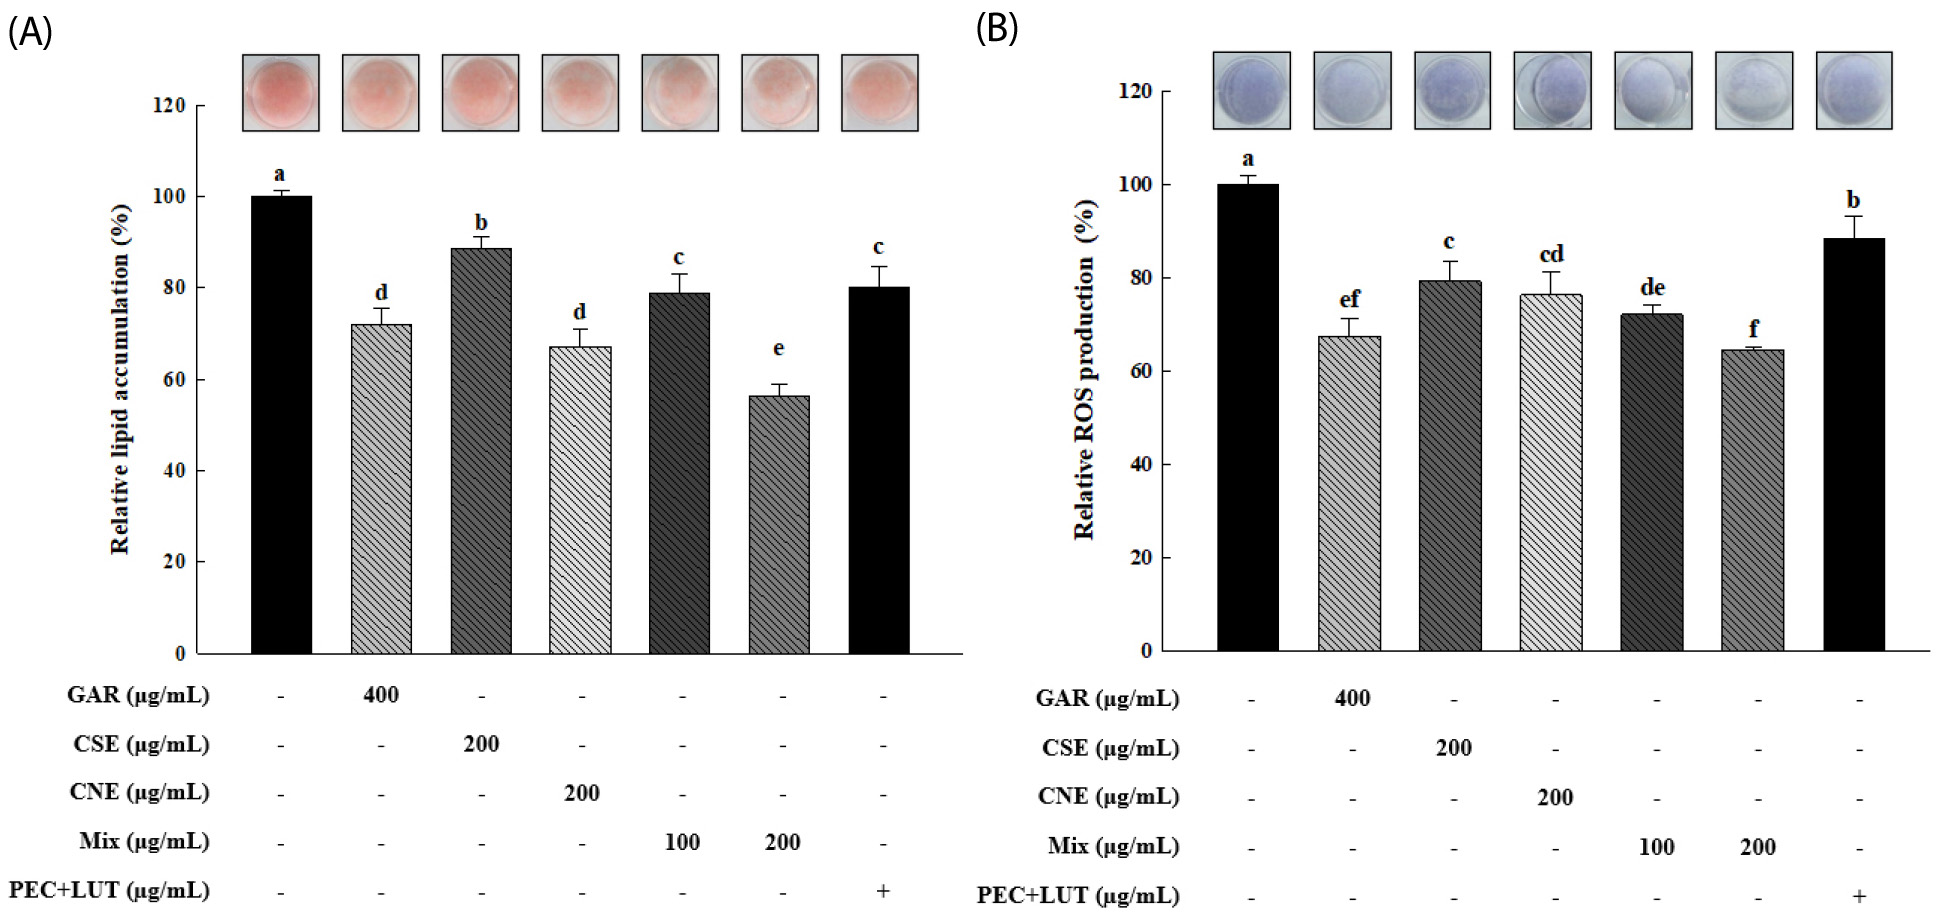
Fig. 3.
Effects of GAR, CSE, CNE, Mix, and PEC+LUT on lipid accumulation (A) and intracellular ROS production (B) in 3T3-L1 cells. Preadipocytes were differentiated for 8 days in the presence of each treatment; lipid accumulation was determined by Oil Red O staining at 490 nm and ROS production by the NBT assay at 570 nm. Representative stained wells are shown above the corresponding bars. Treatment concentrations are indicated below each bar; the marker compound group received pectolinarin and luteolin combined at the levels corresponding to their quantified contents in Mix at 200 µg/mL. Results are expressed as a percentage of the differentiated control and presented as the mean ± standard deviation of three independent experiments (n = 3). Means with different letters differ significantly at p < 0.05 according to Duncan’s multiple range test. GAR, Garcinia cambogia extract; CSE, Cirsium setidens extract; CNE, Chamaecrista nomame extract; Mix, complex extract of CSE and CNE (50:50); PEC+LUT, mixture of pectolinarin (1.88 µg/mL) and luteolin (0.065 µg/mL); ROS, reactive oxygen species.
Mix at 200 µg/mL reduced lipid accumulation below the levels observed for CSE (88.71 ± 2.43%) and CNE (67.22 ± 3.93%) at the same total concentration. Combinations of plant materials with distinct constituent profiles can yield anti-adipogenic activity exceeding that of the individual materials (Sharma et al., 2018), and the present result is consistent with such a combination effect, supporting the validity of the 50:50 formulation adopted in this study.
A plausible basis for this outcome lies in the differing flavonoid profiles of the two materials. C. setidens is characterized by the methoxylated flavone glycoside pectolinarin together with pectolinarigenin, linarin and apigenin (Cheriet et al., 2020), whereas C. nomame contains luteolin alongside proanthocyanidins and anthraquinone derivatives (Kim et al., 2026; Lim et al., 2025). Structurally distinct constituents acting at different points of the adipogenic cascade would afford broader regulation than either material alone.
PEC+LUT reduced lipid accumulation to 80.24 ± 4.45%, comparable to Mix at 100 µg/mL (78.91 ± 4.07%) but short of Mix at 200 µg/mL (56.37 ± 2.61%). The concentrations delivered were 1.88 µg/mL pectolinarin and 0.065 µg/mL luteolin, corresponding to approximately 3.0 and 0.23 µM, whereas anti-adipogenic effects of luteolin in 3T3-L1 cells are typically reported at 10-50 µM (Zhao et al., 2022). The inhibition observed at these low concentrations indicates that the two markers contribute to the activity of Mix, while the greater effect of the extract itself indicates that other constituents also participate. The markers are therefore appropriate as quantitative indicators for standardization, whereas the efficacy of the material rests on the extract as a whole.
Inhibitory Effect on ROS Production
All treatments significantly suppressed ROS production relative to the differentiated control (Fig. 3B). At 200 µg/mL, CSE and CNE reduced ROS levels to 79.19 ± 4.11% and 76.19 ± 5.07%, respectively, whereas Mix lowered ROS production to 72.09 ± 2.06% at 100 µg/mL and to 64.43 ± 0.53% at 200 µg/mL, exceeding either single extract at the same total concentration and comparable to GAR (67.44 ± 3.78%).
The parallel behavior of the two endpoints reflects their mechanistic coupling. ROS generated through NADPH oxidase 4 and mitochondrial complex III during early differentiation are required for induction of the PPARγ transcriptional machinery, and ROS-scavenging agents suppress ROS, lipid accumulation and adipogenic protein expression concurrently in 3T3-L1 cells; conversely, exogenous H2O2 accelerates differentiation with increased PPARγ expression (Kim et al., 2017). A strong correlation between lipid accumulation and ROS production has been documented for wild herb extracts in this model (R = 0.935, p < 0.05; Lee et al., 2013), supporting the interpretation that the two measurements here reflect a common mechanism.
The two materials differed in the relative magnitude of their effects across the two endpoints. CSE reduced lipid accumulation to 88.71 ± 2.43% and ROS production to 79.19 ± 4.11%, whereas CNE reduced them to 67.22 ± 3.93% and 76.19 ± 5.07%, respectively. Although values obtained from the two assays are not directly comparable in absolute terms, CNE was clearly the stronger of the two materials with respect to lipid accumulation, whereas the difference between them was small for ROS production. This suggests that the two materials engage adipogenesis through partly distinct routes, and suppression of ROS-dependent and ROS-independent components of the cascade would be expected to reinforce one another when the materials are combined.
PEC+LUT produced the weakest ROS suppression (88.40 ± 4.70%). Luteolin has been identified as the most potent ROS-reducing agent among six common dietary flavonoids in this model, ranking above quercetin, myricetin, apigenin, kaempferol and chrysin, and acting by depressing the rise in H2O2 during early differentiation (Zhao et al., 2022). The modest effect observed here is therefore attributable to the sub-micromolar concentration delivered rather than to limited intrinsic activity. The stronger performance of Mix is consistent with contributions from its broader polyphenol and proanthocyanidin content, in agreement with the antioxidant capacity previously determined for this formulation (Oh et al., 2025).
Molecular Docking Simulation of Marker Compounds with Adipogenic Targets
The docking protocol was validated by redocking the co-crystallized ligands. The redocked pose of nTZDpa reproduced the crystallographic binding mode in PPARγ with an RMSD of 0.640 Å, and for the FAS thioesterase domain the co-crystallized ligand DH9, the ring-opened hydrolysis product of orlistat, was reproduced with an RMSD of 1.07 Å over the core moiety occupying the catalytic serine site, although the RMSD for all 36 heavy atoms reached 2.54 Å owing to the flexible alkyl chains of this ligand. Redocking validation was not possible for C/EBPα, for which no co-crystallized small-molecule ligand is available.
Predicted binding energies for the three targets are given in Table 4; within each target, pectolinarin gave the lower binding energy of the two markers. Vina scores are influenced by the size and hydrophobicity of the binding site, so absolute values are not comparable across different proteins, and the discussion below is therefore based on within-target comparisons and on the interacting residues.
Table 4.
Molecular docking results of pectolinarin and luteolin with adipogenesis-related target proteins
| Target | Compound |
Binding energy (kcal/mol) | LE1) | Hydrogen bonds | Other interactions |
| PPARγ | Pectolinarin | -10.6 | 0.24 |
Arg288, Met329, Ser342, Glu343 |
Cys285, Ile341, Leu330, Leu333 |
| Luteolin | -9.1 | 0.43 | Cys285, Glu295 |
Ala292, Ile326, Met329, Leu330, Leu333 | |
| nTZDpa | -11.0 | - | - | - | |
| FAS | Pectolinarin | -7.9 | 0.18 | Ser2308, Tyr2343, His2481 | Phe2370, Glu2251, Ile2250 |
| Luteolin | -6.8 | 0.32 | Leu2222, Lys2426 | Phe2370, Glu2251, Phe2423 | |
| DH9 | -6.9 | - | - | - | |
| C/EBPα | Pectolinarin | -6.5 | 0.15 |
Ser299, Arg300, Arg306, Asn307 | Arg297, Lys304, Ala303 |
| Luteolin | -5.8 | 0.28 | Arg297, Arg300, Asp301 | Val296, Asn293, Lys304 |
Since PPARγ activation promotes rather than suppresses adipocyte differentiation, the residues engaged determine whether binding would be expected to induce or fail to induce the adipogenic program. Full agonists hydrogen-bond with Ser289, His323, His449 and Tyr473 of arm I, stabilizing helix 12 and the activation function 2 surface required for transactivation, whereas partial agonists occupy arms II and III and are instead characterized by bonding to Ser342 with contacts at Arg288, Ile341 and Cys285 (Kroker and Bruning, 2015). The poses obtained here corresponded to the latter pattern: both markers bound within arms II and III through the residues characteristic of partial agonists, including Ser342, Arg288 and Cys285 (Fig. 4A and 4B; Table 4), and neither compound engaged His323, His449 or Tyr473 (Guasch et al., 2012). The engagement of Cys285 and Arg288 by both markers is consistent with a previous report in which the binding affinity of phenolic compounds for the PPARγ ligand-binding domain correlated with their capacity to inhibit the early stage of adipogenesis in 3T3-L1 cells (Aranaz et al., 2019). Although pectolinarin gave the lower binding energy, its ligand efficiency was lower than that of luteolin (0.24 versus 0.43 kcal/mol per heavy atom), indicating that the difference derives largely from additional contacts formed by the rutinoside moiety near the pocket entrance.
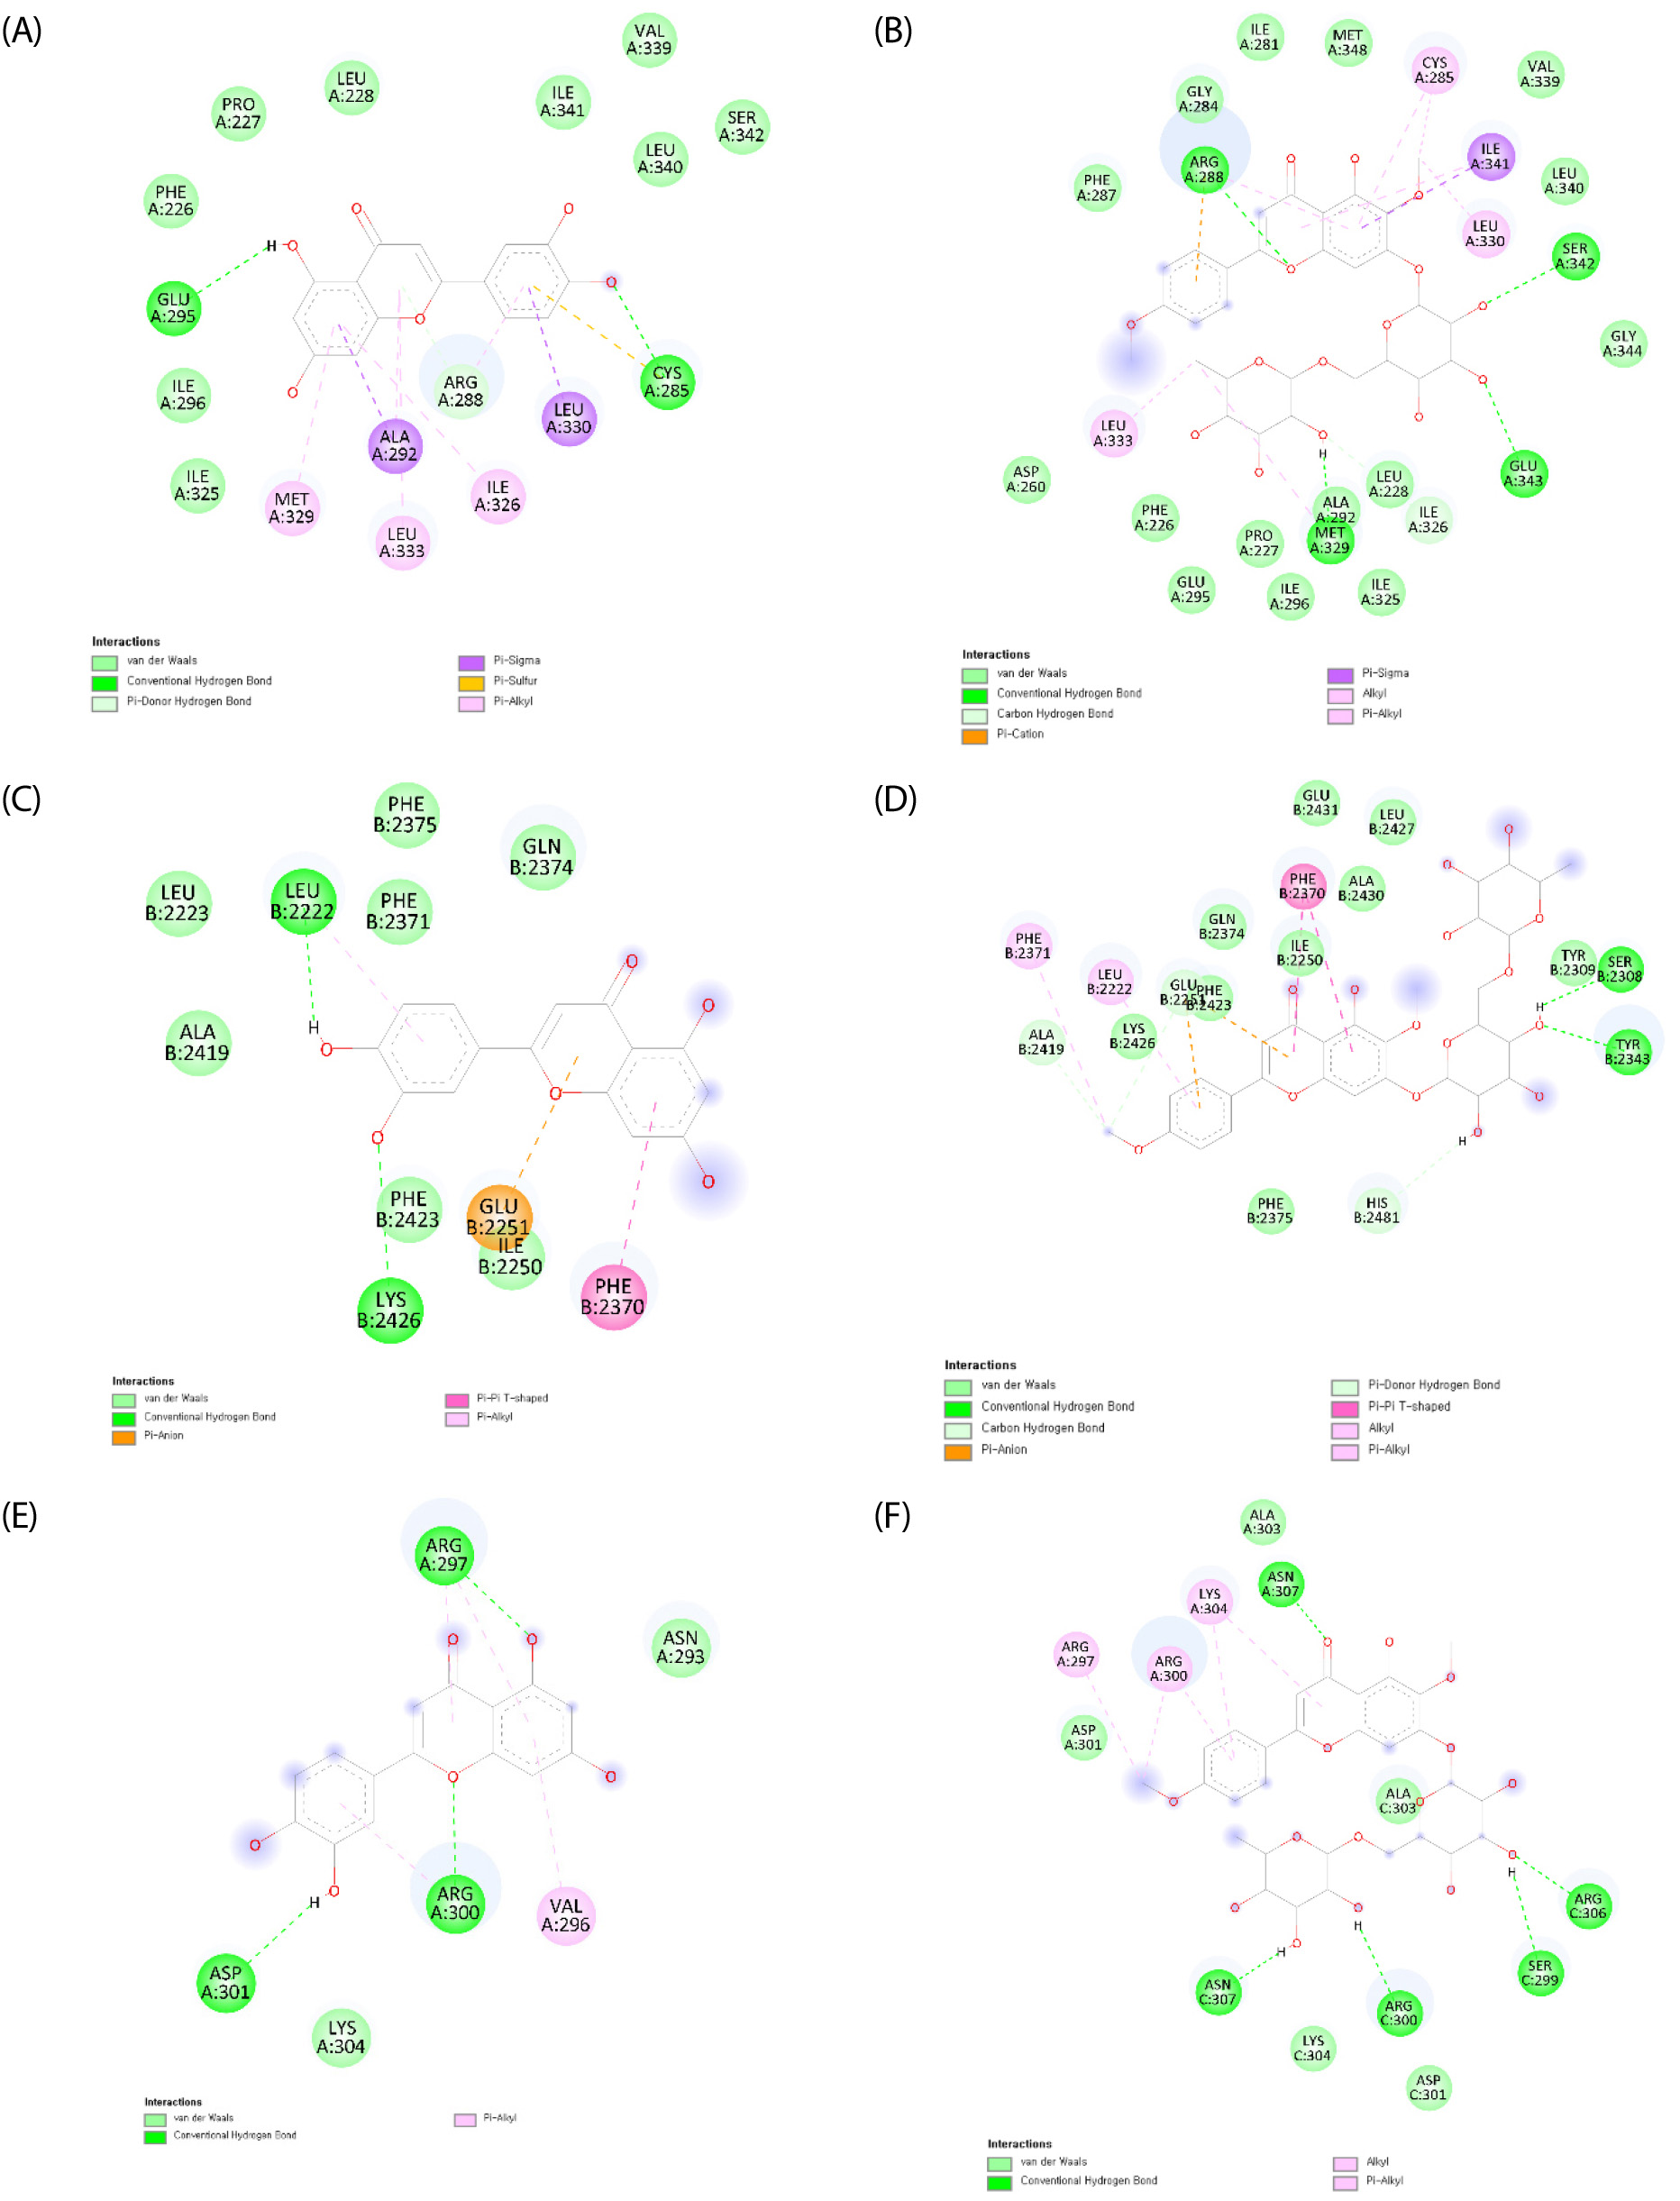
Fig. 4.
Two-dimensional interaction diagrams of pectolinarin and luteolin with adipogenesis-related target proteins. Interaction of pectolinarin with PPARγ (A), luteolin with PPARγ (B), pectolinarin with FAS (C), luteolin with FAS (D), pectolinarin with C/EBPα (E), and luteolin with C/EBPα (F). PPARγ, peroxisome proliferator-activated receptor gamma; FAS, fatty acid synthase; C/EBPα, CCAAT/enhancer-binding protein alpha.
These poses suggest that the two markers may occupy the ligand-binding pocket without stabilizing helix 12 as required for full transactivation, which would be compatible with the reduced lipid accumulation observed rather than with full agonist-mediated receptor activation. Luteolin has been shown experimentally to bind the PPARγ ligand-binding domain as a partial agonist and to antagonize rosiglitazone-induced activation (Puhl et al., 2012), consistent with the mode of binding predicted here.
In the FAS thioesterase domain, which releases the completed fatty acid chain through a Ser-His-Asp catalytic triad targeted covalently by orlistat, pectolinarin was predicted to engage two members of that triad, Ser2308 and His2481 (Fig. 4C; Table 4), whereas luteolin was predicted to bind at a peripheral site distant from the catalytic triad (Fig. 4D). Occupancy of the catalytic site would be expected to impede substrate turnover, raising the possibility that pectolinarin acts on the lipogenic axis in addition to the transcriptional axis. For C/EBPα, both markers were predicted to bind residues within the DNA-contacting basic region of the bZIP domain (Fig. 4E and 4F), but the predicted affinities were the weakest among the three targets and no redocking validation was possible, so these results are regarded as exploratory.
Taken together, the docking results suggest that both markers may engage PPARγ in a manner characteristic of partial agonists and that pectolinarin may additionally occupy the catalytic site of FAS, a profile compatible with the suppression of lipid accumulation observed in 3T3-L1 cells. These are computational predictions rather than demonstrations of binding or function. Scoring functions predict binding modes more reliably than affinities, particularly among structurally similar flavonoids (Xue et al., 2022), so the relative ranking among targets and the identity of the interacting residues carry greater weight than the absolute values. The calculations further treat the parent compounds, whereas pectolinarin is deglycosylated to pectolinarigenin in vivo (Cheriet et al., 2020), so the species reaching adipocytes may differ from that modelled. Transactivation assays for PPARγ and expression analysis of the corresponding proteins would be required to determine whether these interactions occur and whether they account for the observed activity.
Conclusion
This study established and validated an HPLC method for the simultaneous determination of pectolinarin and luteolin in a C. setidens-C. nomame complex extract and evaluated the anti-adipogenic activity of the extract in 3T3-L1 adipocytes. The developed method satisfied the ICH acceptance criteria for linearity, sensitivity, precision, and accuracy, and enabled quantification of both markers in a single run despite their substantial difference in abundance, with contents of 9.39 ± 0.25 mg/g for pectolinarin and 324.39 ± 7.44 µg/g for luteolin. The complex extract exhibited concentration-dependent inhibition of lipid accumulation and intracellular ROS production without cytotoxicity, and at 200 µg/mL its effects exceeded those of either single extract at the same total concentration. Molecular docking suggested that both marker compounds may engage PPARγ in a manner characteristic of partial rather than full agonists, providing a structural rationale for the observed activity. These findings suggest that the standardized C. setidens-C. nomame complex extract has potential as a functional food ingredient for the management of obesity. Further studies including expression analysis of adipogenic proteins and in vivo validation are required to confirm these effects.