

Introduction
Materials and Methods
Experiment materials
Inhibition of α-glucosidase activity
Preparation of DBS
Preparation of DBS-OP
Making rice porridge with DBS-OP
In vitro digestion of DBS-OP and DBS-added rice porridge
Apparent viscosity of rice porridge with DBS-OP
pH of rice porridge with DBS-OP
Chromaticity of rice porridge with DBS-OP
Flavor patterns of rice porridge with DBS-OP
Statistical analysis
Results and Discussion
Inhibition of α-glucosidase activity
DBS-OP and in vitro starch digestion of rice porridge
Apparent viscosity, pH, and chromaticity of rice porridge
Flavor patterns of rice porridge
Conclusion
Introduction
The aging of the world’s population is a global phenomenon, driven by economic growth, advances in health and medical technology, declining fertility rates, and lower child mortality rates. South Korea has entered an aging society, with about 14% of the population aged 65 and older in 2017. By 2023, the number of elderly people increased rapidly to ~18.4% of the total population and is expected to rise to 21% by 2025, entering the super-elderly society (Kim, 2024; Shin et al., 2023; Velaithan et al., 2024). As their bodies age, older adults have a variety of problems, including decreased digestion and absorption, poor mastication owing to missing teeth, decreased muscle strength, and decreased activity levels (Shin et al., 2016; Jang et al., 2021). In particular, poor swallowing function is a serious problem for older adults, affecting 68% of older adults in nursing homes and 30% of older adults in hospitals (Methacanon et al., 2021; Qin et al., 2024). Therefore, older adults prefer foods that are easy to chew and digest and consume fewer hard or tough meats and vegetables, resulting in poor nutritional intake of nutrients such as protein, vitamins, and minerals (Kim, 2024; Shin et al, 2016).
Starch-based foods are easy to chew and digest, making them a favorite among older adults, and they are often consumed in larger quantities than other food groups. This results in a relatively higher proportion of carbohydrate intake than other nutrients in older adults (Choe, J.-S., Paik, 2004; Methacanon et al., 2021; Shin et al., 2016). Carbohydrates are an important food component in starchy foods (rice, wheat, corn, potatoes), which provide the body with the energy it needs, but (Lal et al., 2021) older adults have difficulty controlling blood sugar when consuming carbohydrates owing to lower insulin sensitivity. High-carbohydrate diets cause a sharp rise in postprandial blood sugar in older adults, increasing their risk of developing type 2 diabetes and metabolic syndrome. Specifically, excessive consumption of refined carbohydrates can lead to blood sugar spikes, which can cause blood sugar fluctuations and increase the risk of developing cardiovascular disease (Hanssen et al., 2020; Lal et al., 2021; Russell et al., 2016). Consequently, senior-friendly foods that do not spike blood sugar are urgently needed.
The main enzymes involved in starch digestion in humans are known as α-amylase and α-glucosidase. α-Amylase is an enzyme produced in the salivary glands and pancreas that hydrolyzes starch into maltose and dextrin, which are degraded into glucose by α-glucosidase in the small intestine for intestinal absorption. Inhibition of this enzyme activity can effectively slow the rate of starch hydrolysis, lowering the risk of blood sugar spikes (Kam et al., 2013; Li et al., 2022b). Previous studies have shown that some compounds in food ingredients can inhibit α-glucosidase. Polyphenols (Oboh et al., 2016; Wang et al., 2022; Xue et al., 2020), such as quercetin, rutin, gallic acid, chlorogenic acid, and tannic acid, have been reported to inhibit α-glucosidase, as have other saponins (Hanh et al., 2016; Sanneur et al., 2023).
Quercetin is a flavonoid polyphenol compound found in high amounts in foods such as onion skins, apples, and green tea. Quercetin has been found to have good inhibitory potential, with the IC50 values of α-glucosidase being similar to or lower than those of acarbose (Oboh et al., 2015; Ren et al., 2024; Yang et al., 2021). However, quercetin may be affected by the human digestive process, as it can aggregate and partially degrade at low pH (Bhatia et al., 2022).
Targeted delivery of food ingredients by encapsulation can protect bioactive materials in the stomach during human digestion and improve their bioavailability upon release in the small intestine (Cohen et al., 2011). Debranched starch (DBS) is a linear short-chain starch whose 1,6-α-D-glucoside bonds have been selectively hydrolyzed by debranching enzymes (isoamylase or pullulanase) (Feng et al., 2020). It and can effectively encapsulate bioactive materials through a recrystallization process. Recrystallized DBS is relatively slow to degrade by digestive enzymes and has sustained release properties. This has the potential to protect the bioactive material during the digestive process while allowing for a slow release (Xiao et al., 2023).
To develop materials that can be added to starch-based foods to suppress rapid blood sugar spikes, this study selected candidate active materials by analyzing the inhibitory activity of various polyphenolic materials on α-glucosidase. Extracts rich in selected active ingredients, such as onion peel (OP) extract, were encapsulated using DBS, and starch digestion was simulated to examine the stability and selective release of the candidates. To verify the utilization of the developed material as an aging-friendly food material, OP encapsulated with DBS (DBS-OP) was added to rice porridge to evaluate its inhibitory activity on starch digestion as well as the changes in the physical and chemical properties of rice porridge.
Materials and Methods
Experiment materials
Glutinous corn starch purchased from Samyang Corp. (Seoul, Korea) was used for this study. OP was purchased from Ntradekoreafood Corp. (Namyangju, Korea). Quercetin (catalog no. 84510), gallic acid (catalog no. G7384), rutin (rutin hydrate, catalog no. R5143), saponins (catalog no. Q4951), chlorogenic acid (catalog no. 84510), glucosidase from Aspergillus niger (catalog no. 49291), mucin from porcine stomach (catalog no. M1778), 𝛼-amylase from Aspergillus oryzae (catalog no. 100654), pepsin from porcine gastric mucosa (catalog no. P7125), pancreatin from porcine pancreas (catalog no. P7545), lipase from Candida rugosa (catalog no. L1754), bovine serum albumin (BSA; catalog no. A4737), and bile extract porcine (catalog no. B8631) were purchased from Sigma-Aldrich Corp. (St. Louis, MO, USA). Dimethyl sulfoxide (DMSO; 99.5%, catalog no. 67-68-5) and ethanol (94.5%, catalog no. 64-17-5) were purchased from Daejung Chemicals & Metals Corp. (Siheung, Korea). Pullulanase (DIAZYME P20, IMCD N.V., Co. Ltd., Rotterdam, the Netherlands) and sodium azide (≥ 99%, catalog no. 26628-22-8, Alfa Aesar Co., Ltd., Heysham, UK) were also purchased and used. All chemicals used in this study were at least analytical grade, and deionized (DI) water was used to prepare the solvents for experiments.
Inhibition of α-glucosidase activity
Rutin, gallic acid, saponins, and chlorogenic acid were prepared as 100 mM solutions using DI water, and quercetin was prepared as 10, 50, and 100 mM solutions using 5% DMSO. For OP, 0.1%, 0.5%, 1%, 3%, 5%, and 10% solutions were prepared with DI water. Each solution was mixed with α-glucosidase in a 1:1 ratio (v/v). As a control, water or 5% DMSO was mixed with α-glucosidase in a 1:1 ratio (v/v). α-Glucosidase inhibition assays were performed using an α-glucosidase activity assay kit (Sigma-Aldrich Ltd., St. Louis, MO, USA) according to the manual. Then, the inhibitory activity was calculated according to the following equation:
α-glucosidase activity inhibition rate (%) = (α-glucosidase activitySample/α-glucosidase activityControl) × 100
Preparation of DBS
DBS was prepared by modifying the method described in Chung et al. (2022). Briefly, a 3% cornstarch dispersion was stirred with a heated stirrer (MaXtir 500H, DAIHAN Scientific Co. Ltd., Gangwon, South Korea) at 100°C, 450 rpm for 30 min and then cooled. Subsequently, 15 mL of 40 mM sodium acetate buffer (0.2% sodium azide, w/v, pH 4.0) and pullulanase (90 u/g of starch) were added, followed by reaction in a thermostatic water bath (Maxturdy-30, DAIHAN Scientific Co. Ltd, Seoul, Korea) at 58°C for 24 h. After the reaction, the enzyme was inactivated at 100°C for 15 min and cooled by stirring at 450 rpm for 1 h. Then, 400 mL of 94.5% ethanol was slowly added dropwise, and the solution stirred at 450 rpm for 30 min. Afterwards, the samples were centrifuged at 3620 rpm for 20 min (LaboGene 1580R, GUROZEN Co., Ltd., Seoul, Korea) to separate the precipitate, which was washed at 450 rpm for 5 min by adding 100 mL of ethanol. This process was repeated twice with 70% ethanol and once with 94.5% ethanol. The washed DBS was dried overnight at 35°C in a desiccator (Gravity-air Incubator Thermo Stable TM IG, Daihan Scientific Co., Ltd., Seoul, South Korea), ground with a mortar and pestle, and sieved through a 120 mesh sieve. The prepared DBS was stored at -20°C.
Preparation of DBS-OP
First, 40 g of OP and 20 g of DBS were added to 1.2 L of DI water and stirred for 60 min at 450 rpm using a hotplate stirrer. The samples were then spray dried using a spray dryer (ADL311SA, Yamato Scientific Co., Ltd., Tokyo, Japan) with an inlet temperature of 140°C, flow rate of 2.6 mL/min, and spray air pressure of 0.15 MPa. DBS-OP was stored in the dark at -20°C.
Making rice porridge with DBS-OP
First, 200 g of instant rice (Ottogi Co., Ltd., Anyang, South Korea) and 600 mL of DI water were mixed and stirred at 95 ± 5°C, 450 rpm for 30 min. The solution was then cooled from room temperature to 50°C, and 0%, 0.1%, 0.5%, 1%, 3%, and 5% (w/w) of DBS-OP was added. The rice porridge with DBS-OP was stirred at 450 rpm for 30 min and used for the assay.
In vitro digestion of DBS-OP and DBS-added rice porridge
The in vitro digestion of DBS-OP and DBS-added rice porridge was evaluated using the method described in Choi et al. (2025). Briefly, 5 g of DBS-OP or rice porridge was mixed with 6 mL of simulated saliva and reacted for 5 min at 37°C, 60 rpm using a thermostatic water bath. After oral digestion, 12 mL of simulated gastric juice was added and allowed to react for 2 h. Finally, 12 mL of simulated duodenal juice, 6 mL of simulated bile juice, and 2 mL of 1.01 M NaHCO3 solution were added and allowed to react for 2 h. The compositions of simulated saliva, gastric juice, duodenal juice, and bile juice are shown in Table 1 (Choi et al., 2025). DBS-OP digestive juice was collected after simulated oral and gastric digestion and at 30, 60, 90, and 120 min during intestinal digestion. In addition, rice porridge digestive juice with DBS-OP was collected after 120 min of simulated intestinal digestion. The collected digestive fluids were diluted 10-fold with ethanol to inactivate the enzyme, and the supernatant was separated via centrifugation at 3620 rpm for 10 min. The glucose content of the supernatant was analyzed according to the manual of the D-glucose assay kit (Megazyme Ltd., Bray, Ireland), and the starch digestibility of DBS-OP was calculated using the following equation:
Digestibility (%) = Free glucose content/Total glucose content × 100
Th starch digestion inhibition rate of rice porridge with DBS-OP was calculated by partially changing the equation described by Kan et al. (2020). For rice porridge without DBS-OP as a control, the rate was calculated using the following equation:
Starch digestion inhibition rate (%) = 1 - (glucose contentSample/glucose contentControl) × 100
Table 1
Composition of simulated saliva, gastric juice, duodenal juice, and bile juice for in vitro digestion
Apparent viscosity of rice porridge with DBS-OP
The apparent viscosity of rice porridge with DBS-OP was analyzed using a viscometer (DV2TLVTJ0, Brookfield Engineering Laboratories, Inc., Middleboro, MA, USA). Then, 30 g of rice porridge was placed in a 50 mL conical tube, and the temperature was maintained at 25°C for 30 min in a thermostatic water bath (CT-VB-7, CORETECH, Anyang, South Korea). The apparent viscosity was measured using a Spindle LV-5 (Brookfield Engineering Laboratories, Inc., Middleboro, MA, USA) at 25 rpm for 10 min at 1 min intervals.
pH of rice porridge with DBS-OP
The pH of the rice porridge with DBS-OP was analyzed using a pH meter (Orion Star A211 Benchtop pH Meter, Thermo Fisher Scientific Co. Ltd., Massachusetts, USA). Rice porridge (30 g) was placed in a 50 mL conical tube and measured at room temperature.
Chromaticity of rice porridge with DBS-OP
The chromaticity of the rice porridge was evaluated using a Chroma Meter (CR-300, Konica Minolta, Tokyo, Japan). The chromaticity was expressed using the CIE (L, a, b) color space, where L stands for lightness, a for redness/greenness, and b for blueness/yellowness. The color difference (ΔE) between rice porridge without DBS-OP and rice porridge with DBS-OP as a control was calculated using the following equation:
ΔE = ((Lcontrol - LSample)2 + (acontrol - aSample)2 + (bcontrol - bSample)2)1/2
Flavor patterns of rice porridge with DBS-OP
The flavor pattern of rice porridge with DBS-OP was analyzed using an E-nose (GC type E-Nose Heracles NEO, Alpha M.O.S., France). Rice porridge (5 g) was placed in a 20 mL E-nose vial (Heracles NEO, CENTUMTECH co., Ltd, Seoul, South Korea) and kept in an E-nose incubator under the conditions of 55°C, 10 min, and 500 rpm. The rice porridge was then analyzed with an injection volume of 1000 µL, injection rate of 125 µL/s, time of 13 s, and injector temperature of 200°C. The data from each sample was analyzed by performing principal component analysis (PCA) of all peak areas of the rice porridge flavor components using Alpha Soft version 12.46 (Alpha M.O.S.).
Statistical analysis
Statistical analysis was performed by one-way ANOVA using SPSS Statistics software (IBM SPSS Statistics 26 software, IBM, Chicago, IL, USA), and significance between samples was compared at the p < 0.05 level using Duncan’s multiple range test. Additionally, the relationships between the analyzed data were assessed using Pearson’s correlation analysis.
Results and Discussion
Inhibition of α-glucosidase activity
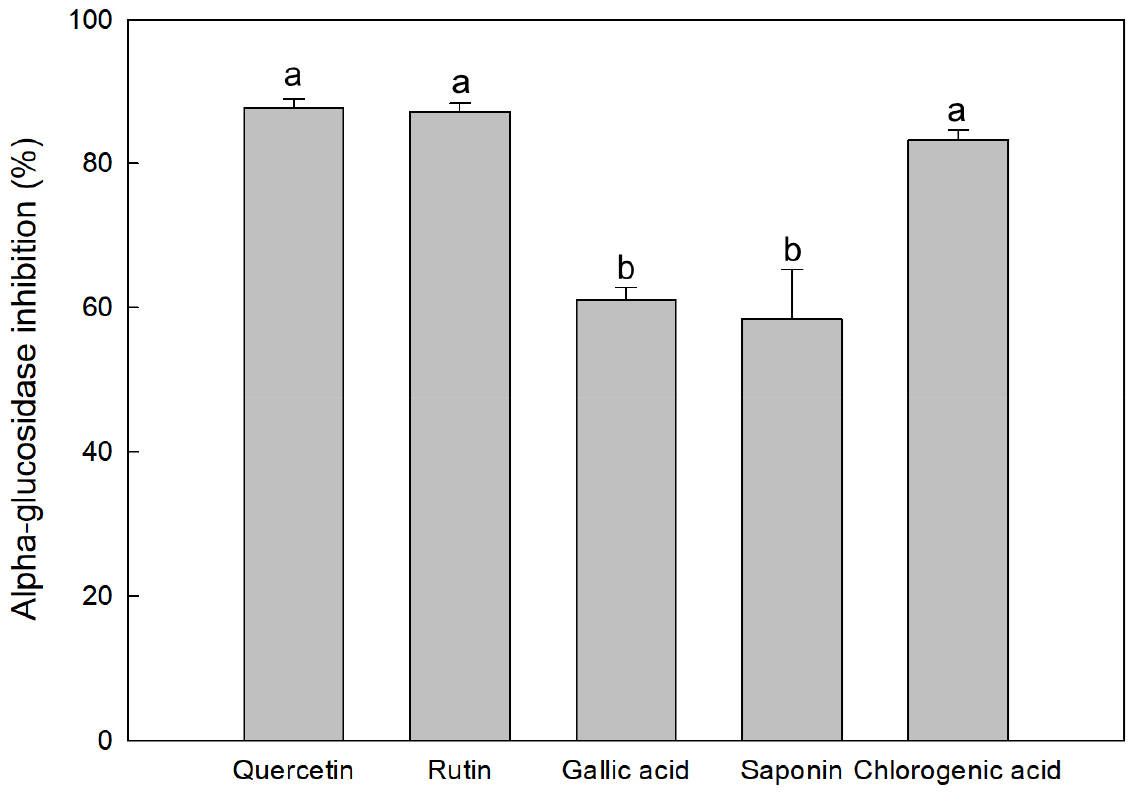
The inhibition of α-glucosidase activity by different types of digestion-resistant components is shown in Fig. 1. The α-glucosidase activity inhibition rates of quercetin, rutin, and chlorogenic acid were high, at 87.72% ± 1.19%, 87.21% ± 1.20%, and 83.31% ± 1.32%, respectively. In particular, quercetin showed the best effect, with an inhibition rate of 87.72% ± 1.20%. By contrast, gallic acid and saponins showed relatively low inhibition rates of α-glucosidase activity, that is, 60.99% ±1.80% and 58.37% ± 6.93%, respectively. Li et al. (2009) reported that quercetin and rutin potently inhibited α-glucosidase, with quercetin exhibiting higher IC50 values than rutin. Furthermore, with a reported IC50 value of 9.27 µg/mL, chlorogenic acid has a high inhibitory effect; by comparison, the IC50 value of acarbose is 673.29 ± 53.04 µg/mL (Pérez-Nájera et al., 2018). On the other hand, saponins and gallic acid have been reported to have lower inhibition rates of α-glucosidase activity than acarbose (Li et al., 2022a; Oboh et al., 2015).
The inhibition rate of α-glucosidase activity with respect to quercetin concentration is shown in Fig. 2A. At concentrations of 10, 50, and 100 mM of quercetin, the inhibition rates of α-glucosidase activity were 79.70% ± 0.76%, 80.65% ± 0.38%, and 87.72% ± 0.19%, respectively. The inhibition of α-glucosidase activity by quercetin was concentration-dependent and positively correlated (r = 0.939, p < 0.05) (Zhang et al., 2017). These results are consistent with the present study, in which the α-glucosidase activity inhibition rate increased as the quercetin concentration increased to 66, 198, and 330 µM.
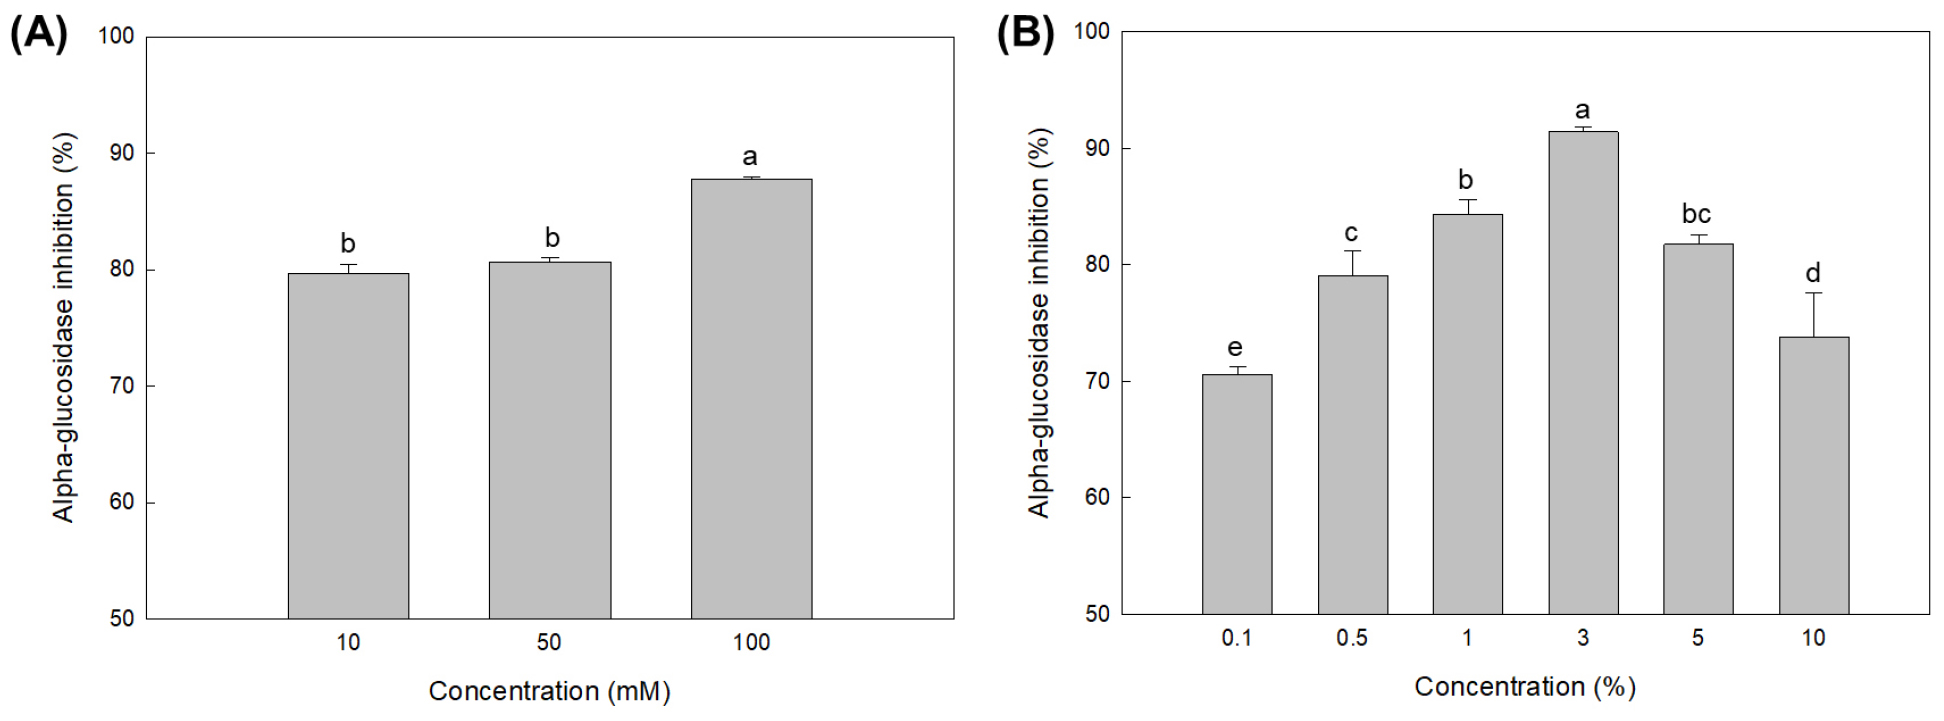
Ethanol-extracted OP is reported to have a 614.67 ± 14.51 mg/g total phenolic content and 227.96 ± 14.27 mg/g total flavonoid content. In particular, the quercetin content was found to be 101.28 ± 6.95 mg/g, accounting for ~44% of the total flavonoids (Jeon et al., 2012). Therefore, OP extracts may be effective in inhibiting α-glucosidase activity. The inhibition of α-glucosidase activity as a function of OP extract concentration is shown in Fig. 2B. The inhibition rate of α-glucosidase activity of OP extract gradually increased from 0.1% (70.56% ± 0.67%) to 3% (91.41% ± 0.41%) - the highest inhibition rate - followed by a significant decrease in inhibition rate at 5% and 10% to 81.75% ± 0.82% and 73.82% ± 3.79%, respectively. At a higher concentration of OP extract, quercetin may have aggregated, reducing its interaction with α-glucosidase. At 5% and 10% concentrations, the viscosity of the solution increased, presumably reducing the physical contact of the enzyme with the substrate (Uribe and Sampedro, 2003).
DBS-OP and in vitro starch digestion of rice porridge
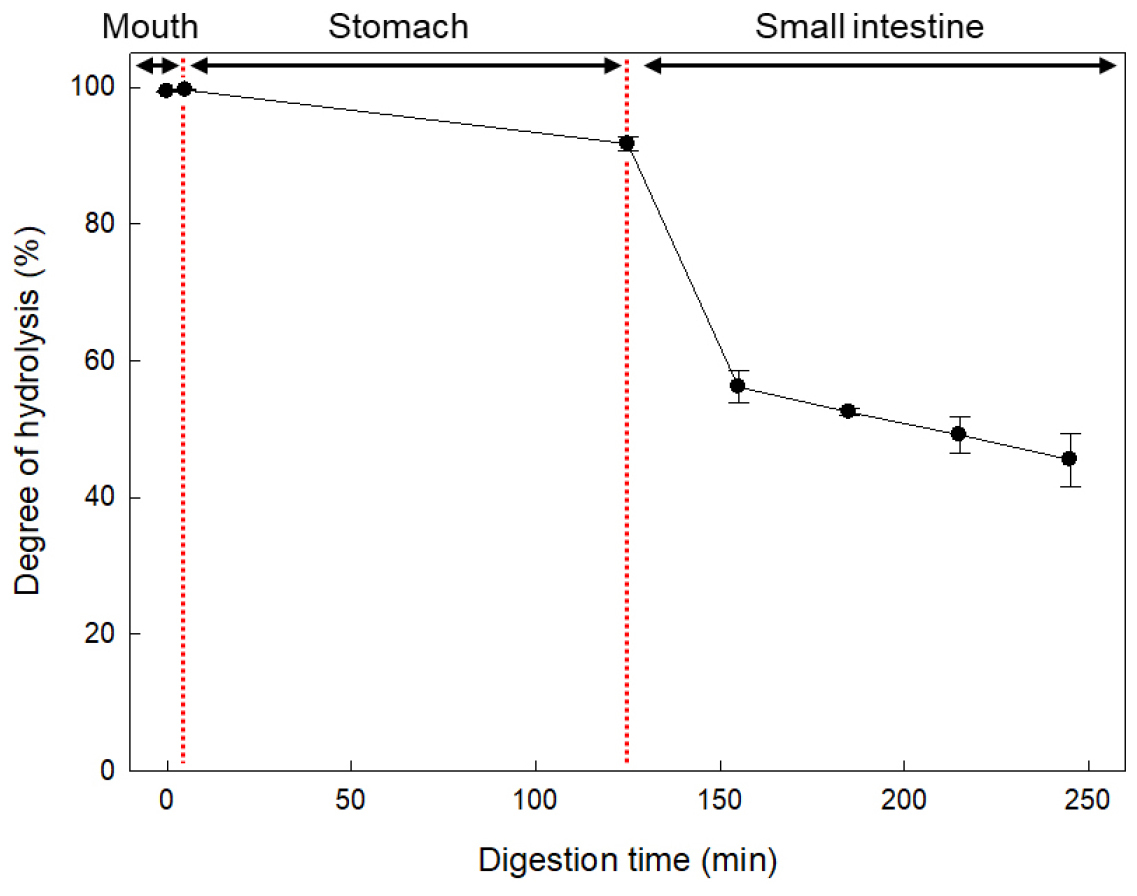
Quercetin can effectively inhibit starch digestive enzymes in the small intestine, but it can aggregate and to some extent degrade at low pH, requiring protection in the stomach for effective delivery to the small intestine (Bhatia et al., 2022). The bioavailability of bioactive substances encapsulated by DBS has been reported to increase (Xiao et al., 2023). Therefore, OP extracts were encapsulated with DBS to increase their stability in the physicochemical environment during digestion. Fig. 3 shows the in vitro starch digestion of DBS-OP. The starch hydrolysis rate of DBS-OP did not change from 99.36% ± 0.05% before in vitro digestion to 99.59% ± 0.12% after simulated oral digestion and mildly hydrolyzed (< 10%) after simulated gastric digestion. On the other hand, after 30 min of simulated intestinal digestion, it rapidly hydrolyzed by 43.86% ± 2.37%, indicating a large initial release. The starch hydrolysis percentages after 60, 90, and 120 min of simulated intestinal digestion were 47.51% ± 0.47%, 50.86% ± 2.63%, and 54.50% ± 3.89%, respectively, indicating that the starch slowly hydrolyzed, resulting in sustained release. Materials encapsulating drugs with DBS have been reported to have sustained release properties (Hong et al., 2019; Liu et al., 2015). In addition, DBS-OP did not completely hydrolyze during the simulated intestinal digestion phase. This phenomenon may be due to the high relative crystallinity of DBS, which may make it less susceptible to digestive enzymes (Qin et al., 2019), and high levels of resistant starch (RS) compared with normal starch have been reported to directly correlate with slower digestion (Remanan and Zhu, 2024). RS has additional health benefits because starch that is not fully hydrolyzed can be utilized as a prebiotic by beneficial gut bacteria in the colon (Zaman and Sarbini, 2016).
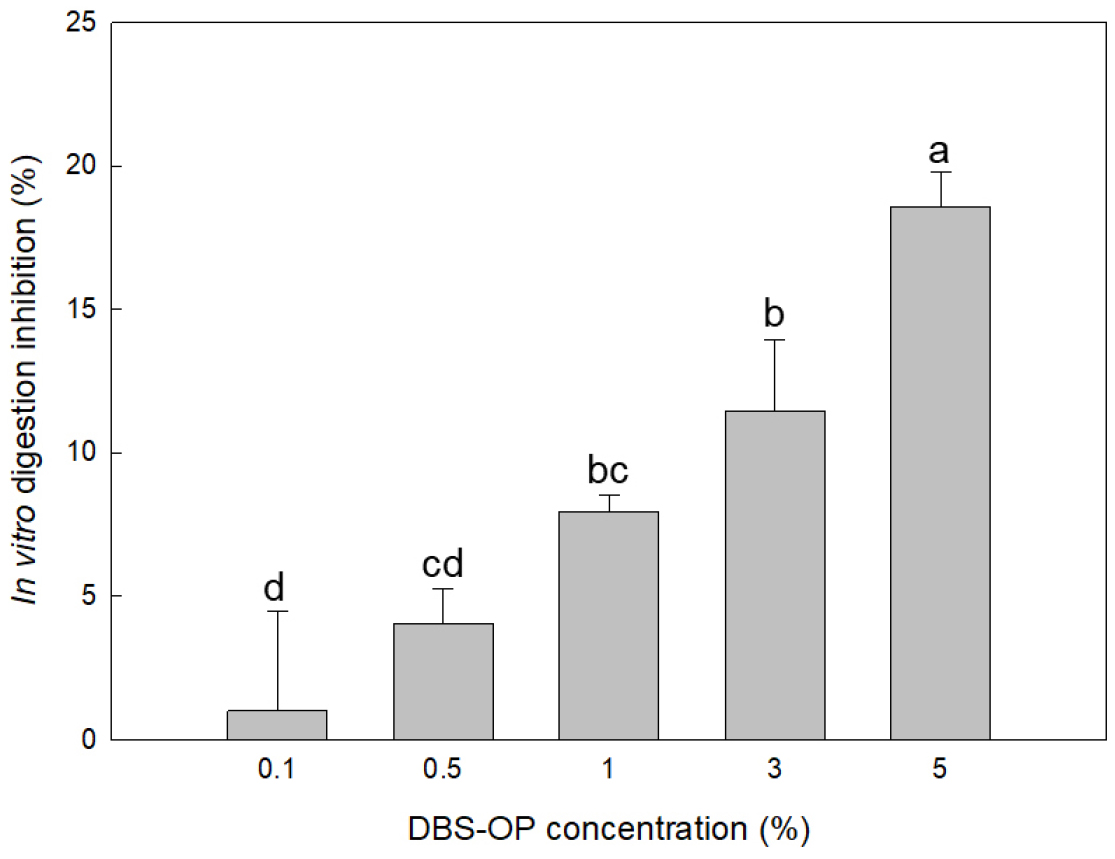
The inhibition rate of in vitro starch digestion of rice porridge as a function of DBS-OP addition is shown in Fig. 4. Starch digestion inhibition gradually decreased from rice porridge, with 0.1% DBS-OP (1.01% ± 3.46%), to rice porridge with 5% DBS-OP (18.58% ± 1.21%). The inhibition rate of in vitro starch digestion by DBS-OP was concentration-dependent and positively correlated (r = 0.976, p < 0.05). These results showed a similar trend to the α-glucosidase activity inhibition rate results. By contrast, some different patterns from the inhibition rate of α-glucosidase activity at higher concentrations were observed. The starch hydrolysis rate of DBS-OP after previous simulated intestinal digestion was 54.50% ± 3.89%, indicating that the OP was not completely released, and due to its sustained release characteristics, it was not released at once, but had a sustained digestive enzyme inhibition effect (Hong et al., 2019; Liu et al., 2015). Therefore, at a certain concentration, DBS-OP had a good digestion-resistant effect when added to rice porridge, a senior-friendly food.
Apparent viscosity, pH, and chromaticity of rice porridge
The apparent viscosity of the rice porridge with DBS-OP is shown in Fig. 5A. The apparent viscosity of rice porridge without DBS-OP only changed from 4784 ± 91 cP to 4872 ± 37 cP after the addition of 0.1% DBS-OP. On the other hand, the viscosity of rice porridge with 0.5% DBS-OP significantly decreased to 4504 ± 43 cP, while that of rice porridge with 5% DBS-OP gradually decreased to 4384 ± 86 cP. This phenomenon may be related to the anti-aging effects of the polyphenols in OP extract (Wu et al, 2009; Zhao et al., 2021). Aged starch forms strong hydrogen bonds between molecules and crystalline structures in amorphous regions. In addition, the interaction of starch with polyphenols involves hydrogen bonding via OH groups (Belitz and Grosch, 2013). Polyphenols contain highly reactive OH groups, which can interact readily with starch to form hydrogen bonds that disrupt the alignment of chains in the starch matrix (Beta and Corke, 2004; Wu et al., 2009). Therefore, the viscosity decrease was likely due to the effect of polyphenols in the OP extract on the gelation and aging of starch.
The pH of rice porridge with DBS is shown in Fig. 5B. The pH of the rice porridge without DBS-OP was 5.52 ± 0.02, while that of the rice porridge with 0.1% DBS-OP was 5.63 ± 0.02, indicating a slight change. By contrast, the pH of rice porridge with 0.5% DBS-OP increased to 5.64 ± 0.02, with a significant increase in pH up to 5% DBS-OP. However, the rice porridge with 5% DBS-OP had a pH of 5.81 ± 0.01, representing an increase of ~0.19 compared to the control, indicating that the effect of DBS-OP on pH is small. Shim et al. (2012) reports that OP extract has a pH of 5.92 to 5.99. Therefore, the pH of rice porridge without DBS-OP did not substantially affect the pH value, and the pH increase was attributed to the DBS-OP concentration, which was positively correlated (r = 0.845, p < 0.05).
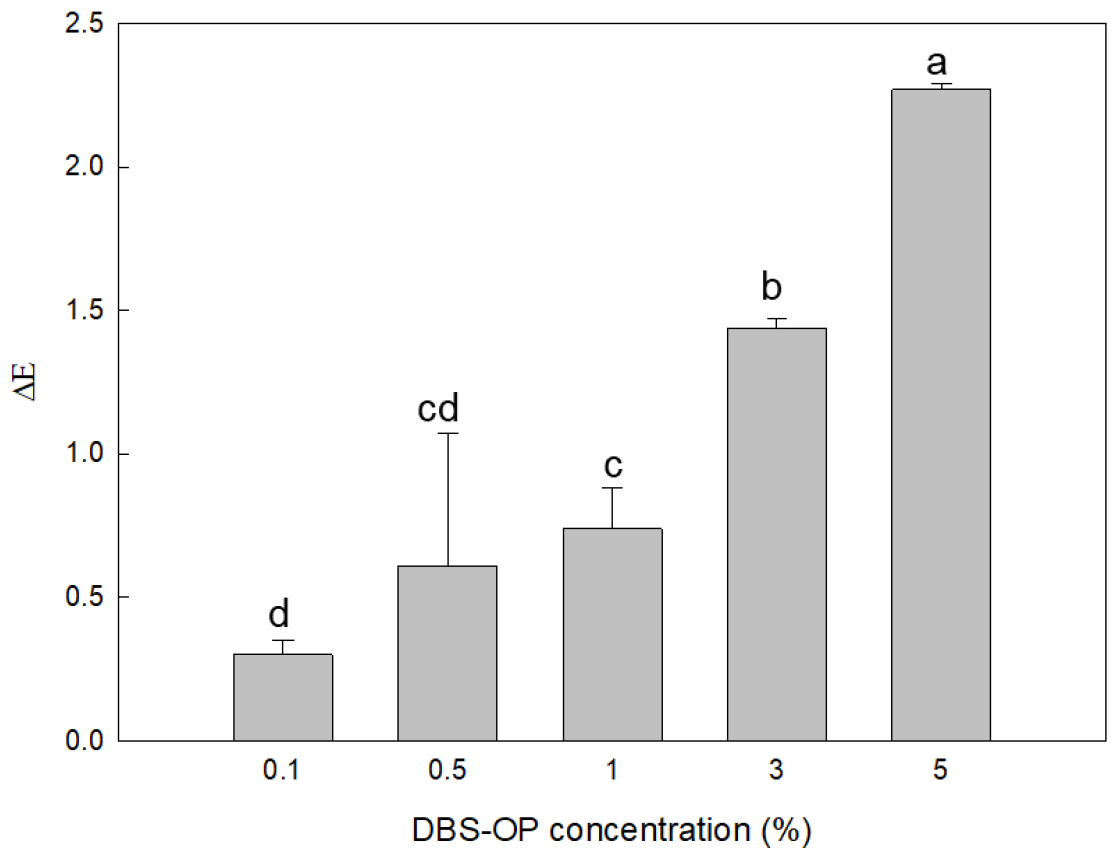
The color parameters of rice porridge with DBS are shown in Table 2. Rice porridge with DBS-OP showed a decrease in L and a values and an increase in b values compared with those of the control. These results indicate that DBS-OP decreases the brightness and redness of rice porridge and increases the yellowness. The ΔE of the rice porridge with DBS is shown in Fig. 6. Compared with that of the control, the ΔE of rice porridge with 0.1% DBS-OP was 0.30 ± 0.05, and that of rice porridge with 5% DBS-OP was 2.27 ± 0.02, showing a gradual increase with concentration. These results are attributed to the concentration of DBS-OP and are positively correlated (r = 0.997, p < 0.05).
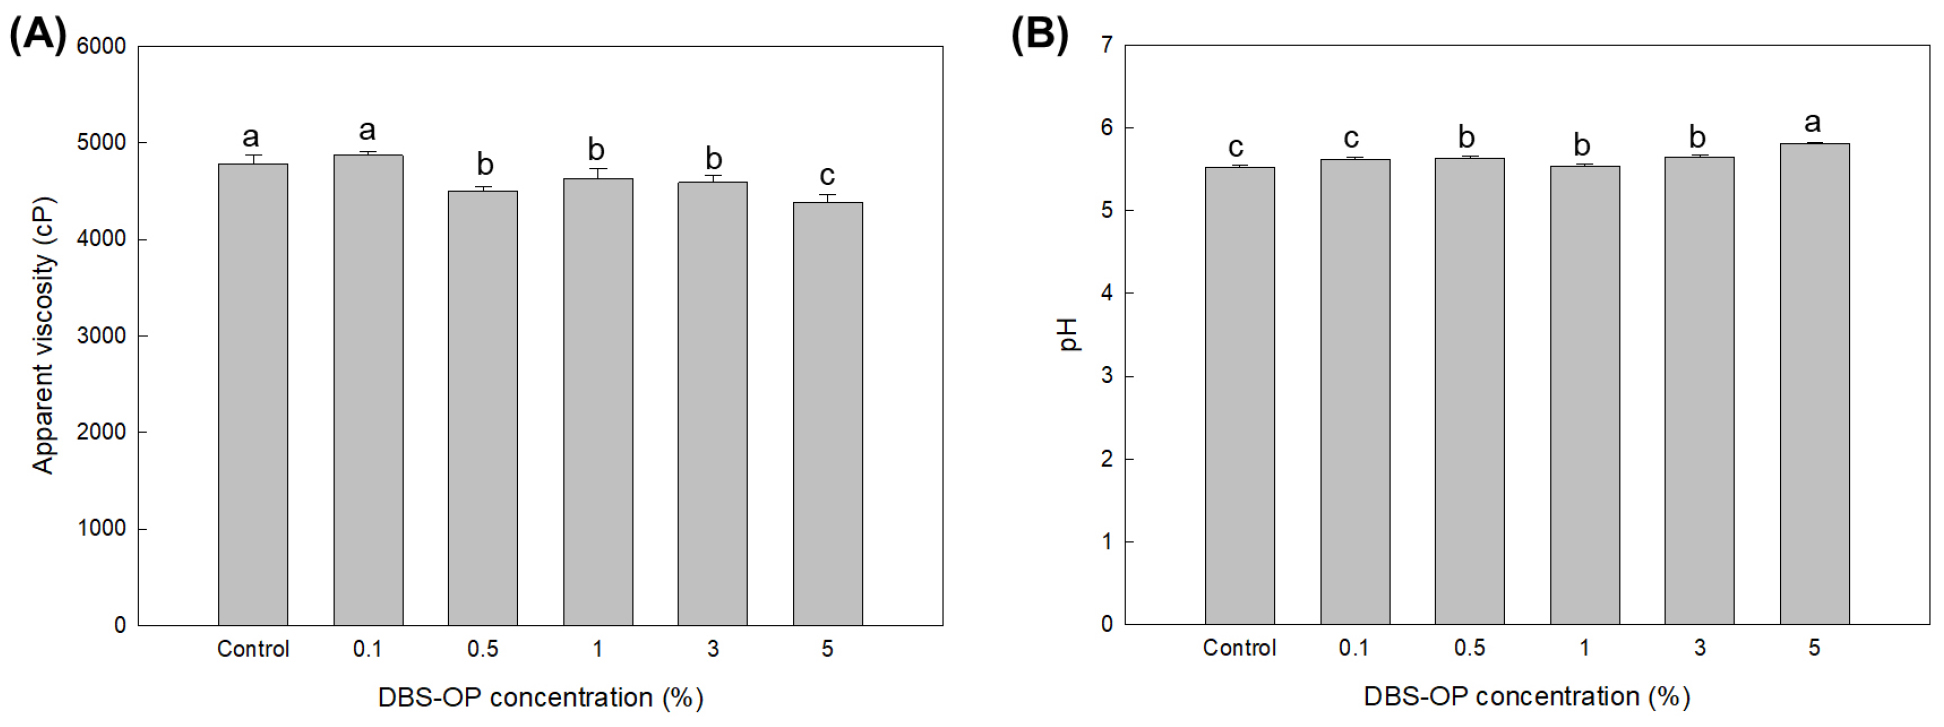
Table 2
Color parameter of rice porridge depending on the addition level of DBS-OP
Flavor patterns of rice porridge
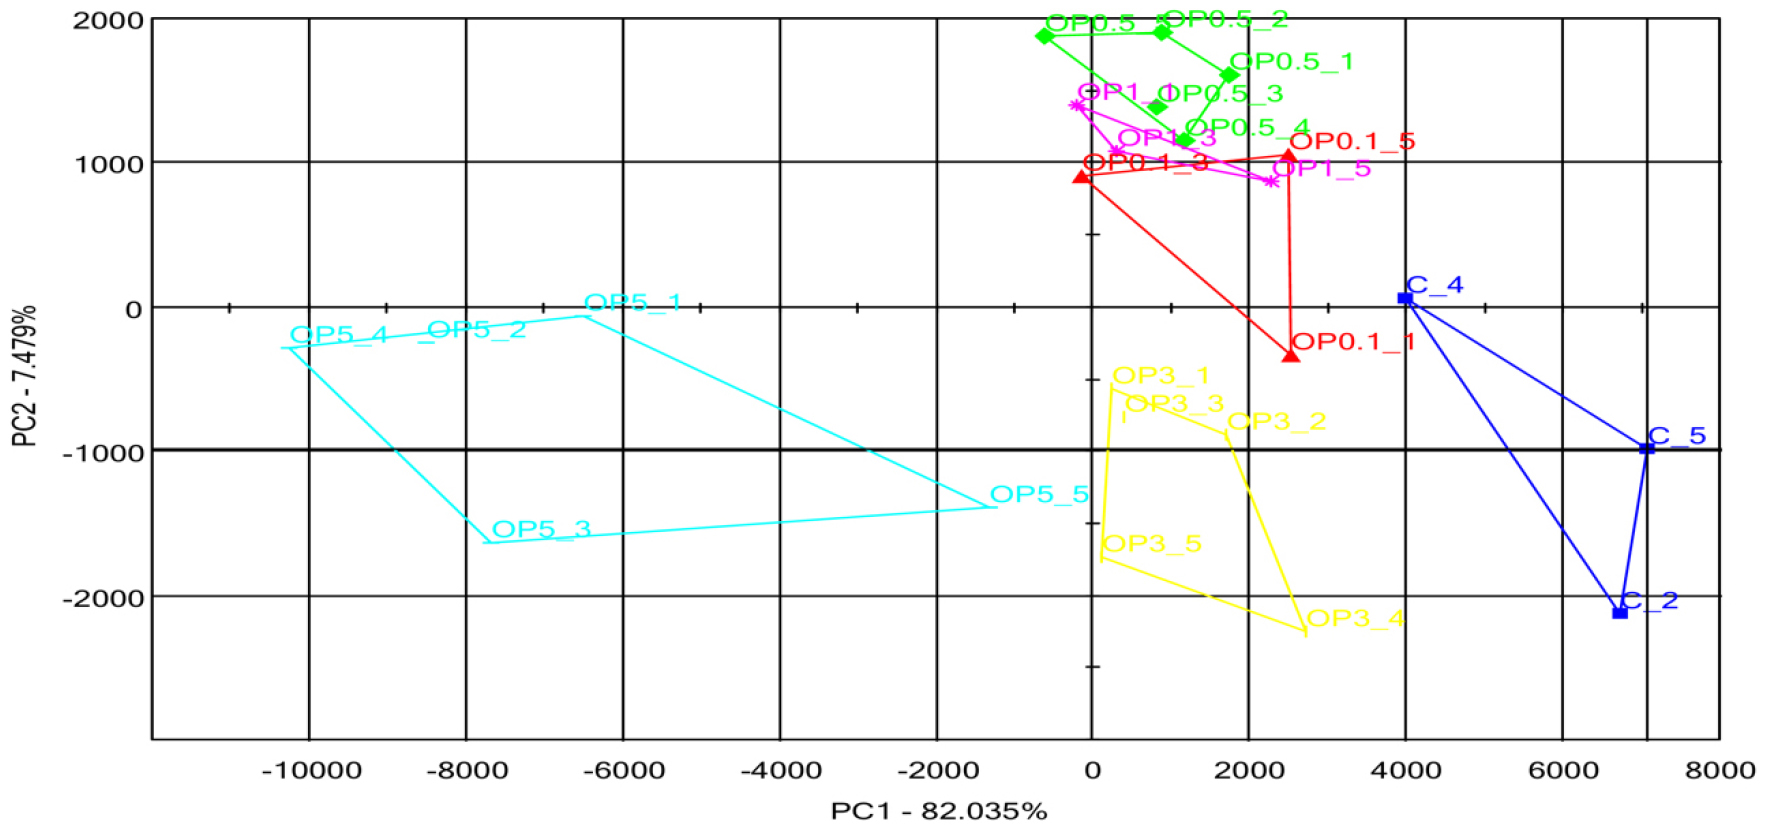
The PCA plot of rice porridge flavored with DBS-OP is shown in Fig. 7. The first principal component value (PC1) is 82.04%, and the second principal component value (PC2) is 7.48%, confirming that PC1 has a significant impact on flavor pattern discrimination. Therefore, separating the flavor components based on the first principal component value seems appropriate. In PCA, samples closer in distance to each other have been reported to exhibit similar flavor profiles, while those of samples farther apart differ (Kim et al., 2008). The rice porridge without DBS-OP showed a distribution at ~4000-8000, which gradually shifted to lower values with the addition of DBS-OP. On the other hand, rice porridge with 0.1%, 0.5%, 1%, and 3% DBS-OP was found to have a similar flavor profile with a distribution between approximately -1000 and 4000. The rice porridge with 5% DBS-OP showed larger differences in flavor profile than the control, with the flavor distributed around -1000 to approximately -10,000. These results indicate that DBS-OP may slightly affect the flavor at low concentrations and that the addition of DBS-OP above a certain concentration has a significant effect on flavor.
Conclusions
In this study, quercetin, rutin, and chlorogenic acid were the most effective in inhibiting α-glucosidase activity among the digestion-resistant components. Quercetin-rich OP extract showed the highest α-glucosidase activity inhibition of 91.41% ± 0.41% at 3% concentration, which gradually decreased at subsequent concentrations. This may be due to flocculation or increased viscosity at high concentrations of OP extract. In vitro digestion of DBS-OP was found to be stable in the simulated oral cavity and stomach. In the simulated small intestine digestion, 43.86% ± 2.37% was hydrolyzed after 30 min, indicating an initial rapid release, followed by a slow hydrolysis to 47.51% ± 0.47%, 50.86% ± 2.63%, and 54.50% ± 3.89% after 60, 90, and 120 min, respectively, indicating sustained release. Rice porridge with DBS-OP increased in a concentration-dependent manner from 0.1% (1.01% ± 3.4%) to 5% (18.58% ± 1.21%), demonstrating the potential for utilization of DBS-OP as a digestion-resistant material. On the other hand, it showed some different patterns from the inhibition rate of α-glucosidase activity at high quercetin concentrations. This may be due to the fact that the DBS-OP was not fully hydrolyzed after the previous simulated intestinal digestion, resulting in partial release, and the sustained digestive enzyme inhibition owing to its sustained release characteristics. The apparent viscosity of the rice porridge was reduced by DBS-OP addition. The polyphenols in OP extract contain highly reactive OH groups, which can easily interact with starch to form hydrogen bonds that disrupt the alignment of chains in the starch matrix and reduce the apparent viscosity. The pH and ΔE of the rice porridge increased in a concentration-dependent manner with DBS-OP, indicating that the effect was due to the properties of DBS-OP itself. Low concentrations of DBS-OP had a slight effect on flavor; above a certain concentration, it significantly affected the flavor. These results indicate the potential of DBS-OP as a digestion-resistant material to slow the rapid digestion of starch in senior-friendly foods. However, in vivo evaluation is needed to assess the further efficacy of this material.
