


Introduction
Materials and Methods
Plant materials and classification
Analysis of Soluble Sugar Content
Data Processing and Statistical Analysis
Data mining and sequence retrieval
Selection of contrasting cultivars for expression analysis
RNA extraction and cDNA synthesis
Primer design
Quantitative realtime PCR (qRTPCR)
Results
Analysis of Sugar Content in 2021 and 2022
Characteristics of Sugar Content by Cultivar Group in 2021 and 2022
Gene catalog and functional grouping of sucrose-starch pathway genes
Overall expression patterns across tissues, years, and cultivar groups
Starch branching enzymes show the strongest association with sucrose content
Integrative relationships between sugar content and gene expression
Discussion
Two-year sugar profiling highlights YS and RS groups as high-sugar genetic resources
Sugar-starch pathway expression patterns emphasize the endosperm
Starch branching enzymes as plausible modulators of sweetness in waxy maize
Future perspectives
Introduction
Maize (Zea mays L.) is one of the three most widely cultivated cereal crops worldwide and supplies carbohydrates for food, feed, and industrial uses, including starch-based ingredients and bio-based materials. Within maize, specialty endosperm types such as sweet, waxy, and high-amylose cultivars have been developed to satisfy specific quality markets, especially in the fresh vegetable and processing sectors (Hallauer, 2001; Tracy, 2001). Waxy maize, defined by a recessive waxy1 (wx1) allele that converts starch composition to almost exclusively amylopectin, is particularly popular in East and Southeast Asia as a fresh “sticky” corn due to its chewy texture and high paste viscosity (Reddappa et al., 2022; Talukder et al., 2022; Zhou et al., 2016).
In developing maize kernels, most imported carbon arrives as sucrose from photosynthetic leaves and is subsequently cleaved and converted into ADPglucose in the endosperm before being polymerized into starch. Starch biosynthesis in cereal endosperms is controlled by a coordinated network of enzyme isoforms, including sucrose synthases, ADPglucose pyrophosphorylase (AGPase), multiple classes of starch synthases, starch branching enzymes (SBEs), and debranching enzymes (DBEs), which collectively determine both the quantity and fine structure of storage starch (Hannah and James, 2008; Huang et al., 2021; James et al., 2003; Li et al., 2021). Branching enzymes introduce α1,6 linkages into glucan chains, whereas DBEs remove a subset of these branches; their interplay, together with granule-bound starch synthase encoded by the Waxy (Wx1) gene, is essential for forming the semicrystalline amylopectin-rich granules typical of cereal endosperm starch (Hannah and James, 2008; ㅊKubo et al., 2010; Tetlow and Emes, 2014). In waxy maize, loss of Wx1 function eliminates amylose synthesis, driving starch composition to approximately 95-100% amylopectin, but this mutation alone does not result in markedly elevated kernel sucrose content (Reddappa et al., 2022; Zhou et al., 2016).
Commercial sweet corn, in contrast, exploits recessive mutations in genes acting upstream in the sucrose-starch pathway. Mutations in sugary1 (su1), which encodes an isoamylase-type DBE, increase endosperm sucrose and watersoluble polysaccharides while decreasing amylopectin and promoting the accumulation of the highly branched glucan phytoglycogen (James et al., 1995; Rahman et al., 1998). Additional alleles such as sugary enhancer1 (se1) and the supersweet mutation shrunken2 (sh2), a null mutation in the large subunit of AGPase, further elevate sugar content but cause strong reductions in starch deposition and kernel density, features that are desirable in sweet corn but undesirable for waxy maize, where grain yield and firm, sticky texture must be preserved (Finegan et al., 2022; Hu et al., 2021; Zhang et al., 2019). Genomeediting and breeding studies that combine highsugar alleles with waxy backgrounds demonstrate that such combinations are feasible but often lead to complex segregation patterns and agronomic penalties, underscoring the need for alternative strategies to modify sweetness in waxy maize (Dong et al., 2019; Talukder et al., 2022).
Recent work in maize and other cereals indicates that moderate shifts in starch biosynthetic flux can substantially alter endosperm sugar levels without completely abolishing starch synthesis. Quantitative changes in the activities or expression of specific starch synthase, SBE, and DBE isoforms have been shown to remodel amylopectin chainlength distributions, starch granule morphology, and the balance between starch and soluble carbohydrates (Kubo et al., 2010; Li et al., 2021; Tetlow and Emes, 2014). For example, partial alterations in SBEII activity or in isoamylase complexes can increase the proportion of long glucan chains and watersoluble glucans, thereby changing endosperm carbohydrate composition while maintaining substantial starch content (Huang et al., 2021; Kubo et al., 2010; Rahman et al., 1998). These findings suggest that “downstream” enzymes in the sucrose-starch pathway, particularly SBEs and DBEs, may serve as finetuning levers to enhance kernel sweetness without the drastic starch penalties associated with classical sweetcorn mutations. Nevertheless, most previous studies have focused on singlegene mutants or transgenic lines in dent or sweet corn backgrounds and do not capture the cumulative, pathwaylevel behaviour of sugar-starch genes across diverse waxy maize germplasm (Finegan et al., 2022; Li et al., 2021; Wilson et al., 2024).
A systemsoriented understanding of how the entire sucrose-starch pathway is transcriptionally coordinated in waxy maize kernels with contrasting sugar content is therefore still lacking. In particular, it remains unclear how expression of sucrosecleaving enzymes, sugar influx ratelimiting factors such as AGPase and the ADPglucose transporter Brittle1, starch synthases, SBEs, DBEs, and enzymes of fructose metabolism collectively influence sucrose retention in developing waxy endosperm. Comprehensive expression profiling of these gene sets, combined with precise quantification of kernel soluble sugars at a defined developmental stage, could identify key regulatory nodes or combinations of genes associated with higher sweetness yet minimal compromise in starch accumulation.
In this study, we addressed this gap using a panel of 58 waxy maize inbred lines sharing a common waxy background but exhibiting markedly different levels of kernel sweetness. By linking pathwaywide gene expression patterns to variation in kernel sugar content, our goal was to identify promising downstream targets for breeding or biotechnological approaches aimed at moderately enhancing sweetness in waxy maize while preserving its characteristic amylopectinrich texture.
Materials and Methods
Plant materials and classification
Fiftyeight waxy maize (Zea mays L.) inbred lines with a common waxy genetic background were used in this study, together with two commercial sweet corn cultivars included as highsugar checks. All plant materials were cultivated at the research field of the Corn Research Institute, Gangwon Agricultural Research and Extension Services (GARES), Gangwondo, Republic of Korea.
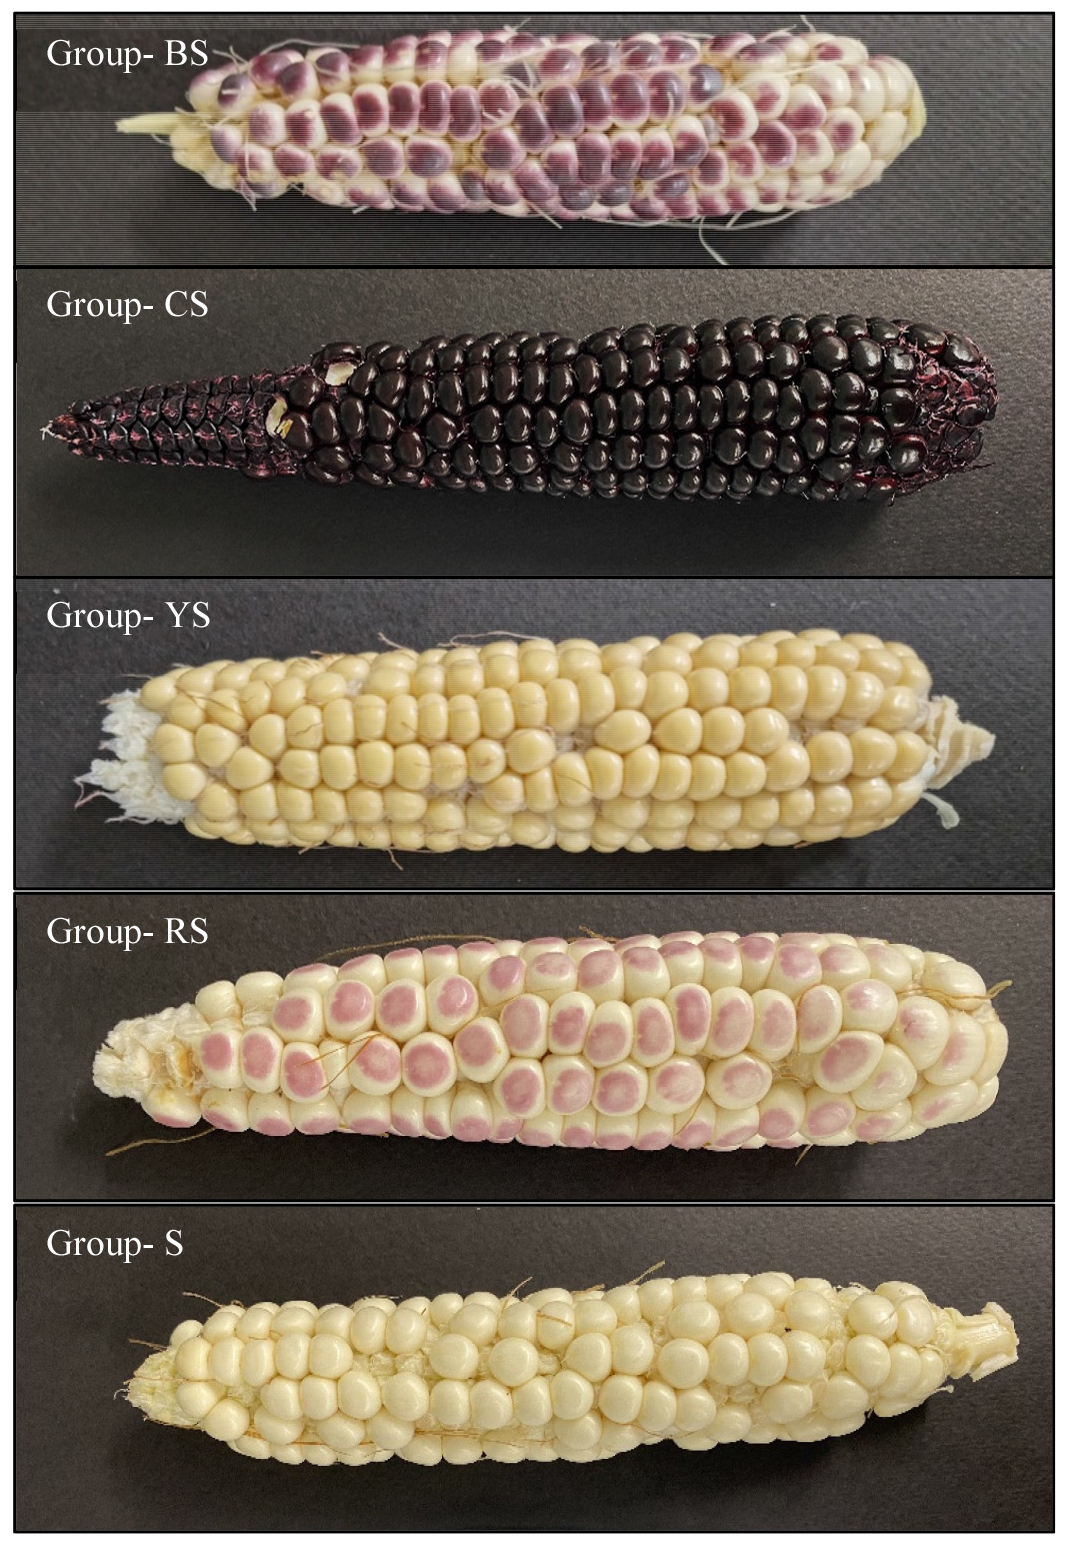
Because plant form and growth habit differed only slightly among the waxy inbreds, morphological classification based on vegetative traits was difficult. Therefore, classification was based solely on kernel color at physiological maturity. Grains were first divided into white waxy and colored waxy types. Colored waxy kernels were further separated according to the tissue in which pigmentation was visible: lines with pigments accumulated in the endosperm were classified as BS, YS, or RS, whereas lines that formed pigments primarily in the pericarp were classified as CS. Representative ears and kernels of each group (BS, CS, YS, RS, S, and sweet corn) are shown in Fig. 1.
Analysis of Soluble Sugar Content
The soluble sugar content of corn was determined according to the method of Zhu et al. (1992) with slight modifications. Approximately 0.1 g of sample was extracted with 1 mL of 80% methanol for 3 hours. After extraction, the mixture was centrifuged, and the supernatant was filtered through a 0.22 µm membrane filter. The filtrate was analyzed using a YL 9100 HPLC system (Younglin Instrument Co., Anyang, Korea). Separation was performed on a Sugar-Pak Column (Waters Corporation, MS, USA) with double-distilled water (DDW) as the mobile phase. Glucose, fructose, and sucrose were detected using a refractive index (RI) detector. The analysis was conducted under isocratic at a flow rate of 0.5 mL/min for 30 minutes, with the column oven temperature maintained at 80°C. The injection volume was 5 µL. Representative chromatograms of the standard mixture and a corn sample (YS6012) are shown in Fig. S1.
Data Processing and Statistical Analysis
All data processing, statistical analyses, and visualizations were performed using Python (version 3.13) within the Jupyter Notebook environment (Van Rossum and Drake, 2009; Waskom, 2021). The Python scripts used in this study were developed with the assistance of the large language model Gemini (Google, 2025).
Data manipulation and numerical calculations were conducted using the Pandas and NumPy libraries. For statistical analysis, one-way ANOVA was performed using SciPy, and post-hoc Tukey’s HSD tests were conducted using Statsmodels. The grouping of statistically significant differences (Compact Letter Display) was implemented using the NetworkX library.
Visualizations were generated using Matplotlib and Seaborn. Specifically, box plots were created to show the distribution of sugar contents with statistical significance labels, and heatmaps were plotted using Z-score standardization to compare relative sugar profiles. In the heatmaps, non-detected (N.D.) values were visualized with a distinct black background to differentiate them from measured values.
Data mining and sequence retrieval
To identify genes involved in the sugar-starch pathway, previously published literature on maize sugar content and starch biosynthesis was systematically searched and reviewed. All genes reported to participate in sucrose synthesis, sucrose cleavage, and conversion of soluble sugars to starch in maize kernels were collected from these studies. The identified genes were then mapped onto the metabolic pathways responsible for (i) sucrose synthesis in leaves, (ii) transport of sucrose to sink tissues, and (iii) conversion of sucrose and its derivatives to starch in endosperm amyloplasts. Nucleotide sequences corresponding to these genes were retrieved from the NCBI nucleotide database (https://www.ncbi.nlm.nih.gov) based on gene IDs, locus names, or accession numbers reported in the literature. To facilitate functional interpretation, the genes were categorized into seven functional groups: (i) sucrose cleavers; (ii) enzymes of intermediate products; (iii) sugar influx ratelimiting factors (AGPase subunits and ADPglucose transporter); (iv) starch synthases; (v) starch branching enzymes; (vi) debranching enzymes; and (vii) fructose metabolizers. The complete gene list and classification are provided in Table 1 and Table S1.
Table 1
Functional classification of sucrose–starch pathway genes analyzed in this study, including gene name/locus, encoded enzyme, pathway category, and proposed role in kernel carbohydrate partitioning
| Serial No. | Gene name | Putative function | NCBI accession* |
| 1 | Sh1 | catalyzes the cleavage of sucrose | LOC542365 |
| 2 | SUS1 | catalyzes the cleavage of sucrose | LOC4333062 |
| 3 | SUS2 | catalyzes the cleavage of sucrose | LOC542091 |
| 4 | BT2 | Small AGPase unit formation | LOC732804 |
| 5 | SH2 | Large AGPase unit formation | LOC541902 |
| 6 | BT1 | Membrane protein for AGPase transport | LOC542761 |
| 7 | SS1 | polymerization of glucosyl units in A chain | LOC541657 |
| 8 | SU2 | polymerization of glucosyl units in B1 chains | LOC541854 |
| 9 | SSIIB | polymerization of glucosyl units in B3 chains | LOC541656 |
| 10 | DU1 | polymerization of glucosyl units in C chains | LOC542481 |
| 11 | SSIV | polymerization of glucosyl units in C chains | LOC100101526 |
| 12 | WX | Elongation of amylose chains | LOC100170236 |
| 13 | SBE1 | alpha 1-6 brancing of longer chains glucan chains | LOC542315 |
| 14 | SBEII | alpha 1-6 brancing of shorter glucan chains | LOC542342 |
| 15 | AE1 | alpha 1-6 brancing of shorter glucan chains | LOC542238 |
| 16 | ISA1(SU1) | hydrolysis of α(1→6) glycoside bonds | LOC542318 |
| 17 | ISA2(DBEII) | hydrolysis of α(1→6) glycoside bonds | LOC29126646 |
| 18 | ZPU | hydrolysis of α(1→6) glycoside bonds | LOC541711 |
| 19 | BIN | Fructose metabolizer | LOC542590 |
| 20 | FRK | Intermediate of fructose breakdown | LOC100281592 |
| 21 | PGI | Intermediate of fructose breakdown | LOC541911 |
| 22 | UTP | Intermediate of Sucrose breakdown | LOC103633450 |
| 23 | PGM | Intermediate of Sucrose breakdown | LOC100191463 |
*Gene sequences were retrieved from the NCBI database using the accession numbers shown in Table 1
Selection of contrasting cultivars for expression analysis
Based on soluble sugar data from 2021 and 2022, four waxy cultivars from each color group (BS, CS, YS, RS, and S) were selected for gene expression analysis: two with relatively low sucrose content and two with relatively high sucrose content within each group. Selection prioritized genotypes that showed consistent sucrose differences across both years. The selected cultivars included, for example, BS5009, BS5004, BS6011, BS7001 (BS group); CS8003, CS8011, CS8017, CS8043 (CS group); YS5018, YS5021, YS6012, YS6013 (YS group); S8003, S8004, S7003, S7005 (S group); and RS6009, RS6011, RS7005, RS7006 (RS group). One or two sweet corn cultivars were also used as highsugar references in selected comparisons. For each selected genotype, additional ears were harvested at 21 DAP, and seeds were dissected to separately collect endosperm and cotyledon tissues. These samples were immediately frozen in liquid nitrogen and stored at -80 °C until RNA extraction.
RNA extraction and cDNA synthesis
For each genotype-tissue combination (endosperm and cotyledon), approximately 80-100 mg of frozen tissue was ground to a fine powder in liquid nitrogen using a chilled mortar and pestle. Total RNA was isolated using a commercial plant RNA extraction kit following the manufacturer’s instructions, including an oncolumn DNase I treatment step to remove any contaminating genomic DNA. RNA concentration and purity were assessed by spectrophotometry (A260/A280 and A260/A230 ratios), and RNA integrity was checked by agarose gel electrophoresis. Only highquality RNA samples were used for downstream expression analysis.
Firststrand cDNA was synthesized from 1.0 µg of DNasetreated total RNA in a 20 µL reaction using a commercial reverse transcription kit and oligo (dT) primers, according to the manufacturer’s recommendations. The resulting cDNA was diluted with nucleasefree water to yield a working solution corresponding to 1 ng RNA equivalent per µL and stored at -20°C until use in qRTPCR. The quality of cDNA and the success of DNase treatment were confirmed by conventional PCR using primers for the housekeeping gene Tubulin, followed by agarose gel electrophoresis.
Primer design
For quantitative realtime PCR, genespecific primers were designed for 25 target genes representing the seven functional categories of the sucrose-starch pathway. Primer design was performed using the PrimerQuest tool (Integrated DNA Technologies, https://sg.idtdna.com/pages) with default settings. Amplicon sizes were constrained to be < 200 bp to ensure high amplification efficiency (typically 80-200 bp).
Primers were designed within exons, and where possible, across exon-exon junctions to minimize amplification from genomic DNA. Candidate primer pairs were checked in silico for specificity and the absence of hairpins or dimers, and empirically validated by PCR and meltingcurve analysis. The final primer sets used in this study, along with target gene names, amplicon sizes, and primer sequences, are listed in Table S1.
Quantitative realtime PCR (qRTPCR)
Expression profiling of the 25 sugar-starch pathway genes was carried out by quantitative realtime PCR (qRTPCR). The reaction mixture (total volume 10 µL) contained 1 µL of diluted cDNA (corresponding to 1 ng RNA), 5 µL of 2× SYBR Green PCR Master Mix (Applied Biosystems, Foster City, CA, USA), and 200 nM each of the forward and reverse genespecific primers, with nucleasefree water added to the final volume.
All PCR reactions were run on an Applied Biosystems realtime PCR system using 96well optical plates under the following cycling conditions: initial steps of 2 min at 50°C and 10 min at 95°C, followed by 40 cycles of 5 s at 95°C, 30 s at 55°C, and 30 s at 72°C. After amplification, a meltingcurve analysis from 55 to 95°C was performed to verify the specificity of each amplicon. Nontemplate controls were included for each primer pair to monitor potential contamination. Tubulin served as the internal reference gene. For each gene and sample, two technical replicates and two biological replicates (plots) were analyzed. Relative expression levels were calculated by the 2-∆∆Ct method, using a designated lowsucrose cultivar or group mean as the calibrator.
Results
Analysis of Sugar Content in 2021 and 2022
The analysis of sugar content in corn cultivars produced in 2021 revealed significant variations in sugar composition across different cultivars (Fig. S2). Sucrose, which accounted for the largest proportion of total sugars, ranged from 2,046.30 to 11,550.44 mg/L. Notably, the ‘CS8011’ cultivar exhibited the highest sucrose content at 11,550.44 mg/L, a distinctly higher value compared to the runners-up, ‘CS8017’ (9,029.70 mg/L) and ‘YS6012’ (8,972.49 mg/L). Glucose content ranged from 0.00 to 1,417.93 mg/L, with ‘CS8017’ recording the highest level at 1,417.93 mg/L, followed by ‘RS6009’ (1,287.22 mg/L) and ‘CS8007’ (1,236.20 mg/L). Fructose content showed a similar trend to glucose; ‘CS8017’ again ranked highest at 885.05 mg/L, followed by ‘RS6009’ (784.34 mg/L) and ‘BS6011’ (771.26 mg/L). In summary, while sucrose was the primary determinant of sweetness in 2021 corn cultivars, certain cultivars like ‘CS8017’ were characterized by relatively high levels of reducing sugars (glucose and fructose) (Fig. S2).
In the analysis of 2022 corn cultivars, the deviation in sugar content values widened significantly due to the presence of specific high-sugar cultivar groups (3511R, Mega080, Geumdang) (Fig. S3). Sucrose content showed an extreme range from a minimum of 1,713.00 mg/L to a maximum of 37,668.53 mg/L. The top-ranking cultivar, ‘3511R’, was highest at 37,668.53 mg/L, followed by ‘Mega080’ (30,261.16 mg/L) and ‘Geumdang’ (26,436.19 mg/L). These results are interpreted as reflecting the characteristics of super sweet corn cultivars. Glucose content ranged from 316.34 to 3,186.41 mg/L, with the ranking identical to that of sucrose. ‘3511R’ was highest at 3,186.41 mg/L, followed by ‘Mega080’ (3,064.37 mg/L) and ‘Geumdang’ (2,511.76 mg/L). Similarly, for Fructose, ‘3511R’ peaked at 1,864.25 mg/L, followed by ‘Mega080’ (1,825.67 mg/L) and ‘Geumdang’ (1,706.58 mg/L). Considering that the sugar content of ordinary cultivars excluding these top three remained comparable to the previous year, the data suggests that the top three cultivars in 2022 possess genetically enhanced sugar accumulation capabilities (Fig. S3).
Characteristics of Sugar Content by Cultivar Group in 2021 and 2022
A comparative analysis of sugar content was conducted by categorizing corn cultivars into five groups (BS, CS, RS, S, YS) based on their breeding lines (Fig. 1). The results indicated distinct differences in sugar composition among the groups (Fig. 2, Fig. 3a). In 2021, the YS group exhibited the highest mean sucrose content at 6,079.41 mg/L, followed by the RS group at 5,840.87 mg/L. Conversely, the BS group recorded the lowest sucrose content among the five groups at 4,669.06 mg/L. Regarding reducing sugars, the RS group showed the most dominant levels of glucose and fructose. The mean glucose and fructose contents of the RS group were 827.76 mg/L and 546.72 mg/L, respectively, which were approximately two-fold higher than those of other groups (typically in the 300-400 mg/L range). This suggests that the RS group is differentiated not only by high total sugar content but also by a unique sugar composition ratio that influences sweetness quality.
In the 2022 analysis (excluding super sweet corn varieties), although the overall sugar content decreased compared to 2021, the relative hierarchy among groups remained consistent (Fig. 2, Fig. 3b). The YS group and RS group showed the highest sucrose levels at 3,147.69 mg/L and 3,131.36 mg/L, respectively, showing comparable performance. In contrast, the BS group recorded the lowest sucrose content at 2,327.60 mg/L, consistent with the 2021 results.
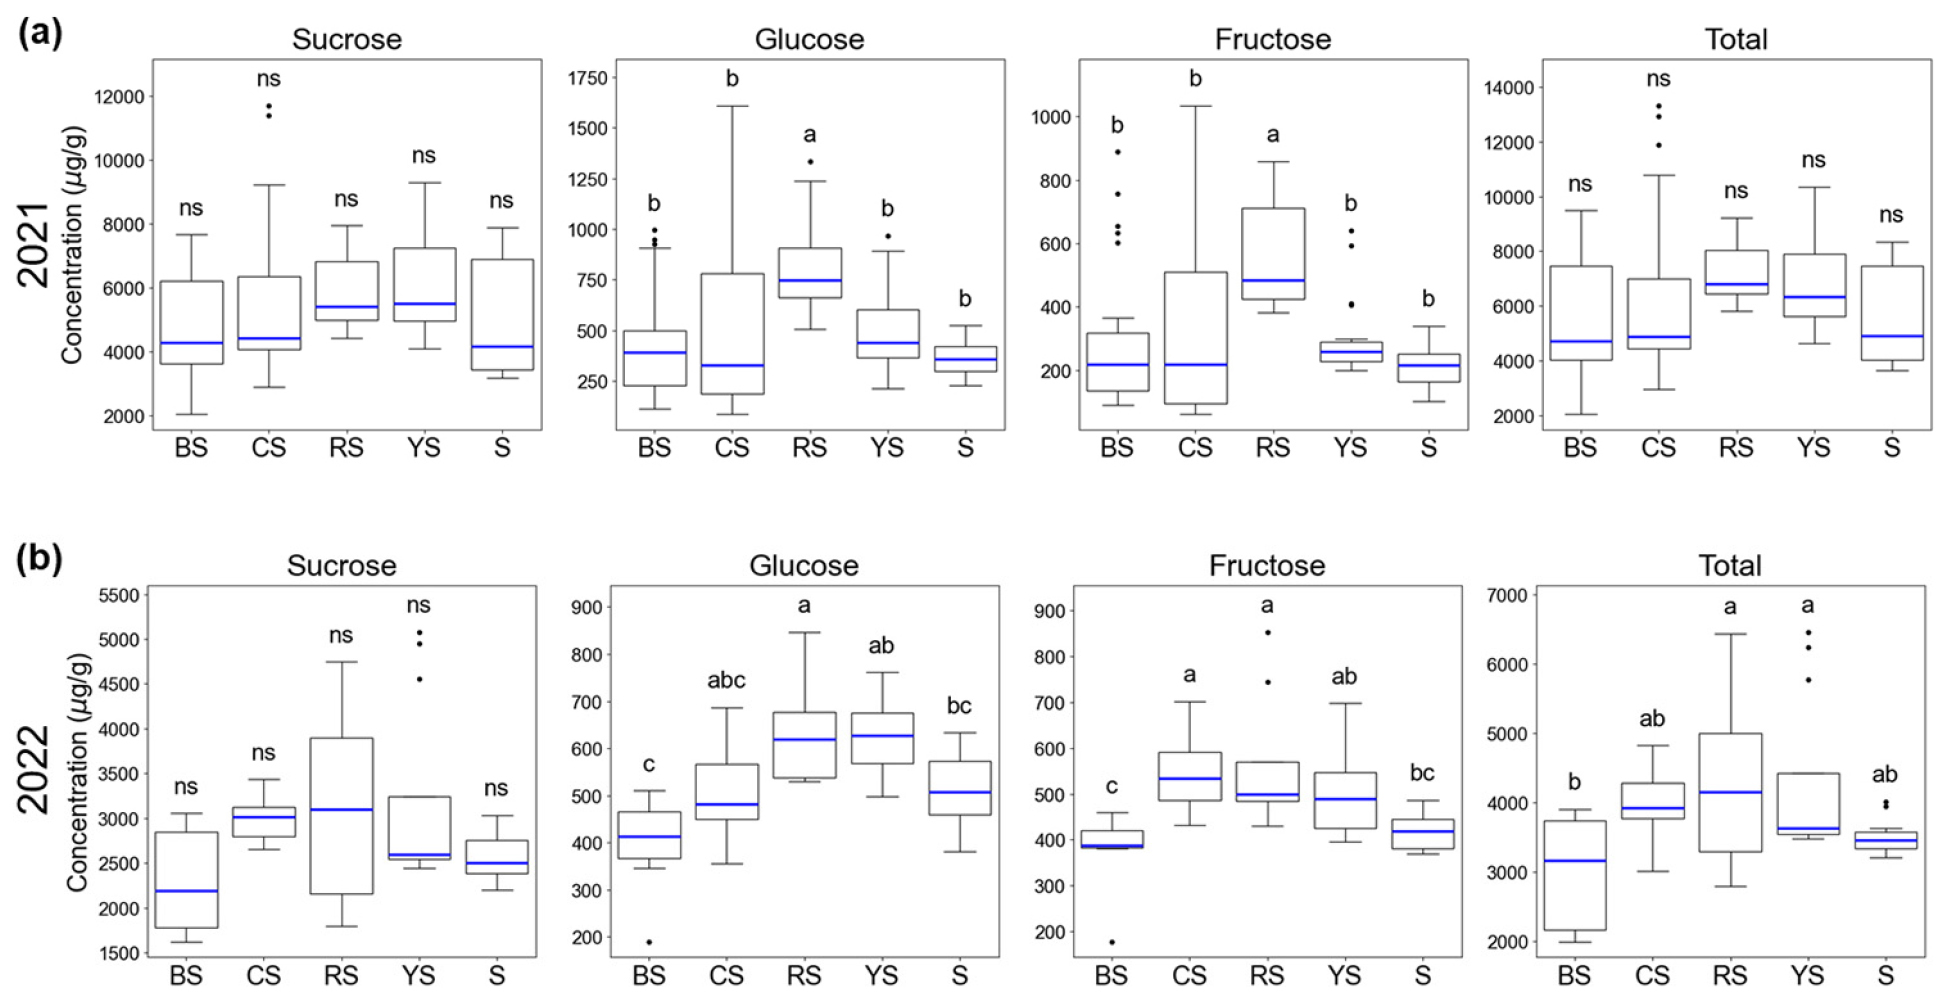
Fig. 2.
Comparison of soluble sugar contents (sucrose, glucose, fructose, and total) across different corn cultivar groups in 2021 and 2022. The box plots display the distribution of individual sugar concentrations and the total soluble sugar content, which was calculated as the sum of sucrose, glucose, and fructose. The horizontal line within each box represents the median, while the box edges denote the interquartile range (IQR). Whiskers extend to the minimum and maximum values within 1.5 times the IQR. Different lowercase letters above the bars indicate statistically significant differences between groups as determined by Tukey’s honestly significant difference (HSD) test (p < 0.05).
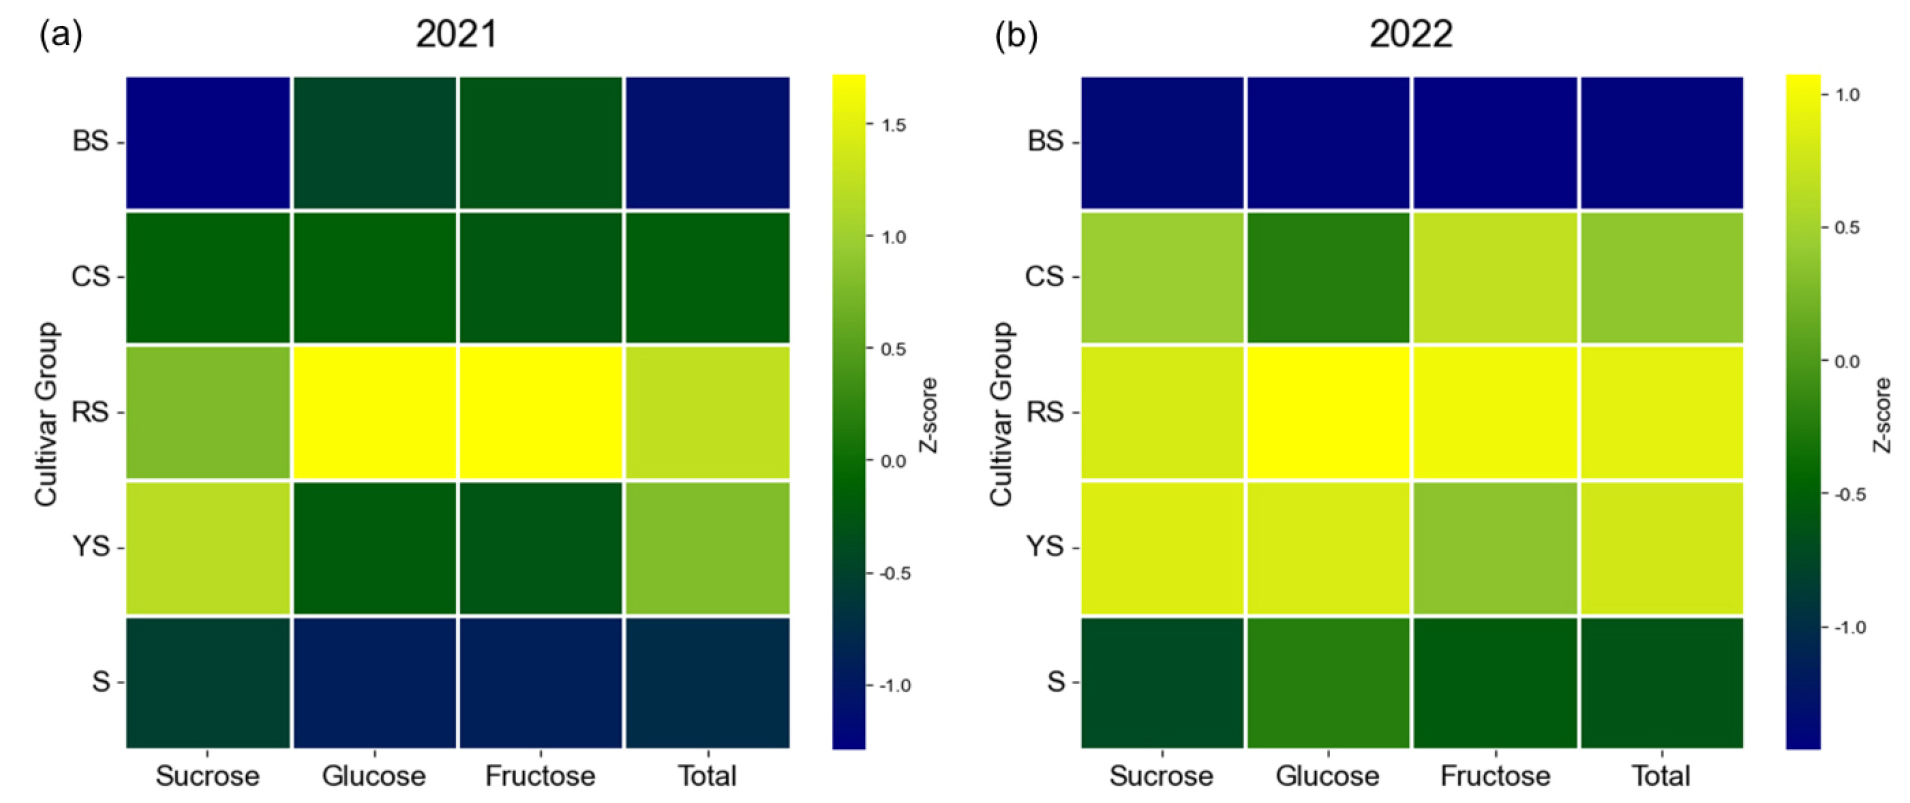
Fig. 3.
Heatmap visualization of mean soluble sugar profiles across five corn cultivar groups (BS, CS, RS, S, and YS) harvested in 2021(a) and 2022(b). The heatmap illustrates the relative abundance of sucrose, glucose, fructose, and total soluble sugar content. Values represent the mean concentration calculated for each cultivar group. Total soluble sugar content was derived as the sum of the mean concentrations of sucrose, glucose, and fructose. Data were standardized using Z-score normalization of the group means to facilitate comparison across different sugar types. The color gradient ranges from navy (low relative mean concentration) through green to neon yellow (high relative mean concentration).
For glucose and fructose, the RS group again ranked highest with 640.79 mg/L and 562.91 mg/L, respectively. This confirms that the RS group maintains a characteristic of high reducing sugar accumulation regardless of annual environmental variations. The YS group also exhibited relatively high glucose levels (617.49 mg/L). These findings suggest that the YS and RS groups are promising genetic resources for breeding high-sugar corn cultivars.
Synthesizing the data from both years, the YS group appears specialized for sucrose accumulation, while the RS group is characterized by high levels of not only sucrose but also glucose and fructose, suggesting a more complex sweetness profile (Fig. 2, Fig. 3). On the other hand, the BS group consistently exhibited the lowest sugar content over the two years, indicating that it may be more suitable for applications other than fresh consumption, such as processing or fodder.
Gene catalog and functional grouping of sucrose-starch pathway genes
Literature and database mining identified 25 maize genes that participate in sucrose synthesis, transport, cleavage, and conversion to starch in kernels (Table 1). These genes were assigned to seven functional categories: (i) sucrose cleavers (e.g. Shrunken1, Sucrose synthase1, Sucrose synthase2); (ii) enzymes producing intermediate metabolites (e.g. UTPase, phosphoglucomutase); (iii) sugar influx ratelimiting factors (Shrunken2 and Brittle2, encoding AGPase subunits, and Brittle1, encoding an ADPglucose transporter); (iv) starch synthases (including Waxy1, Starch synthase1, Sugary2, Starch synthase II, Dull1, and Starch synthase IV); (v) starch branching enzymes (SBEI, SBEIIb, Amylose extender1 [AE1/SBEIIa]); (vi) debranching enzymes (Sugary1, Isoamylase2, Zeapullunase1); and (vii) fructosemetabolizing enzymes (Miniature, fructokinase, phosphoglucose isomerase).
These genes were positioned on a pathway model describing the flow of carbon from sucrose synthesis in leaves through transport to seeds and conversion to starch within amyloplasts (Fig. 4). This gene catalog and pathway framework guided both primer design and subsequent interpretation of expression patterns.

Fig. 4
Schematic representation of carbon flow from sucrose synthesis in source leaves to translocation into developing kernels and conversion to storage starch in endosperm amyloplasts. Enzymatic steps are mediated by genes categorized as sucrose cleavers, intermediate-product enzymes, sugar influx rate-limiting factors, starch synthases, starch branching enzymes, debranching enzymes, and fructose metabolizers.
Overall expression patterns across tissues, years, and cultivar groups
Quantitative RTPCR using tissuespecific RNA from endosperm and cotyledon (embryo) at 21 DAP revealed that all 25 genes in the sucrose-starch pathway were expressed in the selected waxy cultivars and sweet corn references. For most genes, transcript abundance was higher in endosperm than in cotyledon, consistent with the endosperm being the primary site of starch deposition and sugar-starch interconversion.
Across the two years, expression patterns were broadly reproducible: genes that were relatively highly expressed in a given cultivar or group in 2021 showed similar relative expression in 2022, albeit with some differences in magnitude. Within each color group, highsucrose cultivars tended to exhibit distinct expression profiles compared with lowsucrose cultivars, but the identity of strongly responsive genes differed among groups. Overall, gene expression corresponded with differences in sugar levels, but patterns were often groupspecific rather than universal.
Starch branching enzymes show the strongest association with sucrose content
By contrast to the relatively subtle patterns observed for sucrose cleavers and starch synthases, starch branching enzymes (SBEs) showed pronounced and consistent differences between low and highsucrose cultivars. The three branching enzyme genes—SBEI, SBEIIb, and Amylose extender1 (AE1, encoding SBEIIa)—were expressed in both tissues but much more strongly in endosperm (Fig. 5).
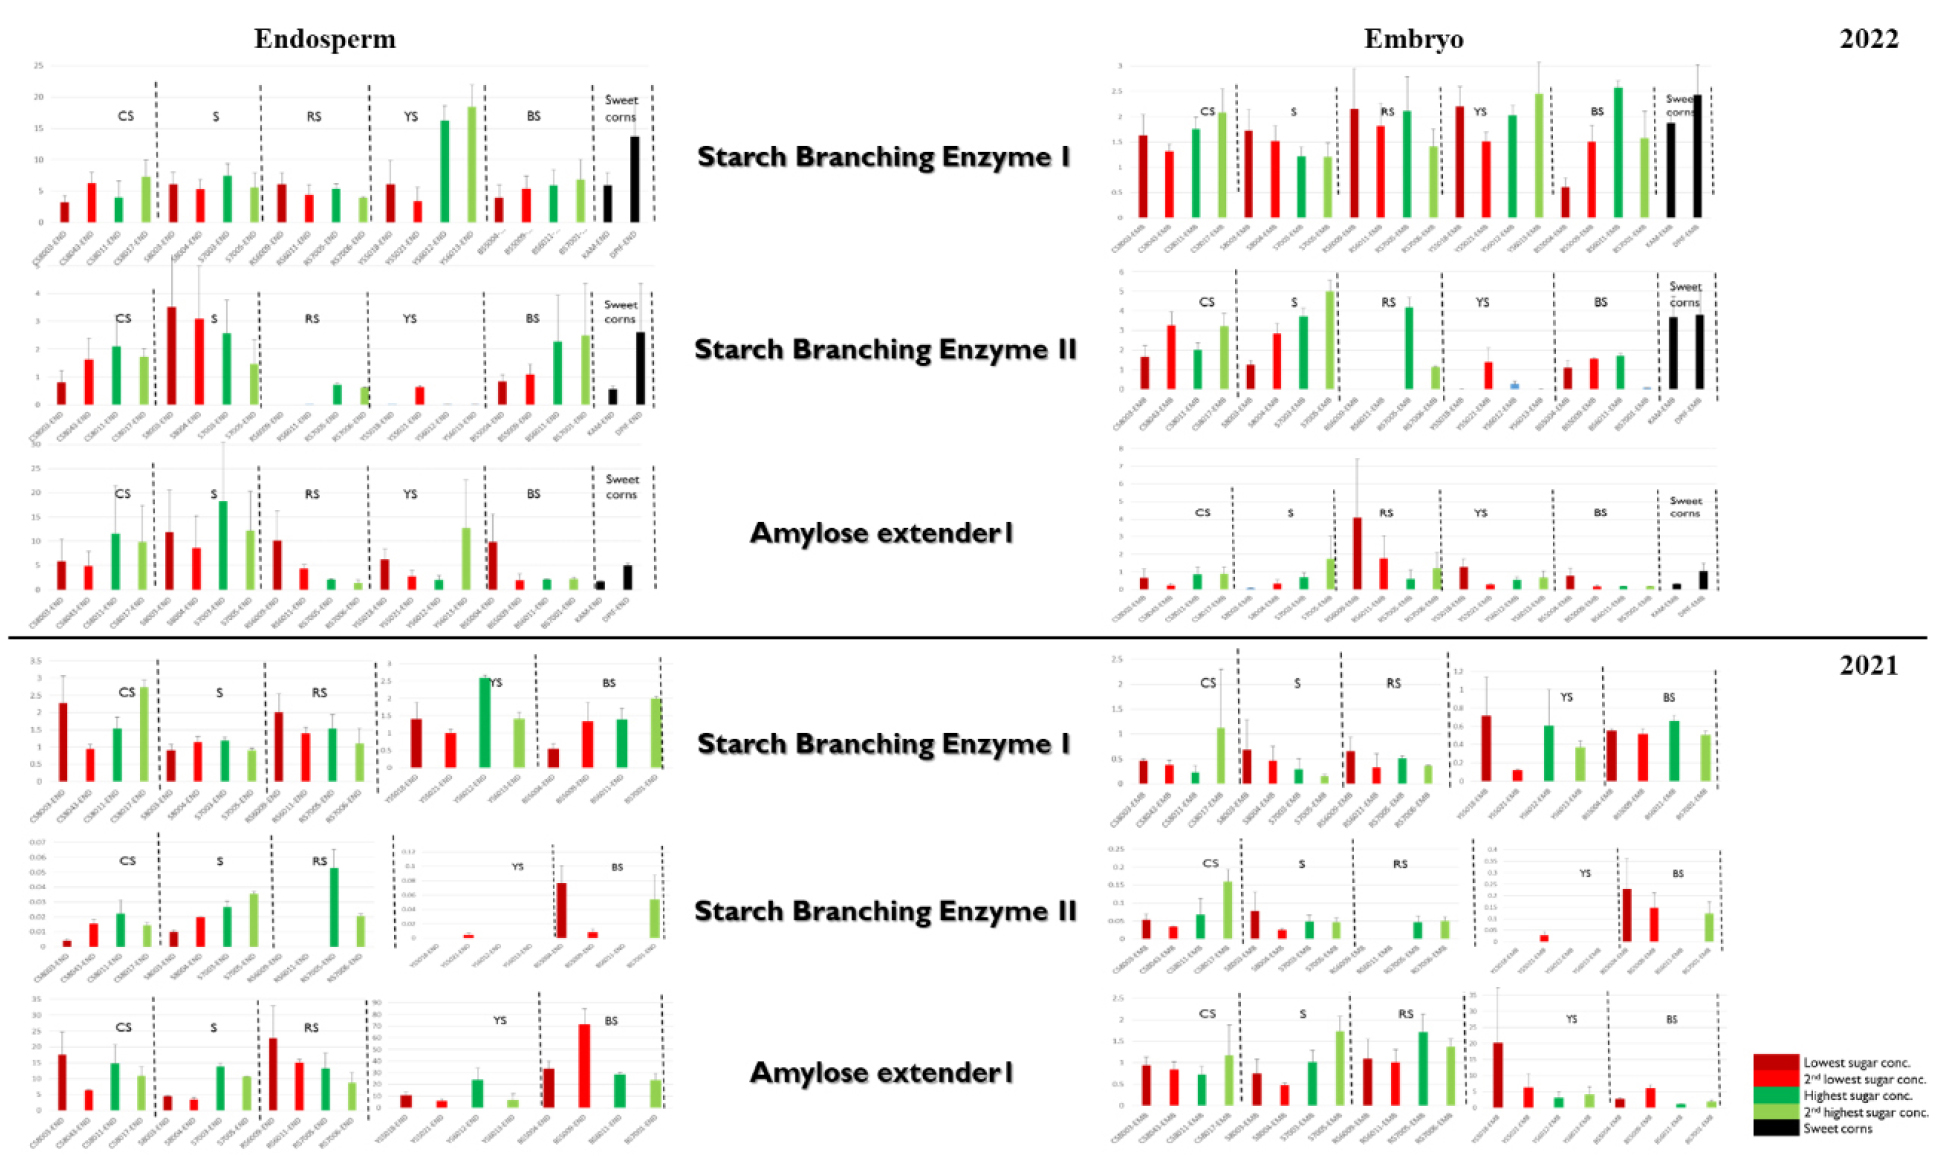
Across both years, SBEI transcript levels in endosperm tended to increase from low to highsucrose cultivars within each color group, and this trend was particularly clear in the CS, YS, and RS groups (Fig. 5a). In graphical summaries that order cultivars from lowest to highest sucrose content (plus sweet corn references), SBEI expression typically followed the same order, with sweet corn and highsucrose waxy lines clustering at the highexpression end.
SBEIIb expression was more restricted but also showed notable associations with sucrose. In some groups, such as YS, SBEIIb transcripts were detectable primarily in the highestsucrose cultivar (e.g. YS5021) and nearly absent in lowsucrose lines, whereas in other groups (e.g. RS) SBEIIb expression increased markedly in highsucrose cultivars compared with lowsucrose cultivars. AE1 (SBEIIa) was generally expressed at relatively high levels across cultivars, but its expression pattern was often complementary to that of SBEIIb within groups. For example, in RS lowsucrose lines AE1 expression was high whereas SBEIIb expression was nearly absent, whereas in highsucrose RS lines SBEIIb expression increased and the relative dominance of AE1 vs. SBEIIb shifted.
When SBE expression data from 2021 and 2022 were combined and visualized alongside sucrose concentrations (Fig. 5), the strongest and most consistent positive relationship with sucrose content was observed for SBEI in endosperm, followed by more groupspecific associations for SBEIIb. These results highlight starch branching enzymes—especially SBEI and, in some groups, SBEIIb—as candidate levers for modulating sweetness in waxy maize without dramatically reducing total starch.
Integrative relationships between sugar content and gene expression
Taken together, the data indicate that variation in kernel sucrose content among waxy maize inbred lines is accompanied by coordinated but categoryspecific changes in expression of sugar-starch pathway genes. Most genes were more highly expressed in endosperm than in cotyledon, underscoring the central role of endosperm in sugar-starch interconversion at 21 DAP.
Qualitatively, sucrose cleavers, intermediateproduct enzymes, and sugar influx ratelimiting factors showed only modest and sometimes inconsistent differences between low and highsucrose cultivars, suggesting that these upstream steps are not the main drivers of the sucrose variation observed in this waxy panel. By contrast, starch branching enzymes, particularly SBEI and SBEIIb, displayed clear positive associations with sucrose content in endosperm across years and, in many cases, across cultivar groups, while DBE and fructosemetabolizing genes showed more subtle, groupdependent differences.
These results support the working hypothesis that downstream enzymes in the starch assembly pathway, especially starch branching enzymes, represent promising targets for finetuning sweetness in waxy maize. Enhancing or modulating the expression of selected SBE isoforms may allow modest increases in soluble sugar levels without the severe reductions in starch accumulation typically associated with mutations in upstream sucrosecleaving or AGPase genes.
Discussion
The present study combined phenotypic profiling of soluble sugars with expression analysis of sugar-starch pathway genes in waxy and colored waxy maize to identify candidate genetic factors associated with high sucrose accumulation in kernels harvested at 21 days after pollination (DAP). Across two growing seasons, sucrose was the predominant soluble sugar, while glucose and fructose contributed a smaller but nonnegligible portion of total sweetness. These sugar profiles differed consistently among the breeding line groups defined by kernel color (BS, YS, RS, CS and standard sweet checks), and were only modestly affected by year-to-year environmental variation.
Two-year sugar profiling highlights YS and RS groups as high-sugar genetic resources
In both 2021 and 2022, YS and RS lines showed higher mean sucrose concentrations than BS lines, with RS lines further distinguished by elevated glucose and fructose, suggesting a more complex sweetness profile. The introduction of supersweet checks such as ‘3511R’, ‘Mega080’, and ‘Geumdang’ in 2022, which carry major-effect sweet corn alleles, widened the overall sugar range but did not alter the relative ranking among waxy breeding groups, indicating that the YS and RS lines possess intrinsic, group-specific tendencies for high sugar accumulation rather than environment-driven effects.
These findings are broadly consistent with previous work showing substantial genetic variation for endosperm carbohydrates among sweet and nonsweet maize types, with endosperm genotype exerting a strong effect on sucrose and total sugar content across harvest dates(De Vries et al., 2016). While classic sweet corn types (e.g., sh2 and su1) achieve extreme sweetness via loss-of-function mutations in starch biosynthetic genes, our materials rely mainly on native allelic variation within the waxy genetic background, which appears to modulate sugar retention more subtly but in a group-dependent manner.
Sugar-starch pathway expression patterns emphasize the endosperm
Consistent with the central role of endosperm as the major sink for carbohydrate during kernel filling, most of the 25 sugar-starch pathway genes examined showed higher transcript abundance in endosperm than in cotyledon at 21 DAP. This agrees with the established model in which sucrose imported via the maternal phloem is cleaved to hexoses, converted to ADPglucose, and ultimately incorporated into amylopectin and amylose by the coordinated action of multiple starch synthases, branching enzymes, and debranching enzymes in amyloplasts (Huang et al., 2021).
Within this framework, our expression data suggest that upstream sugar supply steps (e.g., sucrose synthase, vacuolar invertase, and ADPglucose pyrophosphorylase) are not the primary determinants of the observed sucrose differences among waxy groups. Despite substantial divergence in soluble sugar levels, transcript levels for several of these genes showed only modest group-wise variation. This is consistent with previous reports indicating that strong sweetness differences in sweet corn are typically associated with large-effect structural mutations (e.g., sh2, su1, se1) rather than quantitative expression differences in canonical sucrose metabolism genes (Dinges et al., 2001).
Starch branching enzymes as plausible modulators of sweetness in waxy maize
By contrast, several starch branching enzyme (SBE) genes, particularly SBEI and SBEIIb, displayed marked differences in expression between high-sugar (YS and RS) and low-sugar (BS) groups in endosperm, while showing smaller differences in cotyledon. Although the present study relied on transcript data rather than direct measurements of enzyme activity or starch fine structure, these patterns are notable because SBEs are recognized as key determinants of amylopectin architecture and granule properties in cereal endosperms (Tetlow and Emes, 2014).
SBEIIb in maize endosperm, in particular, plays a crucial role in defining branch frequency and chain-length distributions; loss- or reduction-of-function alleles in cereals typically decrease the degree of branching, increase apparent amylose or long-chain amylopectin content, and alter starch granule morphology and digestibility (Tetlow and Emes, 2017). In maize, SBEIIb participates in high-molecular-weight protein complexes with other starch biosynthetic enzymes, and its phosphorylation state modulates protein-protein interactions and catalytic properties (Tetlow and Emes, 2017).
Our data suggest that, even in the amylose-free waxy background, quantitative variation in SBEI and SBEIIb expression may shift the balance between rapid channeling of sucrose into starch and transient retention of soluble sugars in the endosperm. Lines and groups with relatively lower SBEIIb expression (or a different ratio of SBEI:SBEIIb) at 21 DAP tended to show higher sucrose concentrations, whereas those with higher SBEIIb transcript levels were associated with lower sugars and presumably more efficient starch deposition. This pattern is conceptually similar to the effects of partial SBE suppression in wheat and other cereals, where altered branching leads to modified carbon partitioning and end-use quality, although the phenotypic consequences in waxy maize appear to be subtler than in highamylose mutants (Botticella et al., 2018).
Taken together, these observations support a model in which branching enzymes act as “gatekeepers” that fine-tune flux from sucrose into insoluble starch in developing waxy kernels. In contrast to the drastic sweetness gains (and agronomic penalties) associated with major starch mutants such as sh2 and su1, moderate shifts in SBE dosage or activity could modulate sweetness and texture in colored waxy maize while preserving overall starch yield.
Future perspectives
Future work should expand these analyses in several directions. At the phenotypic level, integrating multi-stage sugar and starch measurements with sensory evaluation would clarify how group-specific sugar profiles translate into perceived sweetness and texture. At the molecular level, genome-wide association or QTL mapping based on the broader 2021-2022 panel could identify loci controlling sucrose accumulation and/or SBE expression, which could then be functionally validated through near-isogenic lines or genome editing.
Finally, integrating transcriptomics, proteomics, and starch structural analyses in a subset of contrasting YS, RS, and BS lines would help to test the working model that starch branching enzymes act as fine-tuning nodes controlling flux from sucrose to starch in waxy maize. Such a systems-level understanding will be crucial for designing breeding strategies that deliver high-sugar, colored waxy cultivars with stable agronomic performance under diverse environments.