

Introduction
Materials and Methods
Temperature and Humidity Measurement
Fungal Concentration Measurement
Isolation and Identification of Fungi
Results and Discussion
Temperature and Humidity of the Tropical Plant Resource Center at KNA
Changes in Fungal Concentration at the KNA Tropical Plant Resource Center
Investigation of Fungal Diversity at the KNA Tropical Plant Resource Center
Conclusion
Introduction
Indoor air pollution refers to the contamination of air, caused by highly complex factors, in various indoor spaces. Pollutants responsible for indoor air quality degradation can be categorized into chemical pollutants; such as various gaseous substances (SOx, NOx), radioactive materials, fine dust, formaldehyde, asbestos, and cigarette smoke; and biological pollutants, such as bacteria, mold, and viruses (González-Martín et al., 2021).
The seriousness of indoor air pollution has been increasingly recognized, prompting extensive research to address the issue. Most studies have primarily focused on volatile organic compounds (VOCs) and heavy metals contained in dust. However, an essential aspect of indoor air quality that requires investigation is biological pollutants, such as airborne bacteria and fungi (Finnegan et al., 1984; Kim et al., 2014). These biological pollutants, collectively referred to as bioaerosols, include irritants such as intracellular endotoxins, infectious bacteria, and allergens. Notably, bioaerosols with particle sizes of 5-10 µm can settle in the upper respiratory tract and cause rhinitis, while those smaller than 5 µm are known to trigger allergies through alveolar deposition (Pastuszka et al., 2000).
The U.S. National Institute for Occupational Safety and Health (NIOSH) reported, based on over 500 studies, that bioaerosols accounted for 5% of the causes of primary indoor air pollution in the 1970s and 1980s (Lewis, 1994). However, this proportion has increased since the 1990s to 35-50% (Lewis, 1994). Furthermore, the World Health Organization (WHO) has recognized the significant health impacts of indoor air pollution on occupants and has provided indoor air quality guidelines for biological agents, including bioaerosols (Heseltine and Rosen, 2009; Macher, 1999). As interest in bioaerosols has grown and guidelines have been established, research on bioaerosols has also increased.
In South Korea, the Ministry of Environment enacted the “Indoor Air Quality Control Act for Multi-Use Facilities” in 2004, recognizing the potential health risks and severity of exposure to biological pollutants in indoor environments. This legislation set the maintenance standard for total airborne bioaerosols at 800 CFU/m3 for large-scale childcare and social welfare facilities (Jeon and Hwang, 2015). However, information on airborne bacteria and fungi in multi-use indoor spaces insufficient, with domestic studies to date limited to specific types of multi-use facilities (Kim et al., 2006a, 2006b, 2006c; Song et al., 2007).
Since the onset of the COVID-19 pandemic, the growing number of visitors to indoor exhibition facilities, such as ecological exhibition halls and botanical gardens, has increased the need to identify and address biological hazards. Artificial environments, like those maintained at the Korea National Arboretum (KNA) Tropical Plant Resource Center, where temperature and humidity are consistently regulated throughout the year, are highly favorable for the proliferation of fungi known to harm human health (Kim et al., 2023). However, data on the types and risks of airborne fungi present in indoor environments in Korea remain scarce, making it challenging to assess the health risks associated with fungal contamination and develop mitigation measures (Huh et al., 2012). Existing regulations do not outline any management measures for fungi detected in high concentrations when measuring indoor air quality (Joo et al., 2013). Therefore, this study seeks to provide foundational data for establishing management guidelines for harmful fungi as biological hazards in ecological exhibition facilities. It does so by analyzing changes in fungal concentrations in response to temperature and humidity variations in the Tropical Plant Resource Center at KNA and investigating fungal diversity under varying environmental conditions.
Materials and Methods
Temperature and Humidity Measurement
Temperature and humidity in the KNA Tropical Plant Resource Center were measured using data loggers (HOBO Data loggers, Optic USB Base Station, USA). The loggers were installed in shaded areas to avoid direct exposure to sunlight and precipitation. Measurements were taken on the same days mold sampling was performed, and daily temperature and humidity data were recorded. Three repetitions of each measurement were performed at each site during the first and third Wednesdays of every month from February to September. The results were presented as average values.
Fungal Concentration Measurement
Fungal concentrations were measured using the impaction method, which collects airborne fungi by drawing air at a set volume and impacting it onto a culture medium (Hwang et al., 2018). Potato dextrose agar (PDA; 39 g/L, MBcell, USA), a medium commonly used for fungal cultivation, was prepared in Petri dishes and mounted on a biological air sampler (Trio Bas [3 heads], ORUM, USA). Sampling was conducted at identical indoor and outdoor locations within the KNA Tropical Plant Resource Center. Fungi were collected at a flow rate of 200 L/min, twice a month, with three repetitions per session, and impacted onto the media.
The collected fungi were incubated at 25°C and 60% humidity for 46 hours in an incubator, and the resulting colony counts were recorded. Colony counts from the contact plate surface were corrected using JMP (JMP Statistical Discovery LLC, USA) statistical analysis software for the statistical probabilities of overlapping particles passing through the same hole (Meier and Zingre, 2000). The formula used for analysis is as follows:
V: Sampled air volume, R: Colony count (CFU) on the plate, Pr: Probability obtained from positive hole correction, X: CFU per 1,000 L of air
Isolation and Identification of Fungi
To isolate the fungi present in the indoor and outdoor air of the KNA Tropical Plant Resource Center, fungal spores were collected twice a month, with three repetitions per session. The collection method involved placing prepared PDA media plates at designated locations (10 areas) and collecting fungal spores settling by gravity for 10-15 minutes. Three plates were used for each location, and the collected spore plates were incubated at 25°C for 3-5 days. Single colonies were isolated through 1-3 rounds of purification based on morphological characteristics, such as colony shape and color. For precise fungal strain identification, 18S rRNA analysis was conducted. Genetic material was amplified using a universal primer set (NS1 - 5’GTA GTC ATA TGC TTG TCT C3’; NS24 - 5’TCC GCA GGT TCA CCT ACG GA3’), followed by sequencing (White, 1990). The resulting sequences were matched with strains in the NCBI GenBank database using BLAST searches, identifying fungal strains with over 98% homology.
Results and Discussion
Temperature and Humidity of the Tropical Plant Resource Center at KNA
Two indoor measurement sites were selected within the KNA Tropical Plant Resource Center: SITE 1, characterized by a high density of trees, and SITE 2, with lower tree density and higher sunlight exposure. Additionally, an outdoor site was designated as the control. Temperature and humidity variations at all sites were recorded using data loggers.
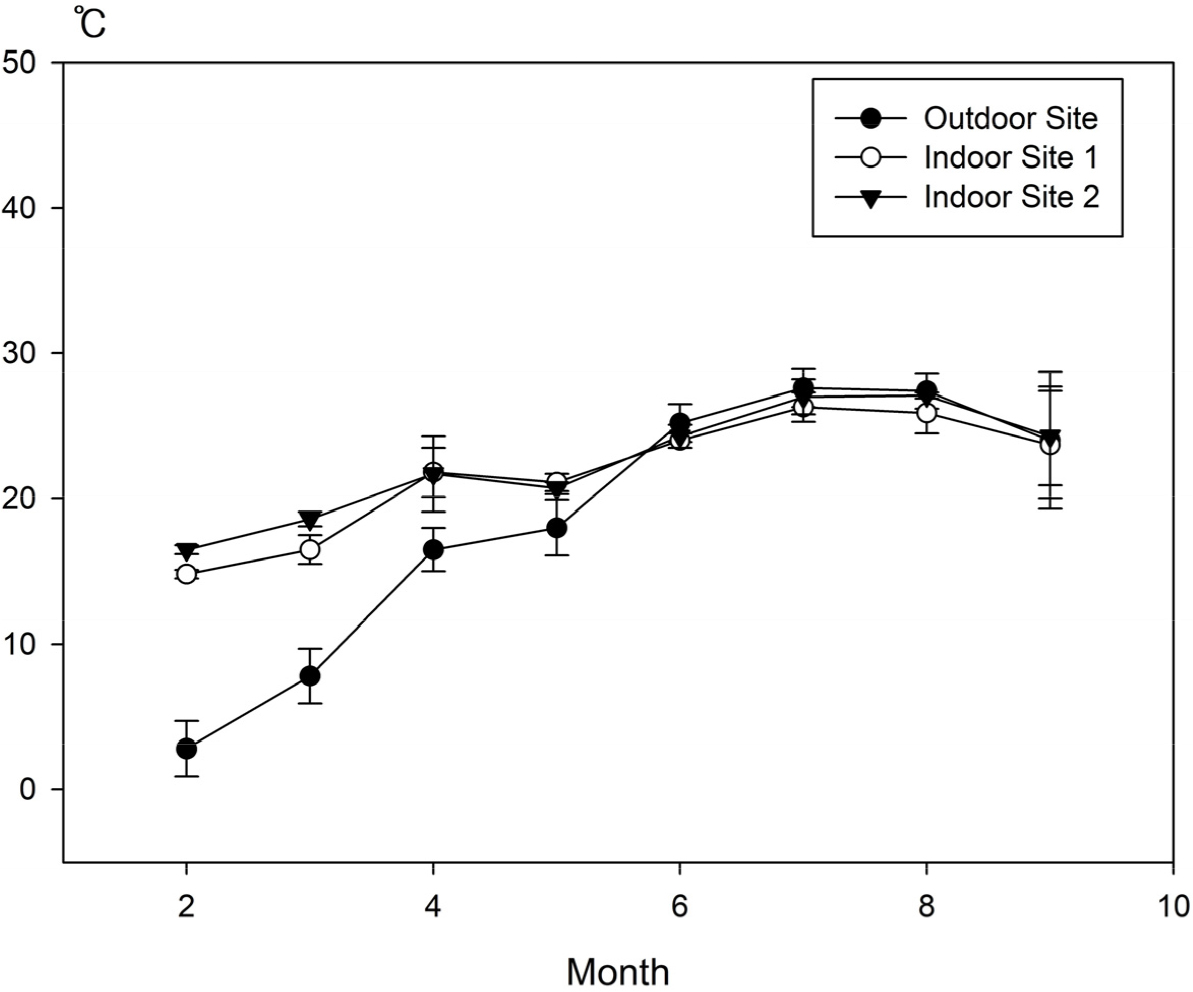
The average monthly temperatures at the external site of the center were recorded as follows: February, 2.8 ± 1.9°C; March, 7.8 ± 1.9°C; April, 16.5 ± 1.5°C; May, 18.0 ± 2.6°C; June, 25.2 ± 1.3°C; July, 27.6 ± 1.3°C; August, 27.4 ± 1.2°C; and September, 24.0 ± 4.7°C. The average daily minimum and maximum temperatures were -3.4°C and 30.6°C, respectively, and the highest diurnal temperature variation was 34°C (Fig. 1). The average monthly temperatures at SITE 1 inside the center were as follows: February, 14.8 ± 0.3°C; March, 16.5 ± 1.0°C; April, 21.8 ± 1.7°C; May, 21.1 ± 0.6°C; June, 24.0 ± 0.5°C; July, 26.3 ± 1.0°C; August, 25.9 ± 1.4°C; and September, 23.7 ± 3.7°C (Fig. 1). The average daily minimum and maximum temperatures were 12.3°C and 28.8°C, respectively, resulting in a diurnal temperature variation of 16.5°C (Fig. 1). The average monthly temperatures at SITE 2 inside the center were as follows: February, 16.5 ± 0.3°C; March, 18.6 ± 0.5°C; April, 21.7 ± 2.6°C; May, 20.7 ± 0.4°C; June, 24.3 ± 0.8°C; July, 27.0 ± 1.2°C; August, 27.1 ± 0.2°C; and September, 24.3 ± 3.4°C (Fig. 1). The average daily minimum and maximum temperatures were 13.6°C and 29.8°C, respectively, with a diurnal temperature variation of 16.2°C (Fig. 1). In summary, SITE 2 exhibited slightly higher average monthly temperatures and daily minimum and maximum temperatures compared with SITE 1. The diurnal humidity variations between SITES 1 and 2 did not differ significantly (Fig. 1).
The average monthly humidity at the external site of the center was recorded as follows: February, 62.8 ± 7.6%; March, 79.0 ± 13.8%; April, 64.7 ± 5.6%; May, 73.9 ± 11.9%; June, 68.2 ± 3.5%; July, 82.6 ± 4.2%; August, 85.9 ± 8.9%; and September, 82.9 ± 1.5% (Fig. 2). The average daily minimum and maximum humidity was 38.3% and 98.7%, respectively, resulting in the highest diurnal humidity variation of 60.4%. The monthly average humidity at SITE 1 inside the center was as follows: February, 78.1 ± 3.4%; March, 75.1 ± 2.7%; April, 71.4 ± 11.0%; May, 73.6 ± 6.3%; June, 71.6 ± 1.9%; July, 84.8 ± 4.4%; August, 89.8±4.9%; and September, 82.8 ± 0.6% (Fig. 2). The average daily minimum and maximum humidity was 54.1% and 98.7%, respectively, resulting in a diurnal humidity variation of 44.6%. The average monthly humidity at SITE 2 inside the Tropical Plant Resource Center was: February, 64.5 ± 0.6%; March, 69.4 ± 7.5%; April, 67.3 ± 11.7%; May, 75.6 ± 8.3%; June, 72.7 ± 0.8%; July, 86.2 ± 6.0%; August, 87.9 ± 5.5%; and September, 84.0 ± 0.6% (Fig. 2). The average daily minimum and maximum humidity was 49.8% and 97.6%, respectively, resulting in a diurnal humidity variation of 47.8%. In summary, SITE 1 showed slightly higher average monthly humidity and daily minimum and maximum humidity compared with SITE 2. The diurnal humidity variations between SITES 1 and 2 were not significantly different (Fig. 2).
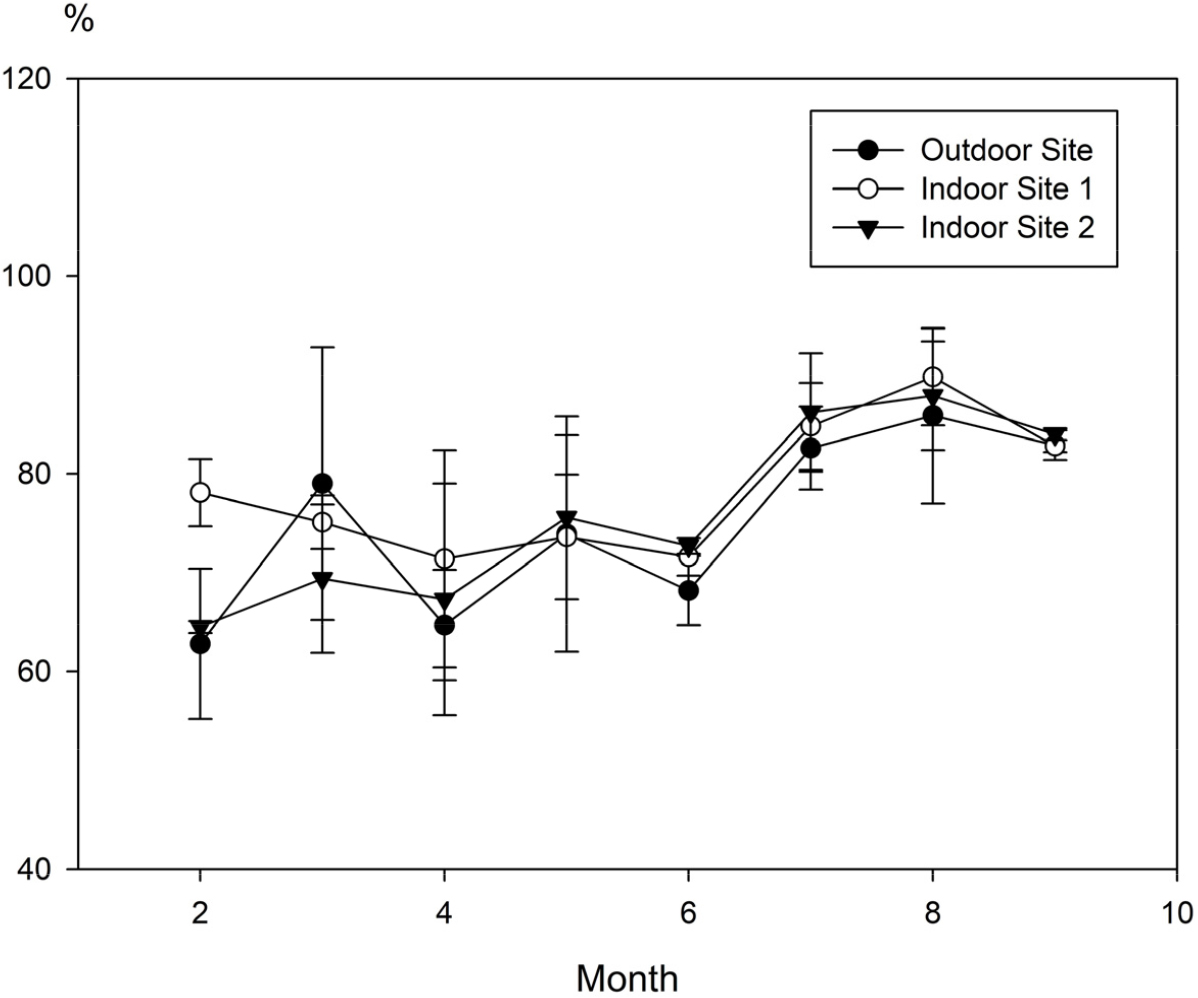
The temperature and humidity readings suggest, the Tropical Plant Resource Center’s internal environment (average daily temperature and humidity variations: 16.3°C and 46.2%, respectively) exhibited conditions that were more stable and favorable for fungal growth compared with the external environment (average daily temperature and humidity variations: 34°C and 60.4%, respectively). These stable temperature and humidity conditions inside the center provide an environment conducive to the proliferation of airborne bioaerosols. Previous studies also identified that greenhouse environments with stable temperature and humidity levels promote fungal growth, contributing to the increased density of airborne bioaerosols (Ercilla-Montserrat et al., 2017).
Changes in Fungal Concentration at the KNA Tropical Plant Resource Center
Fig. 3 illustrates the distribution characteristics of fungal concentrations at each site, using the maximum, minimum, and median values to represent the first and third quartile values based on the data collected over 9 months.
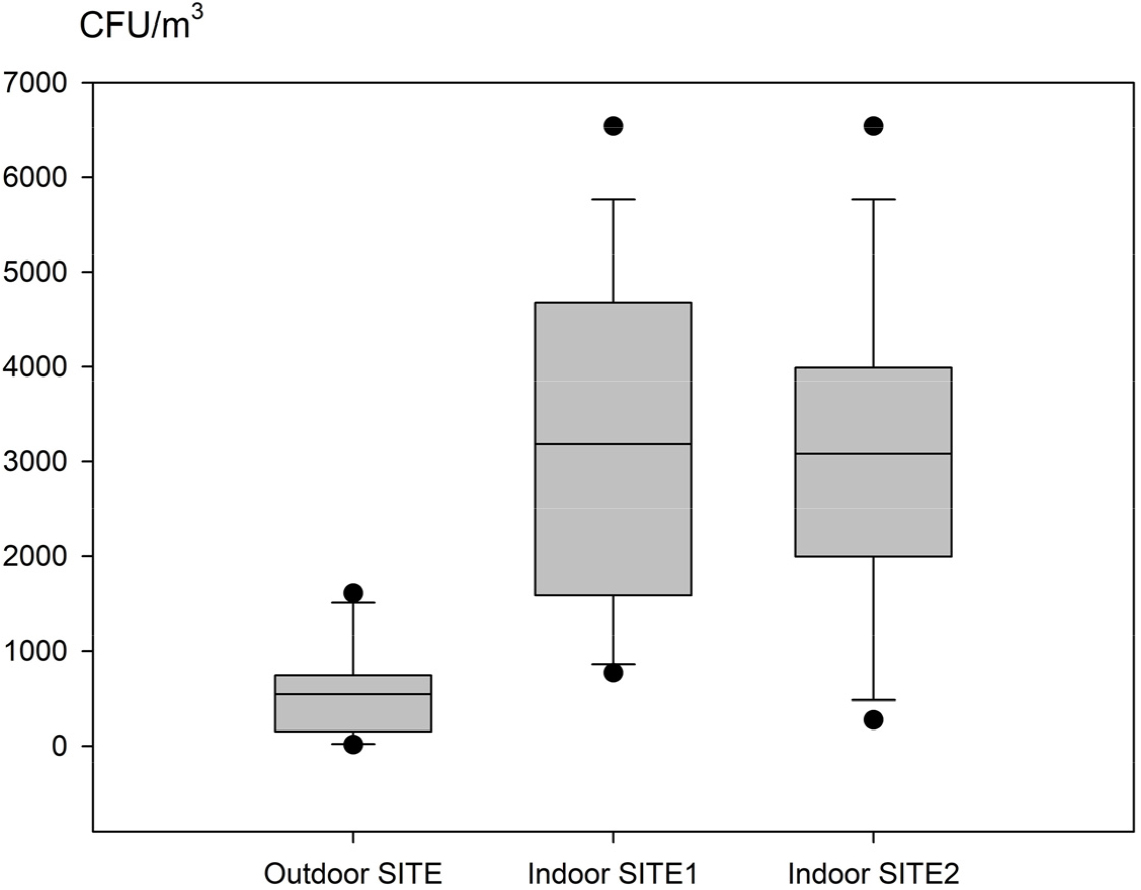
The median fungal concentrations at the external site, internal SITE 1, and internal SITE 2 were 547.1 CFU/m3, 3,193.8 CFU/m3, and 3,091.2 CFU/m3, respectively. The fungal concentrations at internal SITES 1 and 2 were higher than those at the external site, and there was no significant difference between the medians of SITES 1 and 2. However, the minimum and maximum fungal concentrations at SITES 1 and 2 did show some variation. SITE 1 had a minimum fungal concentration of 770 CFU/m3 and a maximum of 6,535 CFU/m3, while the respective values at SITE 2 were 275 CFU/m3 and 6,535 CFU/m3.
The first quartile fungal concentrations at the external site, internal SITE 1, and internal SITE 2 were 163.5 CFU/m3, 1,597.3 CFU/m3, and 1,996.3 CFU/m3, respectively. Internal SITES 1 and 2 showed higher fungal concentrations than the external site, although the first quartile value of SITE 2 was higher than that of SITE 1. The third quartile fungal concentrations were 750.0 CFU/m3 at the external site, 4,685.5 CFU/m3 at internal SITE 1, and 3,994.3 CFU/m3 at internal SITE 2. Internal SITES 1 and 2 had higher fungal concentrations than the external site, but SITE 2 had a lower third quartile value than SITE 1.
This finding suggests that fungal distribution at SITE 2 remains relatively stable throughout the seasons, and changes in temperature and humidity appear to influence fungal distribution density, as demonstrated by previous findings (Pastuszka et al., 2000; Song et al., 2007). The use of CFU measurements for airborne fungal detection was found to be an appropriate method for quantifying fungal spores in greenhouse air and assessing air quality in such environments (Flannigan, 1997; Rao et al., 1996; Ren et al., 2001).
Investigation of Fungal Diversity at the KNA Tropical Plant Resource Center
Next, we isolated fungi from the indoor and outdoor air at the Tropical Plant Resource Center and identified them by matching strains with over 98% homology through sequencing and BLAST search (Table 1). Specifically, PCR (Polymerase Chain Reaction) was performed targeting the ITS region (Internal Transcribed Spacer), using primers ITS1 and ITS4 for amplification.
Thus, as shown in Table 1, a total of 49 species of fungi were isolated from indoor SITE 1, and a total of 54 species were isolated from indoor SITE 2. Additionally, a total of 20 species of fungi were isolated from the external area of the center. In particular, fungal distribution was consistently observed at SITE 2 regardless of the season, and this site exhibited the highest fungal diversity (Table 1). This indicates that the fungal diversity inside the center, where temperature and humidity are maintained, is much higher (Table 1).
Six fungal strains Cladosporium cladosporioides, Cladosporium sp., Cladosporium sphaerospermum, Cladosporium tenuissimum, Epicoccum layuense, and Fusarium sp. were present in internal SITE 1, SITE 2, and the external site. These fungi are presumed to have been introduced from the external site to the inside of the center, where they have settled. Notably, three species Cladosporium sp., Cladosporium sphaerospermum, and Fusarium sp. are known to be harmful to humans. They are reported to produce allergy-inducing compounds that cause issues like rhinitis, asthma, and respiratory diseases (Gaskin et al., 2012; Gravesen, 1979). Additionally, Cladosporium sp. has been reported to be strongly associated with respiratory problems in children exposed to indoor environments. This suggests that the Tropical Plant Resource Center, a popular site for both children and adults, could be a source of respiratory diseases. Therefore, continuous monitoring of the concentration of opportunistic pathogens that may infect individuals with weakened immune systems, especially children, is recommended. An integrated management approach combining biological, chemical, and mechanical methods should be considered to prevent this (Kumar et al., 2023).
Currently, there are no specific regulations or standards regarding biological agents in ecological facilities to ensure visitor safety in our country. Therefore, appropriate temperature and humidity regulations must be established using the baseline data obtained from this study on fungi. Furthermore, a system for proposing indoor air quality guidelines and monitoring indoor air quality should be established.
Table 1.
Fungi strains isolated inside and outside the Tropical Plant Resource Center at Korea National Arboretum
Conclusion
This study was conducted to investigate the variations in temperature and humidity inside and outside the KNA Tropical Plant Resource Center and analyze the corresponding changes in fungal concentration and diversity. The goal was to provide foundational data for fungal management within the facility. By analyzing and comparing the internal environment of the center, divided into SITE 1 (high tree density) and SITE 2 (low tree density, abundant sunlight), with the external environment, it was confirmed that the internal environment of the center maintains higher temperature and humidity levels than the outside environment, creating a highly favorable environment for fungal growth. Additionally, various types of fungi were found in high concentrations inside the center, and there was a significant presence of harmful fungi that pose a risk to human health. This indicates that the high temperature and humidity inside the center promote fungal proliferation, suggesting that the internal environment may cause allergic reactions and respiratory diseases. These findings can serve as foundational data for establishing guidelines for bioaerosols to ensure the safety of visitors within the Tropical Plant Resource Center. Furthermore, it is deemed necessary to establish a system for monitoring and managing these factors.
