


Introduction
Materials and Methods
Case Study Area: Smart Farm Innovation Valley in Sangju
Estimation of Heating Load
Power Generation Fuel and Operation Model
System and Capital Configuration
Economic Evaluation
Levelized Cost of Heat
Results and Discussion
Annual thermal demand and plant capacity factor estimation
Techno-economic performance under optimal heat-led operation
Sensitivity analysis and policy implications
Scale optimization and economic trade-off analysis
Environmental and socioeconomic implications
Levelized cost of heat comparison
Conclusion
Introduction
In response to the growing global efforts to combat climate change and establish sustainable agricultural systems, the agricultural sector is also required to transition toward systems that simultaneously achieve energy self-sufficiency and greenhouse gas (GHG) reduction (Soussi et al., 2025). In smart farming environments, thermal energy demand—especially for heating—accounts for a significant share of energy use, often reaching 60-80% depending on climate (Nawalany et al., 2024). Seasonal fluctuations further destabilize energy supply and increase operating costs (Soussi et al., 2025), highlighting the need for efficient and renewable energy-based solutions in greenhouse operations (Saidur et al., 2011).
Traditionally, fossil fuel-based boiler systems, such as those using kerosene and liquefied petroleum gas (LPG), have been predominantly used for heating in agriculture. Various studies have been conducted to address these heating-related issues. Seo et al. (2017) proposed a renewable energy-based model to improve energy self-sufficiency in Korean agricultural facilities, particularly greenhouses (Seo et al., 2017). The study analysed a hybrid system combining solar PV, geothermal heat pumps, and biomass boilers, aiming to replace conventional fossil fuel-dependent heating systems. Using simulations and techno-economic analysis, the authors demonstrated that such integrated systems can reduce annual energy costs and greenhouse gas emissions significantly. Lee et al. (2021) evaluated three hybrid greenhouse heating systems using renewable energy. Among them, the system combining a hydrothermal heat pump with a pellet boiler showed the best performance, reducing energy use and cost by 25.7% and 24.1%, respectively. A 10-year cost and life cycle analysis confirmed it as the most economical option, with 27.7% lower cost than fossil fuel boilers (Lee et al., 2021). The study also emphasizes that initial capital investment and site-specific energy demand patterns are critical factors for practical deployment. Nevertheless, conventional fossil fuel-based systems remain major contributors to high fuel costs and GHG emissions (Perron, 2023).
Among renewable thermal energy technologies, biomass-based combined heat and power (CHP) systems have gained attention as a promising alternative capable of providing both heat and electricity simultaneously. Biomass is considered carbon-neutral, and utilizing underused domestic forest resources not only supports GHG reduction but also contributes to sustainable forest management and regional economic activation (Pääkkönen and Joronen, 2019; Padinger et al., 2019). Recent studies have shown that small- to medium-scale biomass CHP systems can achieve favourable energy efficiency and economic returns under appropriate design and operational conditions (Ahamer, 2024; Du et al., 2024).
Nevertheless, widespread deployment of biomass CHP systems faces several challenges. High initial capital investment, complex fuel logistics, and scale limitations often constrain adoption in agricultural settings. Dell’Antonia et al. (2014) reported that although small-scale CHP plants are technically feasible, the high cost of equipment, installation, and grid integration (€4,040-7,429 kWe-1) poses a major barrier (Dell’Antonia et al., 2014). Economic viability is generally achieved when facilities are located near biomass sources and operate at high load factors (Nicholls et al., 2018). Smallholder farms, with limited heat demand and higher relative energy costs, face even greater challenges (Brown and Mann, 2008).
Accordingly, a comprehensive techno-economic and environmental assessment is required to evaluate the feasibility of biomass-based CHP systems under realistic agricultural conditions. This study aims to assess the applicability of a forest-biomass-fuelled CHP system for a large-scale smart farming complex in Korea. Using the Smart Farm Innovation Valley in Sangju as a case study, multiple system capacities (1-9.9 MWe) were simulated under heat-led operation to evaluate energy production, economic performance, and carbon reduction potential. The results provide quantitative evidence for optimizing system scale and policy strategies to expand decentralized renewable heat supply in the agricultural sector.
Materials and Methods
Case Study Area: Smart Farm Innovation Valley in Sangju
The case study was conducted in the Smart Farm Innovation Valley located in Sangju, Gyeongsangbuk-do, Republic of Korea. The site spans a total area of 10 ha and represents a large-scale agricultural complex actively implementing advanced smart farming technologies. To evaluate the feasibility of a biomass-based energy system, it was assumed that a CHP plant would be constructed to supply thermal energy for greenhouse heating at the site. The biomass fuel was assumed to consist of wood chips produced from unused forest biomass sourced from the Forest Biomass Utilization Centre, which is planned to be located in Seongju-gun, Gyeongsangbuk-do. This configuration reflects a realistic regional resource linkage, leveraging local biomass for decentralized energy production.
Estimation of Heating Load
To estimate the heating load for the target site, historical meteorological data from Sangju, Gyeongsangbuk-do, were analysed, focusing on air temperature. The optimal temperature for the reference crop—tomato—was set at 25°C, based on standard greenhouse cultivation practices (Lee et al., 2019). Although the biologically optimal night time temperature for tomato cultivation is typically reported as 15-18°C, commercial greenhouse heating systems often maintain higher operational setpoints during the heating season to ensure yield stability, minimize cold stress risk, and simplify temperature control strategies. In addition, to prevent underestimation of heating demand and to ensure conservative infrastructure sizing at the feasibility stage, a uniform setpoint of 25°C was adopted throughout the calculation. The daily average heating load was calculated using the temperature difference between the external environment and this operational setpoint, thereby reflecting dynamic thermal gradients rather than a fixed daytime-only growth condition.
The parameters used in calculating the daily heating load are summarised below (Lee et al., 2019; Song et al., 2008). Among these, the correction factors reflect structural heat-transfer characteristics and climatic adjustment parameters derived from standard greenhouse heat-loss formulations. The selected values were determined using long-term meteorological data for Sangju and greenhouse design coefficients commonly adopted in domestic feasibility studies. Conservative assumptions were applied to avoid underestimation of heating demand during the system-planning stage. The total daily heating load (Qg) was computed using Eq. (1). Heat loss through the greenhouse covering area, ventilation area, and floor area were calculated separately using Eqs. (2), (3), (4), respectively. These calculations consider surface area, thermal transmittance, temperature gradients, and safety factors, and are based on standard greenhouse thermal energy balance models.
Where, the maximum heating load, denoted as Qg [kcal/h], was calculated based on the thermal losses through the greenhouse envelope, ventilation, and the ground. In this study, Ag and As represent the greenhouse covering area and floor area, respectively [m2]. The terms qt, qv, and qs refer to the thermal load per unit area [kcal/m2・h] through covering, ventilation, and ground heat transfer, respectively. The wind correction coefficient fw was set to 1.0 in this study. The thermal transmittance coefficient (ht) was applied as 4.50 kcal/m2・h・°C, and Ts, Ta, and Tg indicate the internal greenhouse temperature, ambient air temperature, and ground temperature [°C], respectively. A safety factor Sf of 1.2 was applied to the total heating load, and a heating reduction factor fr of 0.71 was used to account for thermal insulation coverage. The ventilation heat loss coefficient (hv) and the ground heat transfer coefficient (hs) were set to 0.20 kcal/m2・h・°C and 0.244 kcal/m2・h・°C, respectively.
Power Generation Fuel and Operation Model
In this study, forest biomass wood chips collected from the Gyeongsangbuk-do region were selected as the primary fuel for power generation. The lower heating value (LHV) of the biomass was assumed to be 2,500 Mcal/ton (Choi et al., 2022). To avoid regulatory complexities such as the environmental impact assessment required for facilities with installed capacities of 10 MW or more in Korea, the installed power capacities were limited to below 10 MWe (Kim and Um, 2022). The plant was operated under a heat-led dispatch strategy, in which the hourly thermal demand of the 10 ha greenhouse governs the system output. In this operation mode, the plant produces as much heat as required by the instantaneous thermal load, up to its rated thermal capacity, while electricity generation is treated as a by-product of heat supply. The hourly supplied thermal energy Qth is defined as the lower value between the rated thermal output Qth,r and the instantaneous thermal load Qload (Eq. (5)).
The corresponding electricity generation Eele(t) is assumed to vary proportionally with the supplied heat according to the ratio of the actual to the rated thermal output (Eq. (6)).
where, Qth(t) refers supplied thermal energy (MWhth); Qth,r stands for rated thermal capacity (MWth); Qload(t) means instantaneous thermal load (MWth); Eele(t) refers generated electricity (MWhe); Pinstall means installed electrical capacity (MWe).
In this study, the total fuel input was calculated inversely from the required useful heat output. The objective of this analysis is to assess system-scale techno-economic feasibility at the planning stage rather than to reconstruct measured operational performance. Therefore, the required heat supply was treated as the primary design constraint, and the corresponding fuel input was determined using the assumed thermal efficiency. This approach ensures internal energy-balance consistency while enabling capacity-scale estimation under predefined heating demand conditions. The total fuel input Qin was calculated from the thermal efficiency ηth as (Eq. (7)).
and the relationship between the rated thermal output and the electrical efficiency ηele is expressed as (Eq. (8)).
Where, ηth refers thermal efficiency (-); ηele stands for electrical efficiency (-).
Unmet thermal load at each hour t was defined as (Eq. (9)).
The total annual supplied heat Eth,yr and the thermal capacity factor CFth were determined using the following relations Eqs. (10), (11).
where, Eth,yr refers annual supplied heat (MWhth/yr); CFth stands for thermal capacity factor (%); 8760 means total annual operating hours (h/yr).
System and Capital Configuration
System Configuration
A stationary biomass-based CHP system using wood chips was assumed. The system was operated according to a heat-led dispatch model that matches the hourly heating load of the 10 ha site. To conservatively estimate the energy yield, low-quality, high-moisture wood chips with a heating value of 2,500 Mcal/ton were considered. The system’s electrical efficiency (ηele) was set at 20%, and the thermal efficiency (ηth) was set at 55% (Suh and Kim, 2012).
Of the electricity generated, 20% was assumed to be consumed internally for auxiliary loads such as pumps, fuel-feeding systems, air blowers, ash handling, control equipment, and general plant maintenance, leaving the remaining 80% available for external supply and revenue generation.
In biomass-based heat-led CHP systems, a non-negligible portion of generated electricity is typically required for the operation of such auxiliary equipment. Operational data reported for domestic woodchip CHP plants indicate that the internal electricity consumption ratio converges to approximately 20% under stable operating conditions. Accordingly, this study adopts a 20% internal consumption assumption, which reflects observed operational characteristics and provides a conservative estimate for system-level planning (Skorek-Osikowska et al., 2014; Suh and Kim, 2012).
Capital Expenditures
According to prior studies, the capital cost of biomass power plants varies widely across regions due to differences in labour, construction, and equipment costs. A comparative summary of unit installation costs for biomass-based CHP systems in various countries is presented in Table 1 (Badouard et al., 2020). Among these, Japan’s unit cost was selected as the reference for this study because it provides a realistic benchmark for Korea, reflecting similar geographic, technological, and economic conditions. Moreover, the Japanese dataset includes auxiliary components such as heat exchangers, absorption chillers, and control units, making it more suitable for evaluating the combined heat and power configuration applied here. Although Japanese unit costs were adopted as the primary benchmark due to technological similarity, a supplementary comparison with Korean case studies indicates that the assumed value remains within the domestic range (An, 2019; Cho et al., 2025; Min et al., 2022; Suh and Kim, 2012). The reported unit CAPEX values (€/kWe) represent the electrical-side cost of CHP systems. To express the overall system cost on a thermal basis, a conversion using the heat-to-power ratio (ηth/ηele = 2.75) was applied, yielding an equivalent unit CAPEX of 1,127 €/kWth for the heat-led system. The currency conversion was performed using the 2023 average exchange rate of €1 = ₩1,400, reflecting recent market conditions.
The capital structure was assumed to be 100% debt-financed, representing a conservative scenario in which the entire initial investment is covered through external loans. The debt repayment was modelled using the annuity method with equal principal and interest payments over a 20-year repayment period at a fixed interest rate.
Table 1.
Regional Variations in Capital Expenditure (CAPEX) for Biomass-Based CHP Systems
| Area | CAPEX [€/kWth] | CAPEX [₩/kWth] |
| EU | 982 | 1,374,800 |
| China | 364 | 509,600 |
| Japan | 1,127 | 4,340,000 |
| USA | 1,000 | 1,400,000 |
Annual Operating Expenditure Costs
The annual operating expenditure (OPEX) consisted of fuel, labour, maintenance, insurance, and contingency costs, as summarized in Table 2. Under the heat-led dispatch operation, the capacity factor was not fixed but determined by the hourly heating load profile of the 10 ha greenhouse. Consequently, both fuel consumption and annual operating hours varied with system scale, reflecting the actual degree of thermal demand coverage. For staffing, a five-shift rotation with three operators per shift was assumed, resulting in a total of 15 full-time personnel, consistent with typical operational requirements of small-scale biomass CHP facilities in Korea. Maintenance and insurance costs were set at 1.35% and 0.23% of the total CAPEX, respectively (Suh and Kim, 2012). In addition, a contingency reserve equal to 15% of the total annual OPEX was included to account for operational uncertainties, in line with international project management practices that recommend contingency rates between 10% and 20% (Rothwell, 2005; Sing et al., 2025).
Table 2.
Cost Assumptions for Annual Operating Expenses
Revenue
Under the heat-led dispatch operation, the primary energy output of the system is thermal energy, and electricity is generated as a by-product. For thermal energy sales, a conservative price of ₩145.82/Mcal was adopted, which is slightly lower than the standard commercial district-heating tariff published by the Korea District Heating Corporation (Korea District Heating Corporation, 2024). For electricity sales, the Korean guideline on the “Standard Pricing of Renewable Energy Power” specifies a fixed rate of ₩68.99/kWh and a variable rate defined as SMP + 5 KRW/kWh (MOTIE, 2023). Considering these factors, this study applied an average electricity selling price of ₩219.78/kWh, reflecting both the fixed and variable components as well as typical biomass power purchase agreements. Because the modelled plant uses woodchips as a renewable fuel, it was assumed to be eligible for carbon credit revenues. The amount of greenhouse-gas reduction was estimated using a life-cycle carbon balance, where baseline emissions from conventional fossil heating were compared with the total on-site and indirect emissions of the biomass system. It was calculated using Eqs. (12), (13), (14), (15). The corresponding carbon-credit revenue was then derived by multiplying the reduction amount by the unit carbon-allowance price (₩8,890/tCO2) applied in Korea’s Emission Trading Scheme.
Here, Ebaseline represents the baseline emissions from conventional fossil fuel-based heating systems, calculated from the annual useful heat output (EGheat,yr), the boiler efficiency (ηBL,FF), and the emission factor of fossil fuels (EFBL,FF = 0.073 tCO2/GJ). Eonsite denotes the direct CO2 emissions from the combustion of forest biomass, which were estimated using the annual biomass consumption (BFbiomass,yr) and the corresponding emission factor (EFCO2,LE = 0.0863 tCO2/ton). Eleakage accounts for the indirect emissions associated with internal electricity consumption, calculated as the product of annual internal electricity use (ECyr) and the national grid emission factor (EFgrid = 0.4434 tCO2 MWh).
Economic Evaluation
In this study, a comprehensive economic evaluation was conducted to assess the investment feasibility of the biomass-based CHP system. The analysis employed key financial indicators, including Net Present Value (NPV), Return on Investment (ROI), Benefit-Cost Ratio (B/C), Payback Period, and Internal Rate of Return (IRR) (Lee and Shin, 2021; Um and Kang, 2019).
The NPV represents the difference between the present value of future cash inflows and the initial capital investment, discounted over the project lifespan. It is calculated using Eq. (16), which accounts for the time value of money by discounting annual net cash flows to their present value (Sermyagina et al., 2016).
Here, Bt and Ct represent the benefits and costs in year t, respectively; r is the discount rate, I is the initial investment cost, and n is the project lifetime. The Return on Investment (ROI) is defined as the ratio of net profit to total investment and serves as a simple indicator of profitability and investment efficiency—where a higher ROI implies greater economic viability (Do et al., 2018). The B/C ratio is the ratio of the present value of benefits to the present value of costs, and it is used to evaluate cost-effectiveness. The B/C ratio is considered economically feasible when it is greater than or equal to 1.0. B/C ratio expressed as follows Eq. (17).
For the calculation of annualized capital cost, the capital recovery factor (CRF) was applied as follows Eq. (18).
where r represents the discount rate and n denotes the project lifetime.
The annualized capital cost was calculated by multiplying total initial investment by the CRF. It should be noted that the discount rate (r) used in the NPV formulation represents the financial discount rate, whereas the CRF is applied only for annualizing capital expenditure in cost calculations.
The Payback Period refers to the number of years required to recover the initial capital investment from net annual returns. The IRR is the discount rate at which the NPV becomes zero (Eq. (19)), representing the project’s internal profitability. It is commonly used as a benchmark to compare against the cost of capital, and an investment is generally considered viable when the IRR exceeds the discount rate (Abelha and Kiel, 2020).
Levelized Cost of Heat
The Levelized Cost of Heat (LCOH) represents the average cost per unit of thermal energy generated over the lifetime of a heating system (Lee and Cho, 2024). This metric is widely used to evaluate and compare the economic viability of different heat generation technologies—such as biomass-based combined heat and power systems, electric heat pumps, and fossil fuel boilers—under consistent financial assumptions (Ingenhoven et al., 2023).
The LCOH is calculated using the following general equation Eq. (20).
Where, It stands for capital expenditure in year t (CAPEX, including debt service), Ot refers for operational expenditures in year t (labour, maintenance, insurance, etc.), Ft represents fuel cost in year t, Qt signify useful heat output in year t [Mcal], r and n stands for discount rate and project lifetime (typically 20 years), respectively.
This levelized cost framework enables the integration of all relevant costs—both upfront and recurring—into a single metric, facilitating technology-neutral comparison.
Results and Discussion
Annual thermal demand and plant capacity factor estimation
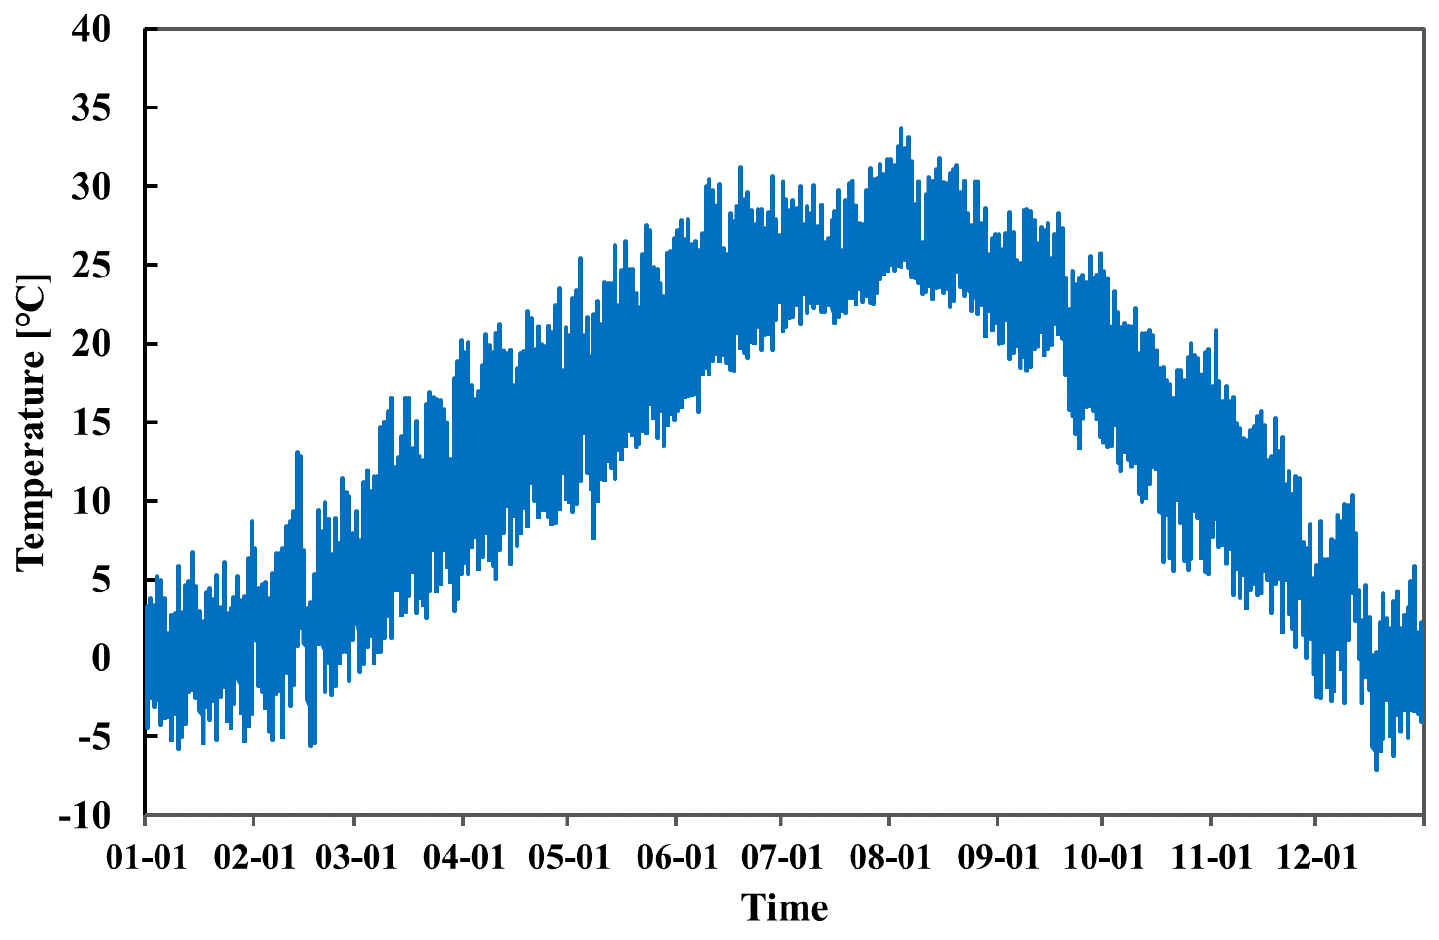
A dynamic heat-led dispatch simulation was conducted using the five-year hourly temperature profile of Sangju to evaluate the heating energy requirements for a 10-ha greenhouse. The representative hourly temperature variation used in the simulation is shown in Fig. 1, which reflects typical climatic conditions of the study area with pronounced seasonal amplitude. Based on this temperature data, the annual heating demand was estimated to be approximately 46.74 GWhth yr-1, corresponding to the total thermal energy required to offset envelope heat losses.
The combined CHP plant was simulated for installed electrical capacities ranging from 1 MWe to 9.9 MWe, equivalent to 2.75-27.23 MWth of rated thermal capacity under the assumed efficiency ratio (ηth/ηele = 2.75). Under heat-led dispatch, the plant produced heat to match instantaneous thermal demand up to its rated capacity, and any unmet portion was recorded as heat deficit.
Simulation results revealed a nonlinear relationship between capacity and utilization (Table 3). Systems smaller than 4 MWe could not meet the winter peak load, yielding coverage ratios below 97%. The 5 MWe (13.75 MWth) system achieved near-complete coverage (99.98%), with only 8.8 MWhth/yr of unmet heat. From 6 MWe and above, all hourly heating demands were satisfied, signifying full thermal self-sufficiency. The CFth decreased sharply with scale—from 73.5% at 1 MWe to 19.6% at 9.9 MWe—a typical characteristic of heat-led systems where oversized plants operate fewer full-load hours once annual demand is saturated. Specifically, equivalent full-load hours dropped from 6,436 h/yr at 1 MWe to 1,717 h/yr at 9.9 MWe.
Overall, the annual heating demand of 46.74 GWhth/yr can be fully met by a 5-6 MWe biomass CHP system under heat-led operation. The 5 MWe configuration provides near-complete coverage with minimal backup requirement, while 6 MWe ensures complete coverage at the expense of a lower utilization rate.
Table 3.
Heating-load coverage and thermal capacity factor of the biomass CHP system under heat-led operation
Techno-economic performance under optimal heat-led operation
Based on the dispatch outcomes, three representative scales—5, 5.5, and 6 MWe—were examined in detail. These capacities correspond to the smallest, intermediate, and fully self-sufficient configurations capable of meeting the fixed annual heating demand (46.74 GWhth/yr). Techno-economic performance was summarised at Table 4. Total installed capital investment was estimated at 21.70, 23.87, and 26.04 billion KRW for the 5, 5.5, and 6 MWe systems, respectively, assuming 4.34 billion KRW/MWe. Prior studies reported a unit CAPEX of approximately KRW 6.17 billion per MWe for operating a 9.28 MWe CHP plant (An, 2019). This higher value was largely driven by the cost of heat-transmission pipelines in mountainous terrain. Because the present facility is located on relatively flat ground, these pipeline costs are expected to be lower; therefore, a material difference in the overall unit cost is not anticipated. With a 20-year loan at 7% interest, the corresponding annualized capital costs were 2.05, 2.25, and 2.46 billion KRW/yr. Operating expenditure included fuel, labour, maintenance, insurance, and contingency. Because the heat load was fixed, total fuel use and cost remained nearly constant across scales, resulting in total OPEX 5.83, 6.35, and 6.39 billion KRW/yr. Labour expenses were fixed at 0.47 billion KRW/yr (15 operators, 3 shifts). Maintenance and insurance were estimated as 1.35% and 0.23% of CAPEX, respectively, with an additional 15% contingency.
Table 4.
Techno-economic performance of biomass CHP systems under heat-led operation
Total annual revenues—comprising heat, electricity, and carbon-credit income—were 8.11, 8.92, and 8.92 billion KRW/yr. With an electricity price of 219.78 KRW/kWh, external sales yielded 2.72-2.99 billion KRW/yr. Thermal-energy sales at 145.82 KRW/cal generated approximately 5.33-5.86 billion KRW/yr in all cases, while carbon trading contributed 66.70-73.37 million KRW/yr.
After deducting annualized CAPEX and OPEX, net profits were 238.96, 317.05, and 72.79 million KRW/yr for the 5, 5.5, and 6 MWe systems, respectively, corresponding to payback periods of 90.81, 75.29, and 357.75 years and annual ROI values of 1.10, 1.33, and 0.28%. Discounted over 20 years at 7%, the NPV values were 2.53, 3.36 and 0.77 billion KRW, and the B/C ratios were 1.03, 1.04 and 0.94, all exceeding 1.0. Hence, all configurations are economically feasible at current fuel and tariff levels, with the 5.5 MWe system offering the highest discounted return.
Overall, the 5.5 MWe configuration demonstrates the strongest economic performance, exhibiting the highest NPV (3.36 billion KRW), the highest ROI (1.33%), and the most favourable B/C ratio (1.04) among the three cases. The 5 MWe system remains economically viable with moderate profitability, while the 6 MWe configuration, although capable of ensuring full thermal self-sufficiency, shows significantly lower financial returns due to higher capital costs and limited additional revenue. These results indicate that a mid-scale, heat-led biomass CHP system can achieve an optimal balance between utilization efficiency and discounted economic return under current tariff and fuel-price conditions.
Sensitivity analysis and policy implications
A one-at-a-time sensitivity analysis varied electricity price, heat price, fuel cost, and carbon-credit price by ±10% and evaluated the induced changes in NPV, ROI, and B/C for the 5, 5.5, and 6 MWe configurations. The results were expressed in Table 5. Heat price was the dominant revenue lever in the +10% case: NPV increased by +8.18, +9.57, and +6.98 bn KRW for the 5, 5.5, and 6 MWe systems, respectively; ROI improved by +2.46, +2.46, and +2.25 percentage points, and B/C rose to 1.10, 1.10, and 1.07. A 10% reduction in heat price lowered ROI (-2.46 %p at 5.5 MWe; -2.25 %p at 6 MWe) and pushed B/C below unity for larger plants (0.97 at 5.5 MWe; 0.94 at 6 MWe), indicating infeasibility under heat-led dispatch.
Table 5.
Sensitivity of Economic Indicators (±10% change)
Fuel cost ranked second and remained asymmetric. A +10% increase produced modest deterioration (ΔNPV = -1.97, -1.60, and -4.18 bn KRW; B/C = 0.98, 0.98, and 0.96 for 5, 5.5, and 6 MWe), whereas a -10% decrease yielded large gains (ΔNPV = +7.04, +8.31, and +5.73 bn KRW) and improved B/C to 1.09, 1.10, and 1.06.
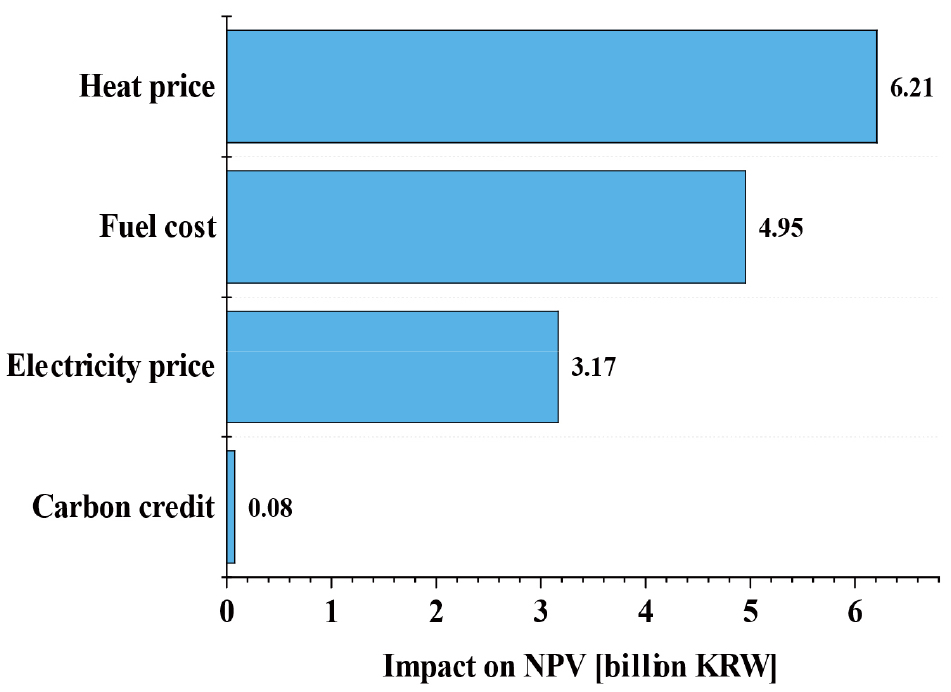
The electricity price exerted a moderate, positive effect in the +10% case (ΔNPV = +5.41, +6.52, and +3.94 bn KRW; B/C = 1.06, 1.07, and 1.04). The carbon-credit price had a minor role (for +10%: ΔNPV = +2.60, +3.44, and +0.85 bn KRW; B/C = 1.03, 1.04, and 1.01). Overall, project viability is most exposed to heat-tariff cuts and most responsive to fuel-price relief; electricity prices play a secondary role and carbon credits have limited leverage under current conditions. Policy instruments that stabilize heat tariffs (e.g., long-term heat-purchase contracts or FiP-style premiums) and reduce fuel-price risk (indexed contracts, hedging, or feedstock diversification) are therefore critical for investment security, particularly at ≥5.5 MWe. Fig. 2 summarizes the NPV sensitivity; heat price dominates, followed by fuel cost, whereas electricity and carbon credits are comparatively minor.
Scale optimization and economic trade-off analysis
To identify the optimal configuration of the biomass CHP system, the techno-economic performance of the three representative scales (5, 5.5, and 6 MWe) was comparatively evaluated under the same annual heating demand of 46.74 GWhth/yr. As installed electrical capacity increased from 5 to 6 MWe, the thermal capacity factor declined from 38.8% to 32.3%. This reduction reflects the inherent characteristic of heat-led dispatch, whereby plant utilization becomes constrained once the fixed annual thermal demand is fully satisfied. Larger systems therefore operate for fewer equivalent full-load hours.
Capital investment increased nearly linearly with scale, rising from 21.70 billion KRW (5 MWe) to 26.04 billion KRW (6 MWe). Under a 20-year loan at 7% interest, annualized capital costs ranged from 2.05 to 2.46 billion KRW/yr. Operating expenditure showed a moderate increase with scale (6.29-6.36 billion KRW/yr), primarily due to maintenance and insurance costs being proportional to CAPEX. However, fuel cost remained largely constant (4.25-4.68 billion KRW/yr) because total heat production was fixed.
Total annual revenue varied only slightly across configurations (8.11-8.92 billion KRW/yr), reflecting identical heat demand. Net profit levels were modest, amounting to 0.24, 0.32, and 0.07 billion KRW/yr for the 5, 5.5, and 6 MWe systems, respectively. The 5.5 MWe configuration achieved the highest ROI (1.33%) and NPV (3.36 billion KRW), while the 6 MWe plant exhibited substantially lower profitability due to higher capital intensity and reduced utilization.
Across all configurations, ROI ranged from 0.28% to 1.33%, and the B/C ratio varied between 0.94 and 1.04. These narrow margins indicate that once thermal demand is saturated, scaling up installed capacity does not significantly enhance financial returns. Instead, economic performance is more sensitive to tariff structures and fuel-cost conditions, as demonstrated in the subsequent sensitivity analysis. Improvements in conversion efficiency or stabilization of heat tariffs would therefore be more effective strategies than simple capacity expansion.
Environmental and socioeconomic implications
Replacing fossil-fuel boilers with biomass-fired CHP units resulted in substantial GHG mitigation owing to the carbon-neutral combustion of biomass and displacement of fossil heat. The estimated annual CO2 reductions were 7,890, 8,680, and 9,470 t CO2/yr for the 5, 5.5, and 6 MWe systems, respectively—an approximately 80% reduction relative to a kerosene-boiler baseline—equivalent to removing about 3,000-3,500 passenger cars from operation (Ministry of Climate Energy and Environment, 2003). The results were summarised in Table 6.
Beyond emission reduction, local procurement of wood-chip residues minimizes upstream transport emissions and supports regional circular-economy practices. Feedstock collection and processing create rural employment and strengthen energy self-reliance by substituting imported fossil fuels. Although carbon-credit income (approximately 0.07-0.08 billion KRW/yr) contributes marginally to revenue, it enhances the system’s sustainability profile and eligibility for national carbon-offset and renewable-heat programs.
Integrating these environmental and socioeconomic outcomes confirms that heat-led biomass CHP can simultaneously deliver GHG mitigation, rural economic activation, and stable thermal supply for controlled-environment agriculture. Policy mechanisms combining economic and environmental incentives—such as renewable-heat certificates, integrated carbon credits, and community biomass networks—are recommended to maximize these co-benefits.
Table 6.
Annual CO2 Reduction and Socioeconomic Impacts
| Capacity (MWe) | CO2 Reduction (tCO2/yr) | Reduction Rate (%) | Equivalent Cars Removed |
| 5.0 | 7,890 | 79.8 | ~3,000 |
| 5.5 | 8,680 | 81.0 | ~3,200 |
| 6.0 | 9,470 | 82.1 | ~3,500 |
Levelized cost of heat comparison
To contextualize techno-economic performance, the LCOH of the heat-led biomass CHP was compared with both renewable and fossil-fuel alternatives (Table 7). According to Matuszewska et al. (2020), a geothermal mobile thermal-energy-storage (M-TES) system achieved an LCOH of 138-179 KRW/Mcal, while a coal-boiler baseline yielded 126 KRW/Mcal (Matuszewska et al., 2020). In comparison, the biomass CHP presented an LCOH of 138-143 KRW/Mcal, positioning it between coal-based and geothermal systems and confirming its competitive standing among renewable-heat technologies.
Table 7.
Comparison of Levelized Cost of Heat
| System | Fuel Type |
LCOH (KRW/Mcal) |
CO2 Emission (tCO2/GJ) | Remarks | Ref |
|
Biomass CHP (5-6 MWe) | Woodchips | 138-143 | 0.0863 | Base-load, local fuel | In this study |
| Kerosene boiler |
Kerosene (0.92USD/L) | 159 | 0.073 | Fossil baseline | (Lee et al., 2022) |
| Diesel boiler |
Diesel (1.09 USD/L) | 183 | 0.074 | High emission | |
| Geothermal M-TES | - | 138-179 | ~0 | High CAPEX | (Matuszewska et al., 2020) |
| Electric heat pump |
Electricity (67 KRW/kWh, COP = 3-5) | 16-26 | 0.44×grid | Grid dependent |
(Agora Energiewende and Fraunhofer IEG, 2023; Christodoulides et al., 2025) |
Under Korean conditions, assuming a boiler efficiency of 0.90 and an exchange rate of 1 USD = 1,300 KRW, based on the 2023 average exchange rate, the effective heat costs for different fuels were estimated as follows. Kerosene corresponded to approximately 159 KRW/Mcal of useful heat output. Diesel fuel yielded an effective heat cost of about 183 KRW/Mcal (Lee et al., 2022). Electric heat pumps, assuming an electricity price of approximately 67 KRW per kWh and a coefficient of performance (COP) in the range of 3-5, exhibited the lowest heat cost, estimated at 16-26 KRW per Mcal. Although electric and geothermal systems yield the lowest theoretical LCOH, their applicability to large-scale greenhouse heating is limited by high upfront investment, grid dependency, and performance degradation at low ambient temperatures (Agora Energiewende and Fraunhofer IEG, 2023; Christodoulides et al., 2025).
Conversely, biomass CHP ensures continuous base-load heat and power generation using locally available residues, guaranteeing year-round reliability and grid-independent operation. Among the compared options, it therefore represents a practical compromise between cost, reliability, and scalability for decentralized renewable-heat supply in greenhouse systems.
Conclusion
This study evaluated the techno-economic and environmental feasibility of a heat-led biomass combined heat and power (CHP) system for a 10-ha smart greenhouse complex in Sangju, Korea. A dynamic dispatch model was applied to simulate system capacities ranging from 1 to 9.9 MWe, and three representative configurations (5, 5.5, and 6 MWe) were analysed in detail under identical annual heating demand conditions (46.74 GWhth/yr).
The simulation results demonstrate that a 5-6 MWe biomass CHP system can fully satisfy the annual heating demand under heat-led operation. The 5 MWe configuration achieved near-complete heat coverage (99.98%) with the highest utilization rate, while capacities ≥6 MWe ensured full thermal self-sufficiency but operated at reduced capacity factors due to demand saturation. Thermal capacity factors decreased from 38.8% (5 MWe) to 32.3% (6 MWe), indicating diminishing marginal utilization as installed capacity increases.
Economic analysis over a 20-year horizon (7% discount rate) showed that all three configurations remain marginally feasible under current tariff and fuel-price assumptions. The 5.5 MWe system exhibited the strongest discounted performance, with an NPV of 3.36 billion KRW, ROI of 1.33%, and B/C ratio of 1.04. The 5 MWe system achieved slightly lower profitability but maintained near-optimal capital efficiency. In contrast, the 6 MWe configuration demonstrated substantially reduced financial performance (ROI 0.28%; B/C 0.94) due to higher capital intensity and limited incremental revenue once thermal demand was fully met. These results confirm that mid-scale systems offer the most balanced trade-off between utilization and economic return under heat-led operation.
Sensitivity analysis revealed that project viability is most strongly influenced by heat-tariff levels, followed by fuel cost. A ±10% variation in heat price resulted in the largest changes in NPV and B/C, while electricity prices exerted a moderate effect and carbon-credit revenues had limited leverage under current conditions. These findings indicate that policy mechanisms stabilizing heat tariffs and mitigating fuel-price volatility are critical for investment security in decentralized biomass CHP projects.
From an environmental perspective, replacing fossil-fuel boilers with biomass CHP units reduced annual CO2 emissions by approximately 7,890-9,470 tCO2/yr, corresponding to nearly 80% reduction relative to kerosene-based heating. Beyond emission mitigation, the system supports local biomass utilization, rural employment, and energy self-reliance.
When compared with alternative heating technologies using the Levelized Cost of Heat framework, biomass CHP demonstrated competitive performance (132-147 KRW/Mcal), positioned between fossil boilers and geothermal systems. Although electric heat pumps exhibit lower theoretical heat costs, their practical applicability in large-scale greenhouse heating may be constrained by grid dependency and seasonal performance variability.
Overall, the results suggest that a mid-scale (approximately 5.5 MWe) heat-led biomass CHP system represents a technically feasible and economically balanced solution for decentralized renewable heat supply in controlled-environment agriculture. Future improvements in conversion efficiency, tariff reform, and integrated carbon-credit schemes could further enhance the viability of biomass-based CHP deployment in smart farming systems.