

Introduction
Materials and Methods
Plant materials and cultivation site
Wheat flour preparation
Color and whiteness of wheat flour powder
Analysis of nutrient content
Flour chemical composition
Gluten content
Flour quality analysis
Statistical analysis
Results and Discussion
Color and whiteness of wheat flour
Nutrient content of wheat flour
Chemical composition of wheat flour
Gluten content of wheat flour
Mixograph parameters
Implications of double cropping systems
Introduction
Agriculture is faced with the requirements of not only efficiently increasing crop yields but also satisfying consumer demands for potential human health and environmental benefits. Double cropping systems are expected to reduce environmental impacts as well as the energy and costs required for farmers. Double cropping systems are beneficial for diversifying the rotation, maximizing crop production, and increasing farmers’ profits, although traditional cropping systems under rice paddy fields are often inefficient regarding yield and crop quality. Our previous study found that the agronomic and economic usefulness of double cropping winter wheat (Triticum aestivum L.) with three rice alternative crops (black soybean, sesame, and perilla) was greater compared to the rice-wheat double cropping system prevalent in paddy fields in southern Korea (Oh et al., 2022). Incorporating rice alternative crops such as soybean, sesame, and perilla as pre-crops in paddy soil is expected to provide agronomic benefits by lowering soil density and increasing porosity. In addition, it could improve the concentrations of available phosphate (Av. P2O5), Ca2+, and Mg2+ in paddy soil (Oh et al., 2022; Oh and Seo, 2025). That is, cropping rice alternative crops as pre-crops in paddy soil could modify the physico-chemical properties of the soil to be more suitable for farming, resulting in increased grain yield. Furthermore, cropping systems with rice alternative crops are expected to improve the sustainability of crop production, enhance pest control, increase resilience to climate change, and/or reduce fertilizer usage (Ogazie et al., 2022). Cropping legumes or oilseed crops instead of rice improves soil health and reduces water requirements (Arora et al., 2020; Oh et al., 2022; Oh and Seo, 2025). Specifically, the soybean - wheat cropping system under paddy fields improved soil fertility and saved water compared with the rice-wheat cropping system (Ram et al., 2013).
Wheat quality depends on varieties, environmental factors, growth conditions, and agronomic practices during growth stages. The main wheat varieties cultivated in Korean farms are ‘Keumkang’, ‘Baekjung’, ‘Yeonbaek’, and ‘Jokyung’, which are used for baking and noodle making (Choi et al., 2015; Kang et al., 2014; Kim et al., 2013). Notably, grain yields of ‘Jokyung’ increased by 100 kg/10a or more in fields pre-cropped with rice alternative crops compared to rice pre-cropped fields, and its protein content and quality were higher compared to other varieties used mainly for baking (Oh et al., 2022). Cultivation of rice alternative crops not only enhances the physical and chemical properties of paddy soil but also contributes to the production of high-quality wheat suitable for baking (Oh et al., 2022; Oh and Seo, 2025). This indicates that applying these rice alternative crops as pre-crops in crop rotation could improve both grain yield and baking quality of wheat flour. Additionally, these rice alternative crops, such as soybean, sesame, and perilla, are compatible with winter wheat in crop rotation (Oh et al., 2022; Oh and Seo, 2025).
Therefore, in this study, winter wheat (Triticum aestivum L. cv. ‘Jokyung’) was cultivated in paddy fields pre-cropped with rice alternative crops (black soybean, sesame, and perilla), and its quality and baking applicability were investigated.
Materials and Methods
Plant materials and cultivation site
The study was carried out over three years (2020-2022) in the experimental paddy fields of NICS in Miryang, where rice had been repeatedly cultivated for several years. Winter wheat (Triticum aestivum L. cv. ‘Jokyung’) was cultivated in paddy fields in which the rice or its alternative crops (black soybean, sesame, and perilla) had been pre-cropped. The cultivation of each crop in each cropping system (rice-wheat, soybean-wheat, sesame-wheat, and perilla-wheat) followed the standard agricultural practices outlined in the Rural Development Administration’s standard farming manuals. Each experiment included four treatment blocks (rice-wheat, black soybean-wheat, sesame-wheat, and perilla-wheat cropping system), and each block was divided into four replicated plots with size of 60 m2 (3 m × 20 m). The plant materials used in this study focused on wheat as the final crop in each cropping system. Information on environmental conditions (air and soil) of the wheat fields and methods for obtaining agronomic traits, grain yield and quality data were described previously (Oh et al., 2022). The soil was plowed and leveled 10 days before sowing wheat. Fertilizer was applied at a rate of 4.0-8.3-4.1 kg/10a of N-P2O5-K2O before sowing wheat. Crop residues from the preceding crops were removed before plowing but the remaining stubbles were incorporated into the soil through plowing.
Wheat flour preparation
Grain samples were adjusted to 16% internal moisture with distilled water (Approved Method 26-95.01; AACCI, 2010). After overnight conditioning for at least 16 hr, grain samples were milled in a Quadrumat Jr. mill (Brabender OHG, Duisburg, Germany), and flour was collected from the troughs using a 100-mesh sieve (150 µm aperture), while the overs, consisting mostly of bran, were discarded. All samples had falling numbers (FN) over 300 sec, indicating that there is no detectable sprouting damage.
Color and whiteness of wheat flour powder
The color of wheat flour was determined using a colorimeter (CR-10; Konica-Minolta Co., Ltd, Osaka, Japan) and expressed as L* (lightness), a* (redness/greenness), and b* (yellowness/blueness). The whiteness index (WI) of the flour was calculated according to Nguimbou et al. (2012).
Analysis of nutrient content
Mineral nutrient contents of wheat flour were analyzed using an Inductively Coupled Plasma Spectrophotometer (ICP-Integra XL, GBC Scientific Equipment Pty Ltd., Victoria, Australia). Sulfuric acid was added at 350°C for complete digestion of the dried wheat flour, and then K, Ca, Mg, Fe, Mn, Zn, and Cu were determined by ICP spectrophotometer (NIAST, 2000). Total N content of the dried wheat flour was analyzed by using the Kjeldahl method, and P content by the vanadate method (NIAST, 2000).
Flour chemical composition
Moisture content of wheat flour was determined by gravimetric heating (130 ± 2°C for 2 h). Crude protein, ash, and fat content (14% moisture basis) were analyzed according to AACC methods 46-12, 08-01, and 30-25, respectively (AACC, 2000). Total starch content was determined using the enzymatic assay kits (Megazyme, Bray, Ireland) according to McCleary et al. (1997).
Gluten content
Wet and dry gluten contents were measured according to the AACC 38-12.02 procedure (AACCI, 2010) using Glutomatic 2200 (Perten Instrument, Hägersten, Sweden). Gluten was separated from wheat flour by washing and then centrifuging at 6,000 rpm to force the wet gluten through a specially constructed sieve under standard conditions. The weight of this gluten was taken as the wet gluten quantity. Dry gluten content was obtained by reweighing the gluten after drying the wet gluten for a few minutes. The gluten index (GI) was calculated as the percentage of gluten unable to pass through the sieve after centrifugation. Gluten moisture absorption (GMA) was calculated as follows:
Gluten moisture absorption (%) = (wet gluten - dry gluten) / wet gluten × 100
Flour quality analysis
Mixograph parameters were analyzed according to AACC method 54-40.02 (AACCI, 2010). A Mixograph fitted with a 10g bowl was used to measure dough rheological properties. Mixing speed was 88 rpm, and test duration was 10 min. The amount of water added to each flour sample was determined based on water absorption estimates obtained by NIR spectroscopy. Mixograph parameters were recorded using Mixograph (National Manufacturing Co., Lincoln, NE, USA) and MixSmart software (MixSmart for Windows Version 2.0.609, Lincoln, NE, USA). While many parameters were recorded by the software, only six were selected based on reproducibility to avoid redundancy: water absorption (WA), midline peak time (MPT), midline peak value (MPV), midline peak width (MPW), midline curve height at 8 min (MTxV), and midline curve width at 8 min (MTxW).
Statistical analysis
Statistical analyses were performed using PASW Statistics 18 (SPSS, Chicago, IL, USA) to calculate means, standard deviations, and significant differences (p < 0.05) using analysis of variance (ANOVA) and Duncan’s multiple range test. All measurements were conducted in triplicate.
Results and Discussion
Color and whiteness of wheat flour
Flour color plays a significant role in the end-use quality of wheat, particularly for bread and noodles, as it affects consumer acceptance, market value, and nutritional perception. The color values (L*, a*, b*) and whiteness index (WI) of wheat flour produced from fields pre-cropped with rice and its alternative crops (black soybean, sesame, and perilla) are presented in Fig. 1. The L*, a*, and b* values of wheat flour differed significantly (p < 0.05) depending on pre-cropped crops. The L* value and WI were lower in wheat harvested from fields pre-cropped with rice alternative crops than in wheat from rice pre-cropped fields (Fig. 1A and 1B). Low L* values and WI were probably due to increased protein and starch contents despite decreased ash content (Oh et al., 2022). The a* value was higher in wheat harvested from rice alternative pre-cropped fields (Fig. 1C), while the b* value showed the opposite pattern (Fig. 1D). These results suggest that flour from rice alternative pre-cropped fields may produce slightly darker bakery products. This indicates that pre-cropping with rice alternative crops could be less favorable in terms of color, as consumers tend to prefer white flours. However, darker wheat flour has higher protein and mineral contents, making it more suitable for industrial and nutritional purposes (Shewry and Hey, 2015).
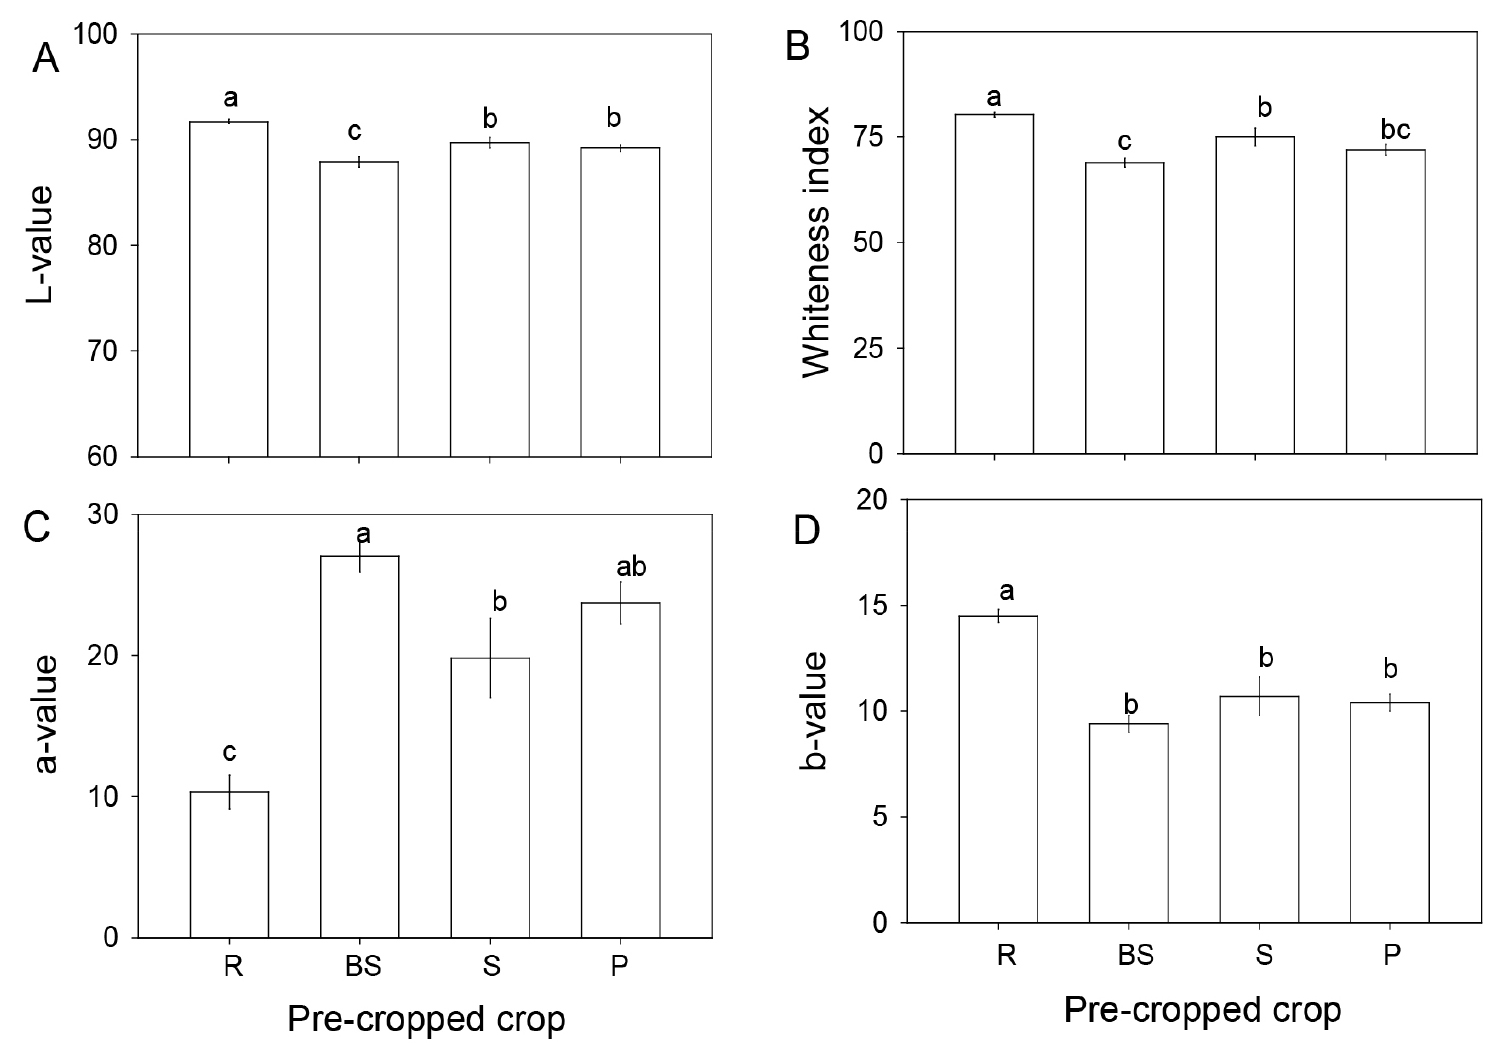
Fig. 1.
Color values of wheat flour from paddy fields pre-cropped with rice or rice-alternative crops. Values are expressed as means ± standard error of four replicates. Different letters within each column indicate significant differences among treatments by Duncan’s multiple test (p < 0.05). R, rice; BS, black soybean; S, sesame, P, perilla. L-value (0, black; 100, white), a-value (-100, green; +100, red), and b-value (-100, blue; +100, yellow).
Nutrient content of wheat flour
Further research on other nutrients and bioactive compounds is warranted to increase the nutritional value of wheat. Macro- and micro-nutrient contents of wheat flour from fields pre-cropped with rice alternative crops were generally higher or similar to those in wheat from rice pre-cropped fields (Table 1). Among macro-nutrients, P and Mg contents were particularly higher in wheat harvested from fields pre-cropped with black soybean, while K and Ca contents did not differ significantly among fields pre-cropped with rice or rice alternative crops. For micro-nutrients, Zn and Cu contents were higher in wheat harvested from fields pre-cropped with black soybean. Mn content was particularly higher in wheat harvested from fields pre-cropped with perilla, but lower in fields pre-cropped with black soybean and sesame. Fe content did not differ significantly among the fields. The economic value of wheat grains is determined by both production and quality. Macro- and micro-nutrient contents are important quality characteristics of wheat, making the production of nutrient-rich cereals a high priority for maintaining human health. In this context, soil conditions according to previous crop types are an important crop management strategy to improve wheat grain yield and increase nutrient concentration in edible parts. This has been confirmed in previous reports (Oh et al., 2022).
Table 1.
Mineral nutrient content of wheat flour from paddy fields pre-cropped with rice or rice-alternative crops
| Pre-cropped crop | Macro-nutrients (mg・g-1 DW) | Micro-nutrients (µg・g-1 DW) | ||||||
| P | K | Ca | Mg | Fe | Mn | Zn | Cu | |
| Rice | 1.19zby | 0.42a | 0.01a | 0.08b | 361.2a | 136.6ab | 168.7c | 5.8b |
| Black soybean | 1.39a | 0.42a | 0.02a | 0.10a | 340.3a | 124.9b | 217.6a | 19.0a |
| Sesame | 1.31a | 0.42a | 0.02a | 0.09ab | 353.2a | 117.7b | 199.5ab | 15.2a |
| Perilla | 1.30a | 0.41a | 0.01a | 0.09ab | 337.7a | 145.3a | 189.6bc | 14.0a |
Chemical composition of wheat flour
Crude protein content of wheat flour was higher in wheat harvested from fields pre-cropped with rice alternative crops than in rice pre-cropped fields. Total starch content was higher in wheat harvested from fields pre-cropped with black soybean and perilla. Lipid content ranged between 0.87% and 1.13%, with no significant differences among cropping systems. Ash content of wheat flour harvested from fields pre-cropped with black soybean or sesame was generally similar to that from rice pre-cropped fields, while lower in wheat harvested from perilla pre-cropped fields. Water content was lower in wheat harvested from fields pre-cropped with rice alternative crops (Table 2). Protein content is a primary factor determining flour quality (Ohm and Chung, 1999). Low protein content leads to longer dough mixing times and requires more effort to develop the dough (Shewry et al., 2002). In this study, protein content of wheat flour was higher in wheat harvested from fields pre-cropped with rice alternative crops than in rice pre-cropped fields (Table 2), suggesting that pre-cropping with rice alternative crops could be beneficial for producing flour suitable for dough development. In addition, starch contributes to bread volume as it gelatinizes during baking. These results indicate that pre-cropping with rice alternative crops is favorable for producing wheat flour compatible with the baking process.
Table 2.
Chemical composition of wheat flour from paddy fields pre-cropped with rice or rice-alternative crops
| Pre-cropped crop | Flour composition (%) | ||||
| Crude protein | Starch | Lipid | Ash | Water content | |
| Rice | 7.66 ± 0.02zcy | 42.3 ± 0.3c | 0.98 ± 0.07a | 0.56 ± 0.01a | 15.2 ± 0.07a |
| Black soybean | 9.45 ± 0.35a | 49.2 ± 1.0a | 1.13 ± 0.07a | 0.59 ± 0.01a | 14.9 ± 0.01c |
| Sesame | 8.49 ± 0.18b | 41.6 ± 0.5c | 1.10 ± 0.03a | 0.54 ± 0.01a | 15.0 ± 0.05b |
| Perilla | 9.04 ± 0.31ab | 46.4 ± 0.6b | 0.87 ± 0.13a | 0.45 ± 0.06b | 15.0 ± 0.02bc |
Gluten content of wheat flour
Wet and dry gluten contents, gluten index (GI), and gluten moisture absorption are presented in Fig. 2. Wet and dry gluten contents were significantly higher in wheat flour harvested from fields pre-cropped with rice alternative crops than from rice pre-cropped fields. Gluten index was slightly higher in wheat harvested from fields pre-cropped with rice alternative crops, although differences were not significant. Gluten moisture absorption ranged from 59.6% to 62.8%, and was slightly higher in wheat harvested from fields pre-cropped with rice and sesame. High gluten content improves wheat flour quality for bread-making, contributing to viscoelastic structure formation in dough (Day et al., 2006). Furthermore, higher moisture absorption is favorable in the food industry, as it increases the water-holding capacity of dough during bakery processing (Jacobs et al., 2016).
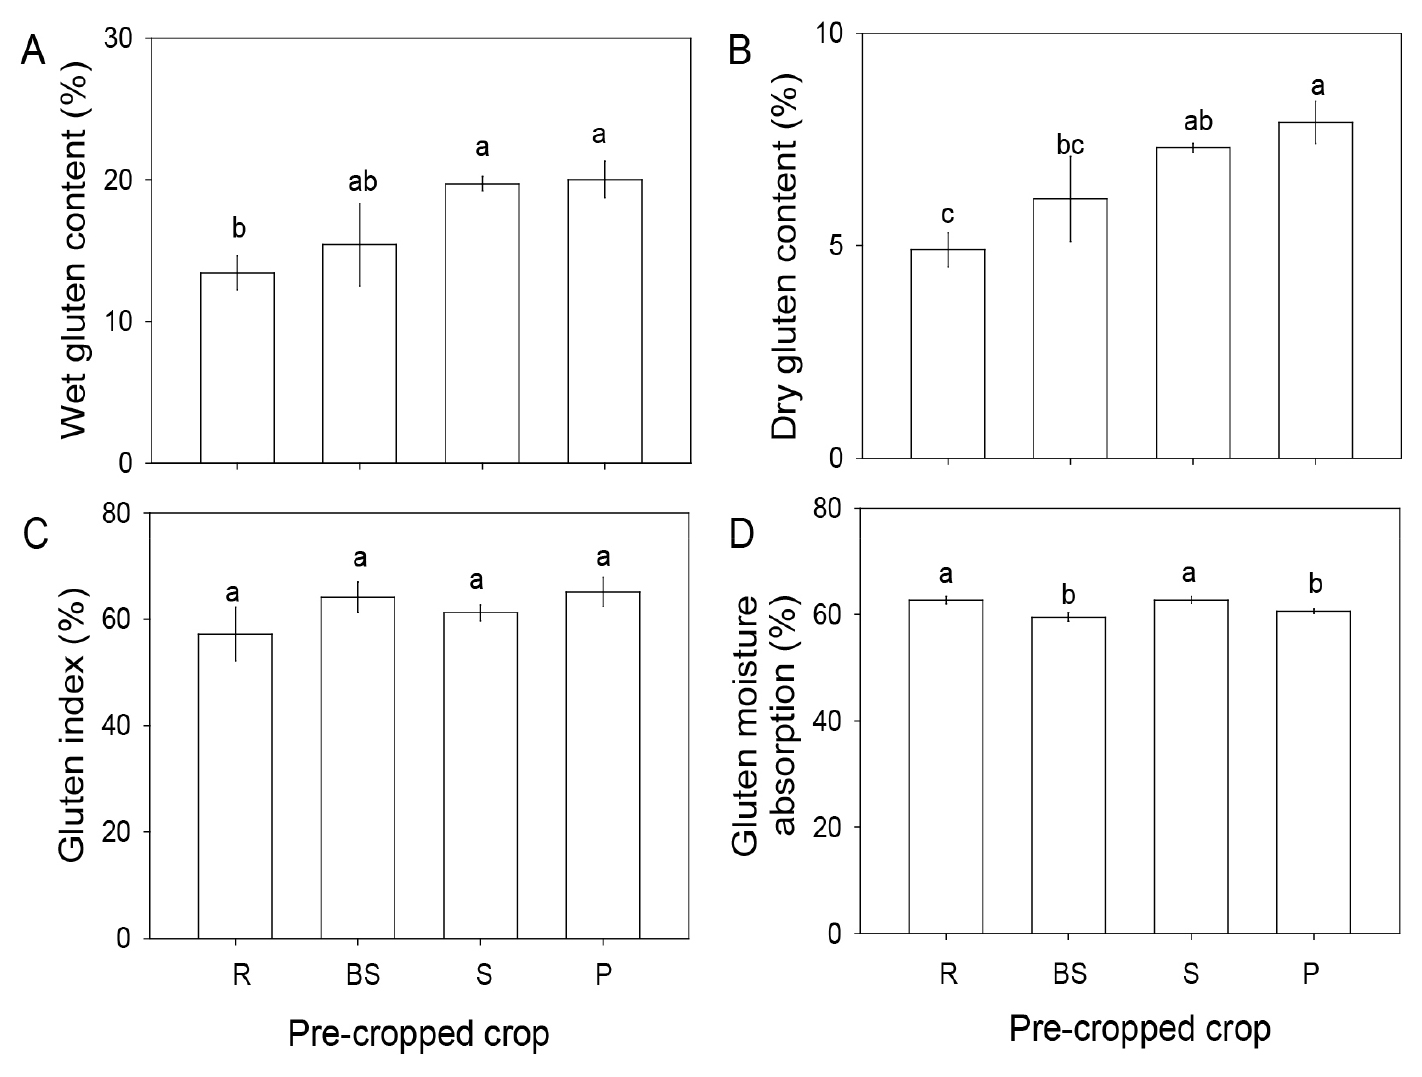
Fig. 2.
Guten properties of wheat flour from paddy fields pre-cropped with rice or rice-alternative crops. Values are expressed as means ± standard error of four replicates. Different letters within each column indicate significant differences among treatment by Duncan’s multiple test (p < 0.05). R, rice; BS, black soybean; S, sesame, P, perilla.
Mixograph parameters
Mixograph parameters are important for assessing flour quality (Ohm and Chung, 1999) and are useful not only for evaluating dough time, strength, and stability, but also for predicting bread-making potential. Among mixograph parameters, water absorption (WA) and midline peak time (MPT) differed significantly (p<0.05) depending on pre-crops. Water absorption of wheat flour was higher, and midline peak time was shorter in wheat harvested from fields pre-cropped with rice alternative crops compared to rice pre-cropped fields. Midline curve height at 8 min (MTxV) and midline curve width at 8 min (MTxW) did not differ among pre-cropped fields (Fig. 3). Water absorption of wheat flour has been reported to correlate positively with protein and wet gluten content (Dabčević et al., 2009). In this study, the high water absorption agrees with increased protein and gluten contents (Table 2, Fig. 2).
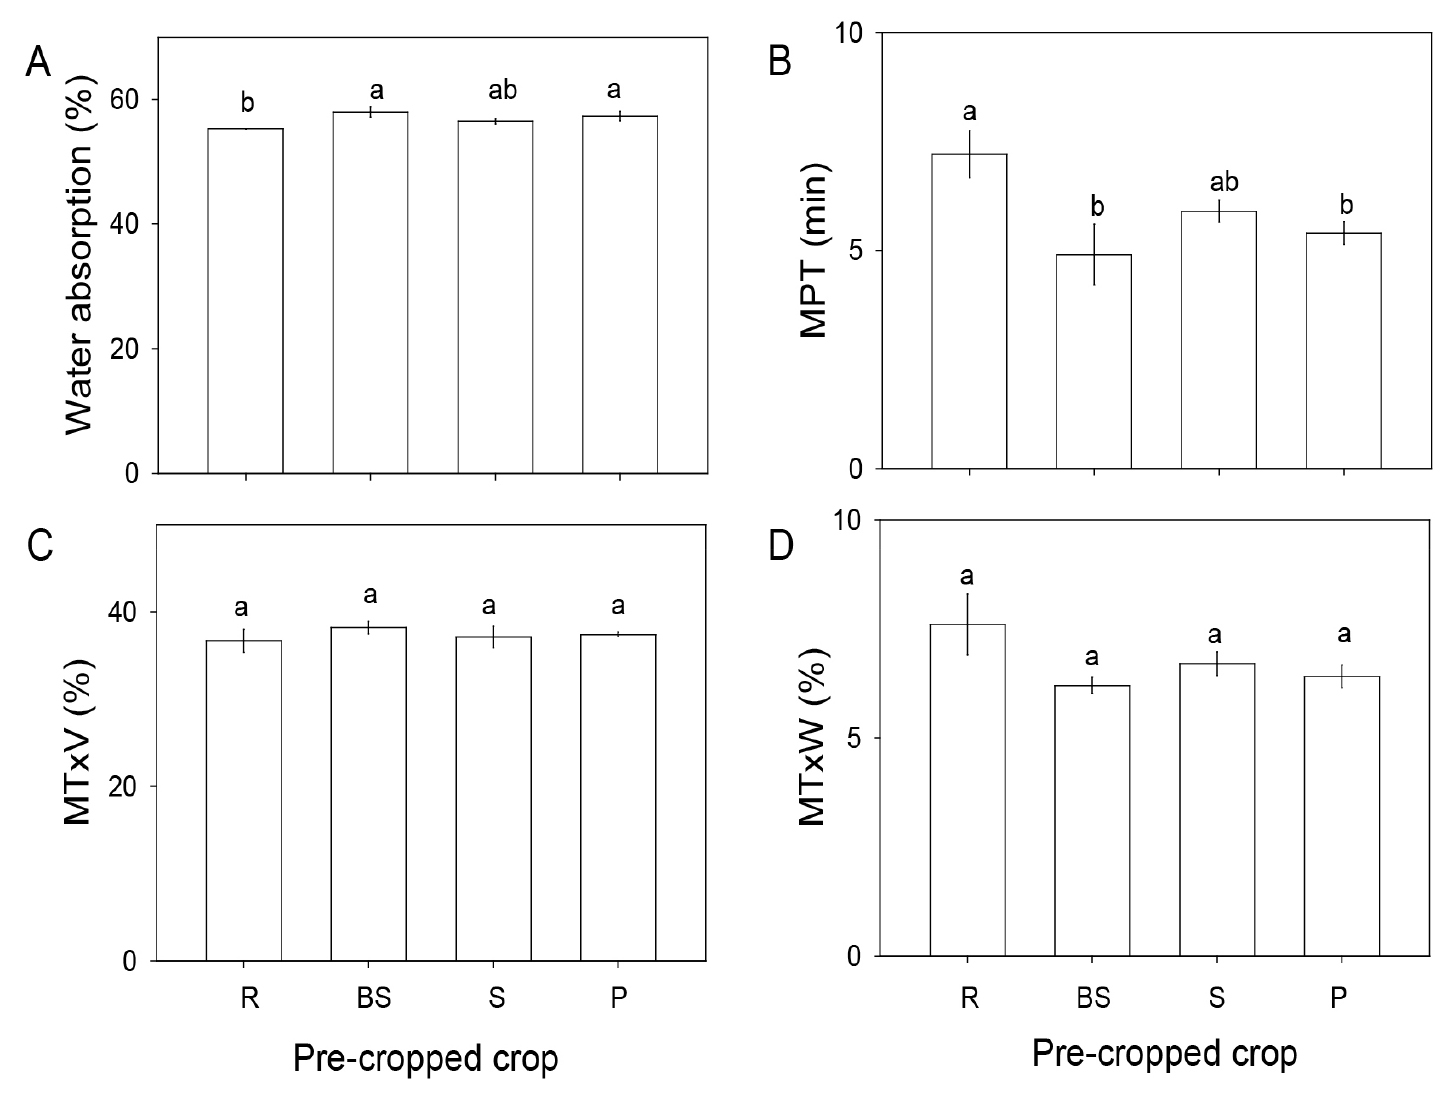
Fig. 3.
Mixograph parameters of wheat flour from paddy fields pre-cropped with rice or rice-alternative crops. Values are expressed as means ± standard error of four replicates. Different letters within each column indicate significant differences among treatments by Duncan’s multiple test (p < 0.05). Mixograph parameters include WA (water absorption), MPT (midline peak time), MTxV (midline curve height at 8 min), and MTxW (midline curve width at 8 min). R, rice; BS, black soybean; S, sesame, P, perilla.
Implications of double cropping systems
Double cropping systems maximize crop production in limited cultivation areas (Oh et al., 2022). The rice - wheat cropping system faces sustainability issues, such as depletion of soil fertility, declining groundwater levels, and environmental degradation. Therefore, rotation cropping systems with low water-demand crops, such as legumes and oilseed crops instead of rice, need to be explored for sustainable agriculture. Additionally, it is necessary to understand how rice and alternative crops as pre-crops affect the flour quality of subsequent wheat in paddy fields. Protein content of wheat flour increased by 23.3% after cropping with black soybean and 18.0% after perilla, which is relatively high compared to wheat flour produced after rice cropping. Micro-nutrients such as Zn and Cu were generally higher in wheat flour harvested from fields pre-cropped with rice alternative crops. Based on these results, pre-cropping with rice alternative crops (black soybean, sesame, and perilla) in crop rotation under paddy fields is expected to have a significantly positive impact on wheat flour quality, although it may result in slightly darker bakery products. Future research should establish systems to produce the highest-quality wheat and apply it in the baking process.
