

Introduction
Materials and Methods
Study site
Data Collection
Methods of Data Analysis
Econometric analysis
Results and Discussions
Production variables
Efficiency variables
Econometric results
Parameter estimates of the SPF model
The variability of output due to technical efficiency differentials
Stochastic production function
Sources of technical efficiency variation
Scores and distribution of technical efficiency
Conclusions and Policy Recommendations
Introduction
Rwanda is a small country, land-locked, located central eastern part of Africa with economy depending mainly on agriculture, services and manufacturing industry contributing respectively 27%, 46% and 19% to gross domestic product (National Institute of Statistics of Rwanda, 2020). Historically, agriculture remained the backbone of Rwandan economy in terms of job provision, food supply, export earnings and poverty reduction in smallholder farmers’ families. The main crops cultivated in Rwanda as well as in Nyamasheke district are rice with productivity of 3,521 kg/ha, vegetables 7,891 kg/ha, banana 5,403 kg/ha, fruits 4,399 kg/ha, sweet potatoes 4,091 kg/ha, cassava 3,599 kg/ha. The food insecurity is estimated at 20.60% in the district (National Institute of Statistics of Rwanda, 2018). Since the introduction of rice in Rwanda by Taiwan and South Korean missionaries during 1960s, with the prioritization of rice farming in 2002 basing on its production potential and increased consumer demand across the country (Ministry of Agriculture and Animal Resources, 2013), much effort have been made to increase quantity and quality of rice produced. The expansion of land under rice farming and extension services led farmers to play a big role in achieving production oriented targets set in national rice development strategy 2011-2018 (Tuyishime et al., 2020).
Despite the increase in production, the produced quantity failed to keep pace with rapid growing consumption in the country mainly in urban areas (Ghins and Pauw, 2018). From 2010 to 2020, the area under rice cultivation increased from 6,487 ha to 15,077 ha while the productivity decreased from 5.18 tons/ha to 3.99 tons/ha (National institute of statistics of Rwanda, 2020). The average annual demand for rice in Rwanda is estimated at 145,000 tons while the domestic supply accounts only for 40%, creating a 60% deficit that is met through imports mainly from Tanzania and Pakistan. In 2020, Rwanda imported more than 120,270 tons of rice on which it spent over $61.50 million. In the previous year of 2019, $55.10 million had been spent on importing 112,290 tons of rice (Ministry of trade and industry, 2021).
Inspired from the gap between supply and demand of rice in Rwanda, the present study is intended to identify different factors contributing to rice production, determinants of technical efficiency in rice production to see what really limit rice production to achieve the needed level to satisfy national demand. Also, it suggests how agricultural policy can be improved basing on the research findings to help small-scale farmers increase production to cope with the increasing demand in rice, hence the reduction of the high dependence on rice importation. In addition, this research will serve as the basis of other researches in agriculture especially in Nyamasheke district where no many researches have been conducted in this field.
Materials and Methods
Study site
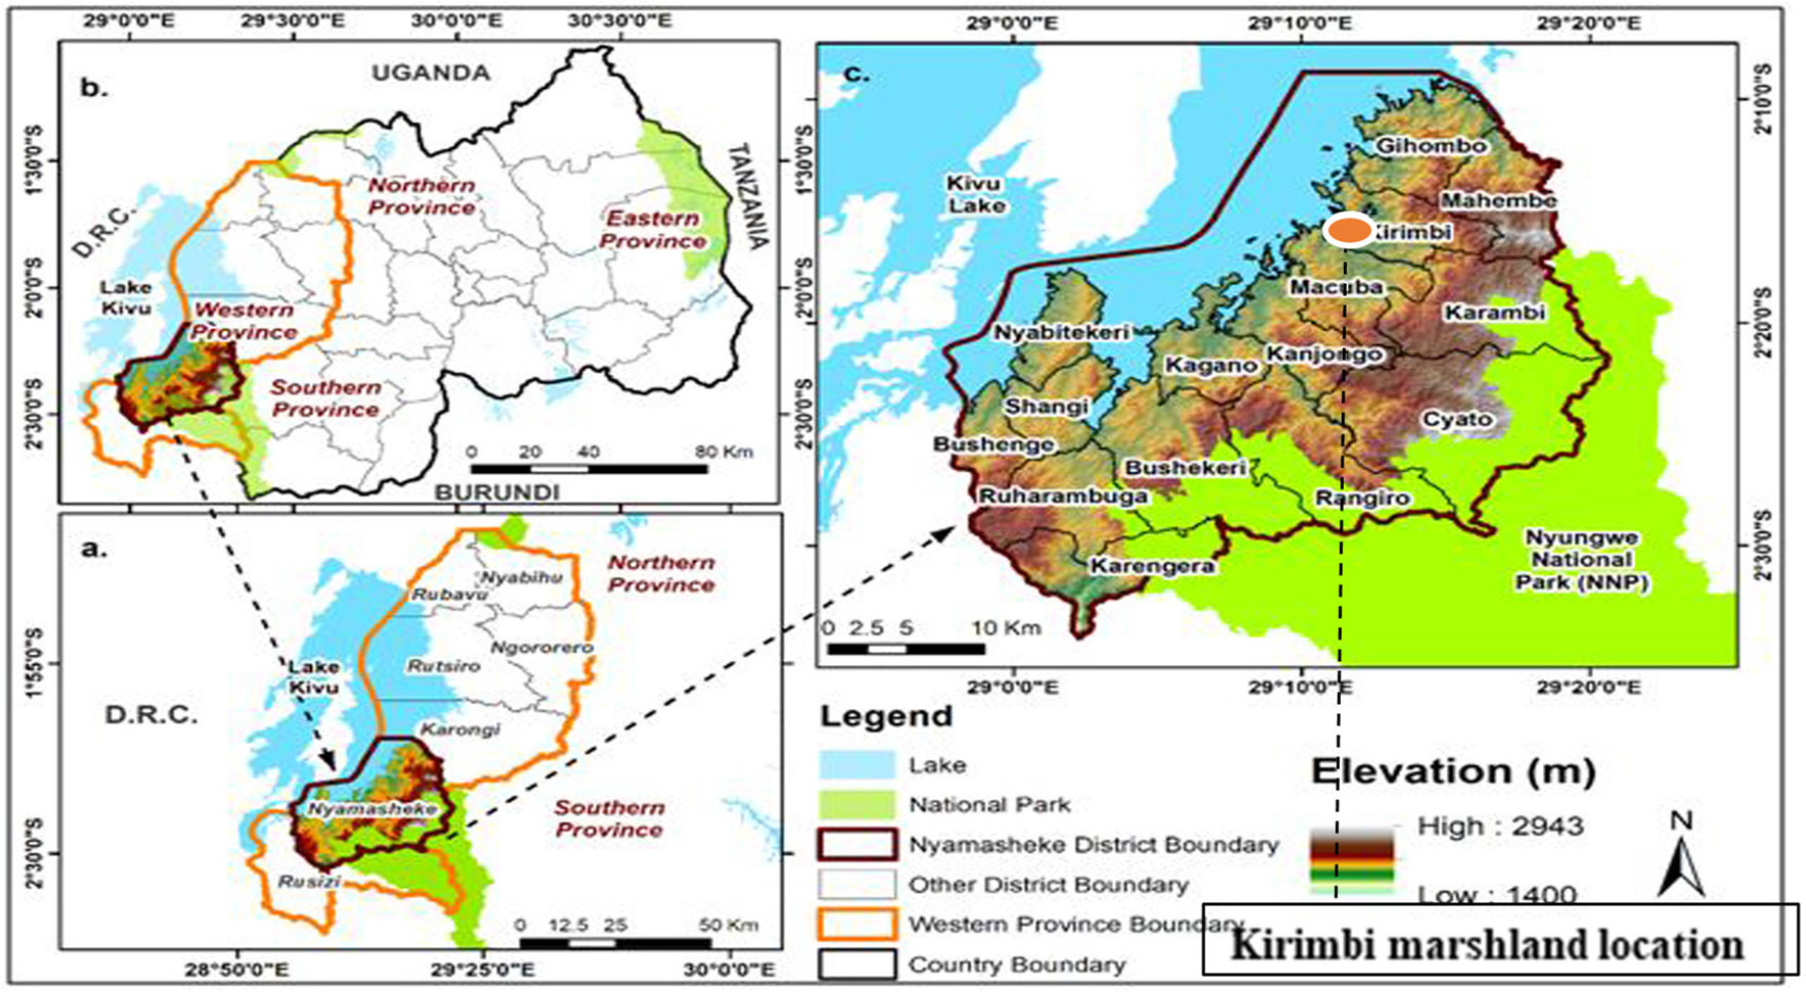
Nyamasheke district is a rural district in Rwanda’s Western province, one of seven districts that border the Democratic Republic of Congo in the west. It covers 1,174 km2, with Nyungwe national park covering 225.85 km2 and lake Kivu covering 346.53 km2. The population is estimated to be around 383,138, with a physical population density of 325/ km2. With altitudes ranging from 1,463 m to 2,500 m above mean sea level and temperatures ranging from 19°C to 23°C, the district’s mean annual rainfall ranges from 1,415 mm to 1,848 mm (Ministry of Agriculture and Animal Resources, 2013).
In the district rice is cultivated on the area of 308 ha dispatched in 6 different small marshlands, namely: Mugonero 30 ha, Kibati 22 ha, Kirimbi 127 ha, Kamiranzovu 80 ha, Nyagahembe 25 ha and small part of Cyunyu marshland of 24 ha. Those marshlands are operated by 3,671 rice farmers (male: 1,884, female: 1,787) grouped into 8 cooperatives namely: Abishyizehamwe, AIC Kibati, Duhuzimbaraga, Dufatanye, Urumuri, Copabunya, Cotubu and Ibangaryisuka. The present study will be conducted in Kirimbi rice marshland of 127ha, operated by 1,837 farmers (male: 900, female: 937) and the Fig. 1 shows its geographical location..
Data Collection
Among 1,837 rice farm households working in Kirimbi wetlands under the Duhuzimbaraga cooperative, the random sampling method was used to select 120 heads of rice farm households. Both primary and secondary source of data was used to come up with the complete data set for the study, detailing information on households’ demographic characteristics, farm characteristics, input utilization and output produced. Using the designed questionnaire, data on the quantity of paddy rice produced, the area under rice cultivation, household members able to work, the use of organic fertilizer, money used in rice farming, use of certified seeds, doing irrigation and use of pesticides have been collected to be used in estimating stochastic production function. Data on years of education, experience in rice farming, number of extensionist visits, main crop produced and the sex of household head will be used to estimate the technical efficiency function. The secondary data used in this study was sourced from different studies conducted and documents at various administrative levels of the country, government agency in charge of statistics and Duhuzimbaraga cooperative administration operating in Nyamasheke district.
Methods of Data Analysis
Both descriptive and Econometric analysis have been used to make a summary, analyze the information on farmers’ input, output levels and socio-economic characteristics used in the frontier production and efficiency model.
Econometric analysis
For the ith rice farmer, the stochastic production model in general production function is:
where is the ith farmer’s scalar output, Xij the vector of the ith farmer’s actual input variables, β, the vector of production coefficients to be estimated and , the composed error term () with , the random variability in production that the farmer has no control over and , the difference between maximum potential production with technological inefficiency and the stochastic frontier which is given by f(Xij, β) + and takes only positive values. The stochastic frontier production function was estimated using a Cobb-Douglas production functional type of specification, according to Meeusen and van den Broeck (1977) and Aigner et al. (1977).
To estimate the technical in/efficiency level in rice production of smallholder rice farmers in Nyamasheke district, the Cobb-Douglas functional model was specified as follows:
where is the harvested paddy rice in tones and represent farm size in hectares, number of kg of seeds sown, number of household members able to work, money used in rice farming, dummy variable of the use of organic fertilizer in rice farming, dummy variable on proper irrigation practice, dummy variable of pesticides use respectively. βo is the amount of rice produced by one hectare of land in its natural state (the intercept), and βj is a vector of parameters to be estimated. is a symmetric error term that accounts for deviations from the frontier caused by factors beyond the farmer’s control (such as weather variation, measurement error, and other statistical noise) and , is a one sided error term accounting for the deviation because of inefficiency effects. are normal random variables with zero means and variances that are distributed independently and identically. i.e. and are non-negative / one sided random variable () as efficiency component that measures the deviation from the maximum potential output attributable to technical inefficiencies in rice production, which is represented and given by the stochastic frontier output, f(Xij, β) + .
Results and Discussions
Production variables
This section presents in the Table 1 below, the summary of statistics for the production variables that were used for analysis in the stochastic production frontier (SPF) model, both independent and dependent.
Table 1.
Production variables
The production of farmers varies between 0.20 tons and 2.95 tons with average of 0.94 tons which justify the small ability of farmers to produce cause of their smallholding characteristics justified by the fact that average land holding of the farmers sampled in the study area is almost 0.17 ha with standard error of 0.09. The minimum and maximum size of land holding was 0.05 ha and 0.54 ha, respectively. All of the farmers sampled own small plots of land under rice farming. According to Oikeh et al. (2018), the average amount of seeds to be used per 1ha given different germination rates varies between 50 kg to 100 kg and many farmers believe that the production is positively related to the amount of seeds sown. The study result shows that the sampled rice farmers on averagely used seed at a rate of 63.67 kg/ha with a minimum of 37.04 kg and maximum of 133.33 kg/ha. The total number of people and their composition within households determine the availability of labor force required in farm production; however, this study only considered household members who worked on the farm. Meaning children and regular students have not been considered in the survey. The average household size was 3.54, with a minimum of 1 and a maximum of 5 members per household. According the smallholding characteristics of the farmers in the region, the average of 3.54 household members able to work is enough to provide labor to rice farms they own. The study revealed that most of farmers neither use organic fertilizers and pesticides properly, nor practice proper irrigation.
Efficiency variables
In this part, the variables used in efficiency model will be presented in the Table 2 below and discussed.
Table 2.
Efficiency variables
The experience in rice farming can be a favoring factor to farmers to be more efficient. In the study conducted, the mean experience in rice farming have been estimated to be 8.59 years of experience with minimum of 1 year and maximum of 17 years of experience in rice farming. The average year of schooling for household heads in the study area was found to be 6.43 years, with a minimum of 2 and a maximum of 12 years of schooling, showing the low involvement of more educated people in farming activities in the district. The study also revealed that the extensionist visits per season varies between 3 and 38 visits with an average of 16.49 visit times per season showing that even if the extension agents are there they need to increase their visits to farmers as it is very important to advise them long their production way.
The study results show that 73.30% of farmers use certified seeds which is good but there is a need to achieve 100.00% and 70.83% of farmers consider rice as their main crop. This can have the important effect on the time the farmers can allocate to rice farming because if it is considered as the main crop in terms of income they can allocate much time but if not it can be taken as of low importance. The factor of being a beneficiary of at least one agricultural non-governmental organization (NGO) has been analyzed and the study shows that only 36.70% of farmers are beneficiaries of at least one agricultural NGO which is not a good situation basing on the importance of Non-governmental organization to farmers.
Econometric results
Before proceeding to the econometric analysis, two tests for multicollinearity have been performed especially using variance inflation factor VIF and contingency coefficient value. According to Gujarati (2006), a VIF value greater than 10 and a contingency coefficient value greater than 0.75 were typically regarded as indicators of severe multicollinearity. The contingency coefficient values for all variables have been found to be less than 0.75 except the seeds sown with area (0.87) and money used in farming with area (0.79) which caused the doubt for multicollinearity. To make sure if there is multicollinearity or not among Area, Seeds sown and money used variables, we calculated the variance inflation factor of those variables and it has been found ranging between 5.65 and 2.73 which are less than 10, as shown in the Table 3 below. From the test, we confirmed that there is no multicollinearity in variables.
Table 3.
Variance inflation factor of inputs
| Variables | VIF | 1/VIF |
| Area in hectares | 5.65 | 0.18 |
| Seeds in kg | 4.13 | 0.24 |
| Money used | 2.74 | 0.36 |
| Mean VIF | 4.17 | . |
Table 4.
Maximum likelihood estimates of the Cobb-Douglas SPF using the inefficiency model
| Stochastic Production Function | Coefficient. | Std. Err. | Z |
| LnFarm size | 0.395*** | 0.072 | 5.500 |
| LnSeeds | 0.594*** | 0.063 | 9.360 |
| LnHousehold member | -0.055** | 0.026 | -2.110 |
| LnOrganic fertilizer | -0.002 | 0.002 | -1.220 |
| LnMoney used | 0.010 | 0.036 | 0.280 |
| LnIrrigation | 0.007** | 0.003 | 2.360 |
| LnPesticides | 0.007*** | 0.003 | 2.670 |
| Constant | -0.564 | 0.550 | -1.030 |
| Technical Inefficiency effect function | |||
| Experience in years | -0.003 | 0.008 | -0.360 |
| Years of schooling | -0.008 | 0.014 | -0.620 |
| Extensionist visits | -0.002 | 0.004 | -0.560 |
| Rice being main crop | -0.259*** | 0.074 | -3.490 |
| Being beneficiary of Ag. NGO | -0.194*** | 0.056 | -3.490 |
| Using certified seeds | -0.116** | 0.052 | -2.210 |
| Constant | 0.582 | 0.111 | 5.240 |
| Usigma | |||
| Constant | -3.620 | 0.298 | -12.130 |
| Vsigma | |||
| Constant | -5.646 | 0.463 | -12.190 |
| sigma_u | 0.164*** | 0.024 | 6.700 |
| sigma_v | 0.059*** | 0.014 | 4.320 |
| lambda | 2.753 | 0.031 | 88.370 |
Parameter estimates of the SPF model
The parameters of both stochastic frontier production function and efficiency effect model were estimated simultaneously using a single stage maximum likelihood estimation procedure, as shown in the Table 4 below.
The variability of output due to technical efficiency differentials
The frontier model’s MLE provided a value for parameter γ, which is the ratio of inefficiency component variance to error term. where . The discrepancy ratio γ in our case measures the relative variability of inefficiency component of error term to the overall error term. The value of 𝛾 of rice output have been found to be 0.88 meaning that 88.35% of rice output variability is attributed to the technical inefficiency between sample farmers while the 11.65% remaining is for the disturbance term. The above information predicts the fact that there is an opportunity way to increase farmers’ productivity by identification of the source of the identified technical inefficiency and provision of associated recommendations.
Stochastic production function
All variables considered in the production function are inelastic, meaning that one percent increase in each variable in the production model will lead to a less than one percent increase in rice output. Among all seven variables included in production model, the quantity of seeds sown have been found to be the most important production factor with the highest effect on rice output with the elasticity of 0.59. This means that a 1 percent increase in the quantity of seeds sown will increase rice output by 0.59 exponentially. The following highest elasticity is for land size used to grow rice which have been found to be 0.39. Implying that the increase in land size by one percent would increases rice output by 0.39 exponentially. In addition, the proper irrigation practice and use of pesticides have small but significant effect on the rice output equal to 0.007, implying that ceteris paribus, farmers who practice proper irrigation increase rice output by 0.007 exponentially more than those who do not . The same interpretation is applied to farmers who use pesticides. However, the money used in production was found to be positive but insignificant, implying that the amount of money used in rice production does not affect statistically the production of rice in Nyamasheke district.
The coefficients for number of household members, statistically significant at 5%, and the use of organic fertilizers, statistically insignificant at 5%, were found to be negative, which is different from the priori expectation but in line with the findings of Wai and Hong (2021) when studying how much rice farmers to produce in Ayeyarwaddy region of Myanmar. Implying that the increase in household members is affecting production negatively caused by the fact that the head of household is the only one family member considered during the extension services provision by non-governmental organization and local government agents. This means that the rest of the household members are considered as unskilled labor, however, they are employed in rice farming. So the increase of unskilled labor in rice farming will not significantly affect increase of rice output. The use of organic fertilizer was insignificant. This implies that its use does not change significantly the production.
Sources of technical efficiency variation
With information on the existence of technical efficiency variation and its magnitude, the next important step is to examine major factors that can be the source of technical efficiency variation.
Six variables including socio-economic and others where hypothesized in the previous section to affect the level of technical efficiency of farmers growing rice in Kirimbi marshland/Nyamasheke district. The maximum likelihood estimation procedure was used to estimate the coefficients of the variables included in the model, with the estimated level of technical efficiency used as the dependent variable. One important point to remember in our interpretation is that the dependent variable is the inefficiency component of the total error term estimated in combination with the production frontier. As a result, instead of efficiency, the coefficients should be interpreted as the effect of each variable on the level of inefficiency. By taking the opposite sign of the respective coefficients, however, the estimated coefficient can be interpreted as the effect of the variable on technical efficiency. The results showed that the use of certified seeds, being beneficiary of a non-governmental organization and the fact of considering rice as the main crop by the farmer improves technical efficiency. The finding is in line with the results found by Asante (2014) when conducting a study on NERICA (New Rice for Africa) adoption its effect on technical efficiency among Ghana’s rice farmers’ households in 2014.
Scores and distribution of technical efficiency
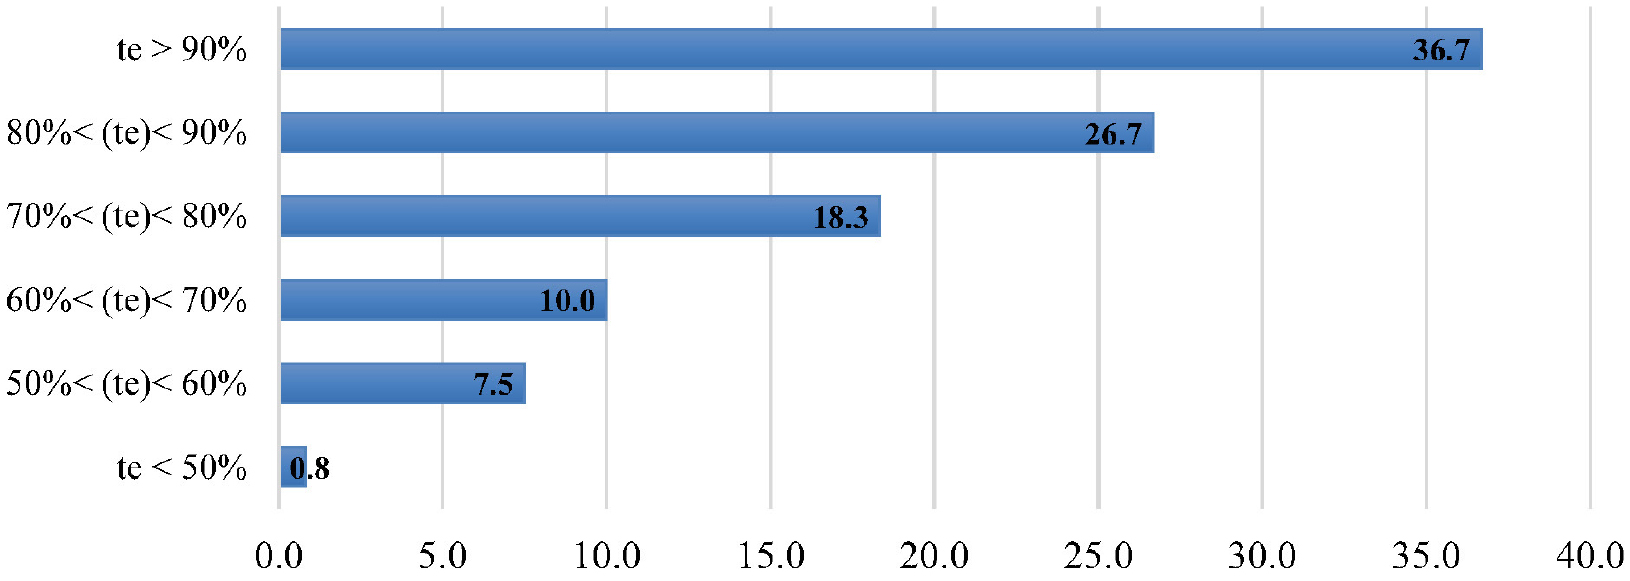
The average farmer’s level of technical efficiency in the study area is 81.32%. This means that rice farmers are not yet efficient in producing rice and rice yield can be increased on average up to 18.68% without affecting the level of current inputs by taking examples of more efficient farmers without disseminating any new technologies. Additionally, there is remarkable variability in technical efficiency among farmers ranging from 47.44 to a maximum of 97.67. About 38.33% of rice growing farmers were producing rice yield below the overall mean technical efficiency level of the farmers, whilst almost 61.67% of rice growing farmers were able to produce rice yield above the mean efficiency.
Fig. 2 shows the distribution of the technical efficiency (TE) score among different sampled farmers. 36.7% of the sample (44 farmers) scored the technical efficiency greater than 90%, followed by its 26.7% (32 farmers) with 80% TE-90% TE, 18.3% (22 farmers) with 70% TE-80% TE, 10.0% (12 farmers) with 60% TE-70% TE, 7.5% (9 farmers) with 50% TE-60% TE, and 8% (1 famer) less than 50% TE, in turn.
Conclusions and Policy Recommendations
The results of the econometric models confirm the existence of technical inefficiency among farmers given the specification of the Cobb Douglas stochastic frontier production function, meaning that all farmers are not fully technically efficient. The variables considered in the production function are inelastic, meaning that one percent increase in each variable in the production model will lead to a less than one percent increase in rice output. The study also suggest that the technical efficiency of farmers can be increased by 18.68% by the efficient use of available resources. Recommended are the emphasis on the enhancement of production efficiency, valorization of unused marshland, training of all household members in addition to the head of household working in rice farming especially on the optimization use of seeds, availing irrigation infrastructures in rice farms, and mobilization of farmers on the proper use of pesticides. Also, recommended are helping them to get access to financial institutions, maximum use of certified seeds and establishment of their subsidized scheme. Mobilization of farmers to grow rice as business oriented activity can be one of many ways to help Nyamasheke district rice farmers to be more efficient in rice production.
