


Introduction
Data and Methods
Data Analysis
Data Validity
Results and Discussion
Text Mining and Network Analysis Results
Data Validation
South Korea Case Study
Synthesis of Analysis Results
Practical Implications, Limitations, and Future Research Directions
Conclusion
Introduction
Landslides, defined as downslope movements of soil, rock, or debris triggered by intense rainfall, seismic shaking, volcanic activity, or anthropogenic disturbance, are among the most destructive natural hazards globally. Their impacts include loss of life, damage to civil infrastructure, and prolonged disruption of transportation and utility networks, resulting in considerable social and economic burdens on affected communities (Behera and Sahoo, 2023; Puissant et al., 2014; Smarsly et al., 2014; Spegel and Ek, 2022). These impacts are intensifying under global trends of rapid urbanization, population growth and climate induced increases in extreme precipitation, which are driving settlement expansion into mountainous terrain in countries such as South Korea, Taiwan (Chen et al., 2019), the Philippines (Pramono et al., 2020), and Nepal (Sharma et al., 2020).
In this study, steep slopes are defined as terrain with gradients greater than or equal to 30 degrees, consistent with the guidelines of South Korea’s Ministry of the Interior and Safety (MOIS) and supported by international findings that landslide probability increases sharply beyond 35 to 50 degrees (Gbadebo et al., 2018; Tsou et al., 2018). Slope angles of this magnitude amplify gravitational driving forces nonlinearly, rendering failures on steep slopes particularly sudden and destructive (Hungr et al., 2014; Yuvaraj and Dolui, 2023).
Numerous methodologies have been proposed for landslide risk assessment, including artificial neural networks (ANNs) for susceptibility analysis (Nanehkaran et al., 2023), statistical and heuristic integration for risk analysis (Ngadisih et al., 2014), and analytic hierarchy process (AHP) techniques for landslide susceptibility mapping (Al-Sababhah, 2022). While these methods are computationally advanced, they largely depend on static inputs, such as historical inventories and predefined covariate sets, which limit their capacity to detect emerging risk drivers. Effective landslide risk governance requires flexible and timely identification of dynamic parameters such as slope angle, rainfall intensity, land-use changes, forest fires, and snow accumulation, which evolve under changing environmental and anthropogenic pressures (Rasshyvalov and Rushkovskyi, 2022).
A review of recent literature illustrates the methodological progression in landslide susceptibility and hazard assessment. Corominas et al. (2013) proposed a quantitative risk framework integrating hazard, exposure, and vulnerability. Van Westen et al. (2008) emphasized the use of GIS, digital elevation models, and historical inventory data. Guzzetti et al. (2006) applied multitemporal aerial photo analysis, Poisson modeling, and ensemble validation techniques to improve prediction accuracy. Shano et al. (2020) compared qualitative and quantitative zonation strategies, while Zou and Zheng (2022) used scient metric analysis to identify real-time integration gaps. Innovations such as the fusion of GIS with text mining (Cignetti et al., 2024) and remote sensing-based inventories (Golovko et al., 2017) have extended these capabilities. However, most frameworks remain reliant on static, expert-defined variables and lack mechanisms for incorporating emerging factors.
South Korea presents a timely and relevant case study. From 2002 to 2011, steep slope failures accounted for 34% of all natural hazard deaths, and between 2012 and 2018, they caused direct economic losses of 376.8 billion won (Kim et al., 2013; Lee et al., 2021). The MOIS now lists 20,128 registered hazardous slopes and flags a further 177,308 potential sites identified from engineering blueprints (Table 1). In July 2023 alone, over 190 landslides occurred in Gyeongbuk Province following intense rainfall destruction (Juang et al., 2019), highlighting the urgency of improving predictive models. Despite periodic updates to its assessment manual, South Korea's national framework remains largely static, omitting several internationally recognized predictors and continuing to rely on fixed checklists (Fig. 1, Table 2). Once a high-risk slope is reinforced it is typically reclassified “low risk” without verifying latent instability, illustrating the shortcomings of a static checklist (Suk et al., 2019).
Table 1.
Registered steep slopes in South Korea

Table 2.
Number of factors utilized for steep slope risk assessment from 2009 to 2023
This study aims to improve slope failure likelihood estimation by integrating large-scale text mining with expert consensus methods. The framework combines natural language processing to extract candidate predictors from the literature with Delphi analysis to assess their relevance. The Delphi technique is a structured, iterative process designed to build expert consensus through anonymity and controlled feedback across multiple rounds (Greatorex, 2000; Rahmani et al., 2020; Schmalz et al., 2021). Unlike quantitative meta-analyses, this approach does not extract or aggregate effect sizes; instead, it applies natural language processing to identify candidate predictors from the global literature and then assesses their relevance through expert consultation. Although both methods have been applied independently in other domains, their combined use in landslide risk assessment remains relatively uncommon. This integration offers a structured and transferable approach for updating risk factors in models that currently rely heavily on static, expert-defined inputs.
While both likelihood and consequence components were incorporated into the Delphi evaluation and the 200-site field scoring process to generate a complete risk classification, the study’s primary contribution lies in improving the likelihood assessment. Consequence metrics—population density, traffic volume, and proximity to essential infrastructure—were adopted directly from the existing MOIS framework and retained without modification. By focusing on the probability component of the risk equation, the study aims to increase the sensitivity and reliability of slope classification outcomes, thereby supporting more effective management of steep-slope hazards.
To achieve this, the study aligns computationally extracted literature evidence with structured expert consensus, producing an updated and policy-relevant set of likelihood predictors. Although piloted in South Korea, the proposed framework is modular and adaptable. Regional text corpora can be developed, and new Delphi panels convened to calibrate the tool for use in other environmental and linguistic contexts. This flexible workflow offers a practical means of bridging the gap between evolving scientific knowledge and operational decision-making in landslide risk assessment.
In summary, this study contributes a replicable approach to refining landslide risk classification by improving the identification of likelihood factors through a hybrid method that is both data-informed and expert-guided. While further testing in diverse regional contexts is recommended, the framework provides a structured basis for updating hazard models in settings where conditions change rapidly and empirical data may be limited.
Data and Methods
The methodology of the study, illustrated in Fig. 2, involves systematic data collection, text analysis, and field validation. Data were initially collected and analyzed using Gephi (V.0.10.1) (Bastian et al., 2009) and KH Coder (V.3) (Higuchi, 2017) to extract key factors. The text analysis employed modularity analysis, Multi-Dimensional Scaling (MDS), and betweenness centrality to identify community structures, spatial relationships, and influential nodes within the dataset. Following this, a Delphi analysis involving 20 experts was conducted to validate the identified factors. The validated results were then compared with existing South Korean guidelines to determine areas of alignment and divergence. Finally, the factors were field-tested across 200 steep slope locations to assess their practical applicability.
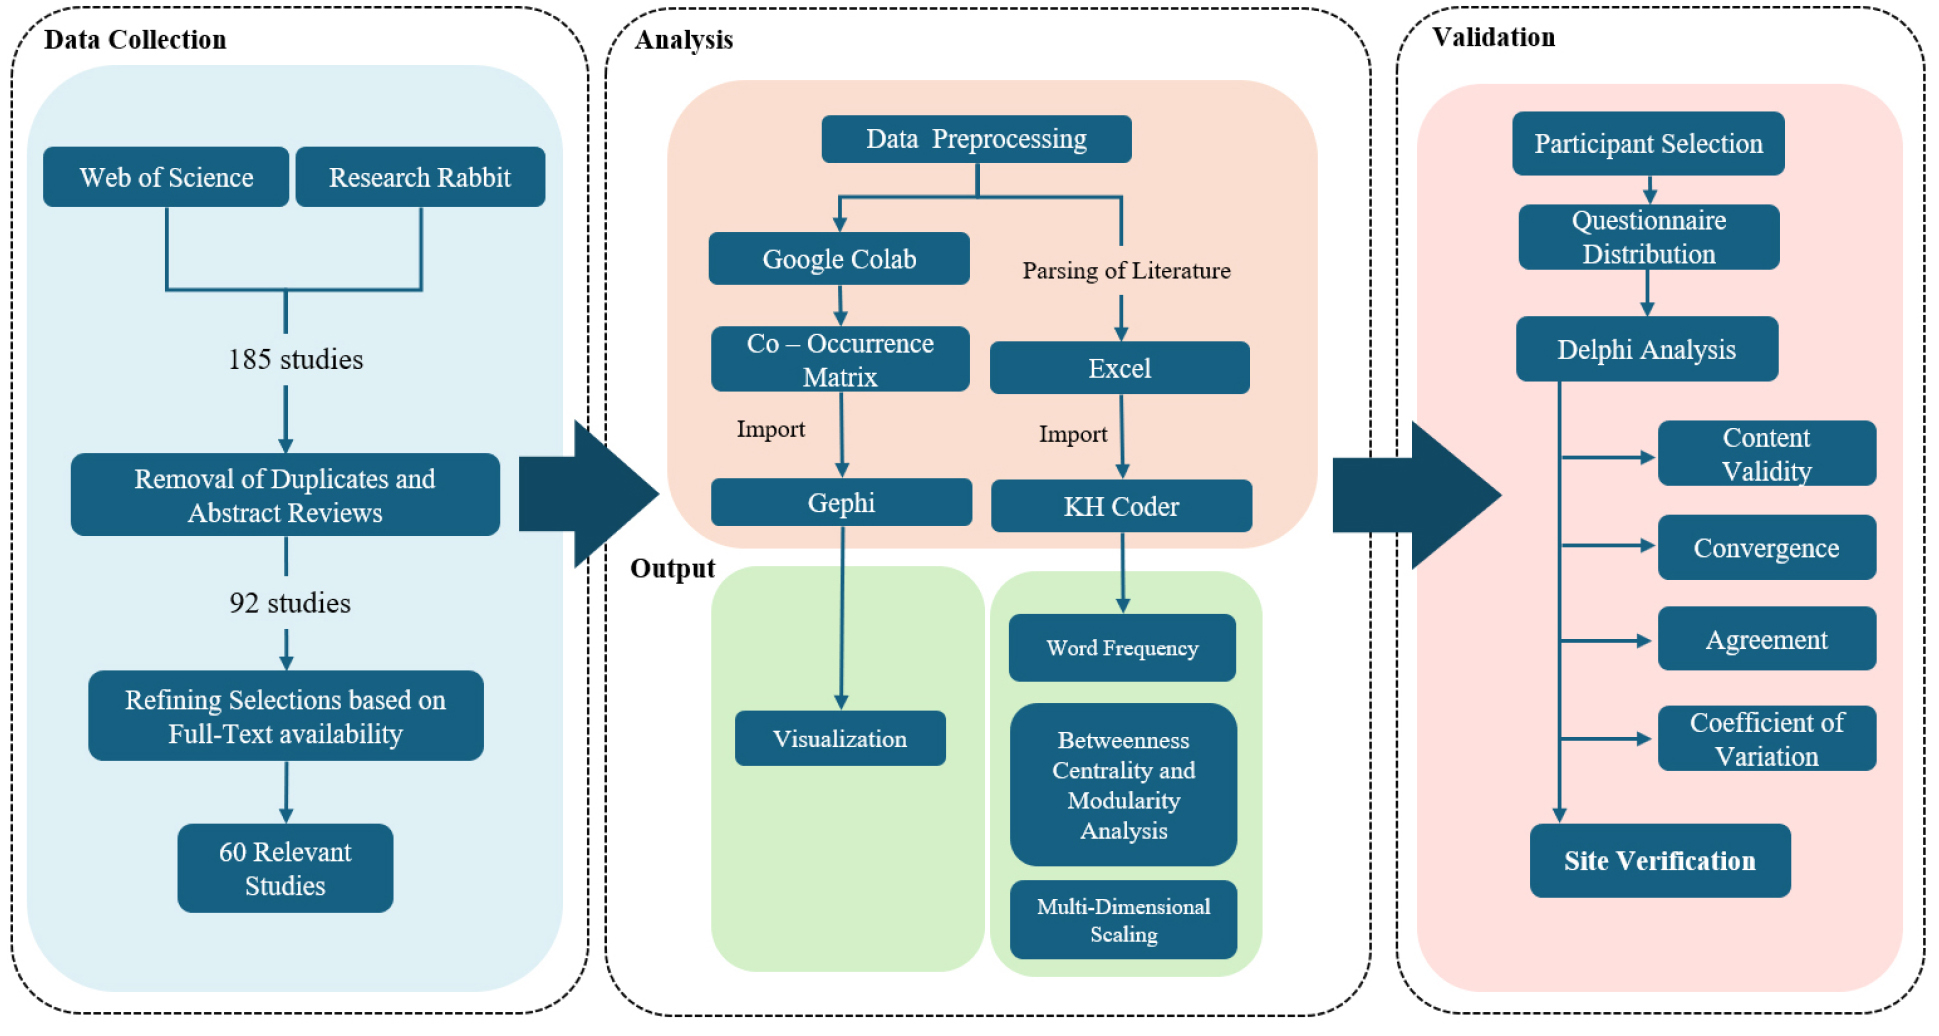
The data extraction phase implemented a systematic methodology to select relevant literature. The initial search was conducted using the Web of Science (WoS) and Research Rabbit databases, selected for their extensive coverage (Pranckutė, 2021; Sharma et al., 2022). Keywords included “steep slope,” “risk assessment,” “slope failure,” “landslide,” and “South Korea.” Boolean operators (AND/OR) were used to refine the search, focusing on topics such as landslide susceptibility mapping, steep slope failure factors, and landslide hazards. The retrieved literatures were then filtered based on the following criteria: (1) journal articles, (2) published between 2002 and 2023, (3) written in English, and (4) full-text availability.
The initial search and selection process yielded 185 studies, which were reduced to 60 after eliminating duplicate entries and applying the predefined inclusion criteria. These studies were then further screened for relevance to steep slope risk and landslide factors through a tiered evaluation process: title review, abstract screening, and full-text analysis. The final 60 studies were obtained as the selected literature dataset for text-based analysis after applying the search, screening, and inclusion criteria. The purpose of this corpus was not to provide an exhaustive bibliometric review, but to identify recurring candidate risk factors for steep slope collapse through text-based analysis. Because the candidate factors were identified through text mining, factors reported in overseas studies were not manually excluded at the extraction stage. This was intended to reduce author-driven selection bias and allow recurring risk factors in the broader selected literature dataset to emerge from the analysis.
Data Analysis
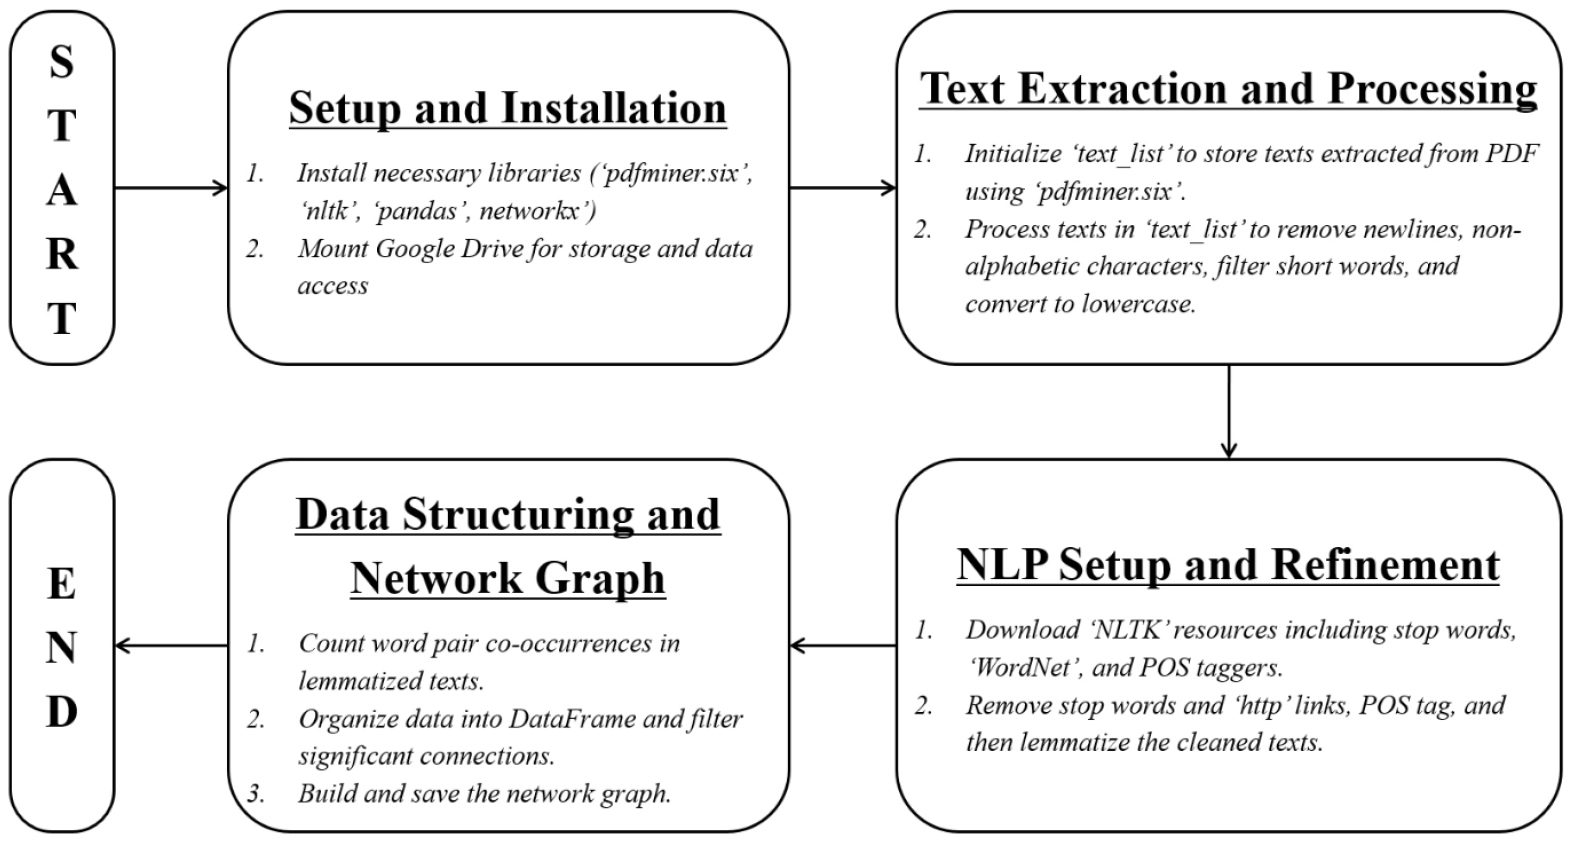
The data analysis performed in this study involved Information Extraction (IE), Retrieval (IR), Categorization, Clustering, Summarization, and Visualization (Gorvankolla and Rekha, 2017) to derive data from the unstructured textual data. Applications such as Google Colab (Google, 2023), Gephi, and KH Coder were utilized for pre-processing, visualization, and data analysis, respectively. Following the collection of literature, the collected full-text documents underwent preprocessing for text analyses. This procedure was done in Google Colab using a custom code, as illustrated in Fig. 3 The steps involved were as follows:
1. Extract the texts from the PDF files.
2. Clean the data by removing symbols and special characters.
3. Tokenization to segment text into ‘tokens,’ refined by removing stop words (‘the,’ ‘is,’ ‘by,’ ‘or,’ ‘was,’ ‘as,’ ‘in,’ and ‘with’), stemming, and lemmatization to simplify analysis.
4. Analyze data for the co-occurrence and create a dictionary to store element frequency. Then converted into a Pandas DataFrame to filter out pairs with low occurrence counts and construct a graph using NetworkX.
Gephi: Word Co-Occurrence Visualization
Following the preprocessing, the word co-occurrence matrix was generated using Google Colab. The process began with extracting textual data and constructing the matrix, which captures the frequency with which pairs of words appear together within a specified context window. This matrix, in GEXF file format, was then imported into Gephi to input word matrices and generate semantic network diagrams.
In Gephi, the co-occurrence matrix is visualized as a network graph, where nodes represent words and edges show the co-occurrence relationships between them. The Fruchterman-Reingold Layout, a force-directed algorithm, is used, with edge thickness indicating the frequency of co-occurrence—thicker edges mean more frequent connections (Xu et al., 2023). Node size was scaled by weighted degree to reflect each term’s prominence in the network (Lattimer et al., 2024; Nordahl et al., 2022). This visualization helps identify significant relationships, clusters, and hubs within the dataset.
To enhance visualization, the Force Atlas layout algorithm was applied, drawing nodes with stronger connections closer together to form distinct clusters. These clusters represent groups of frequently co-occurring words, highlighting thematic concentrations in the text. Modularity detection techniques were also used to define and separate these clusters, revealing underlying themes and trends. These methods create a detailed visual representation of word relationships, making it easier to identify the structure and key topics within the text data.
KH Coder: Text Analysis
To address Gephi's limitation in word quantification, KH Coder was used for a more detailed data analysis to complement Gephi’s co-occurrence visualization. KH Coder performs word frequency analysis, correspondence analysis, and multidimensional scaling, making it highly effective for precise word quantification (Okamura et al., 2021). KH Coder is particularly useful for handling qualitative data that requires detailed analysis (Brunner et al., 2019).
The first text analysis conducted was a word frequency analysis. As Brysbaert et al. (2018) noted, word frequency is a critical predictor of processing efficiency, with frequently occurring words being processed more efficiently. For word frequency analysis, KH Coder employs a straightforward counting algorithm to determine the frequency of each word. Despite the inclusion of stop words after extraction, manual segregation was necessary to ensure the accuracy and relevance of the dataset analysis.
Following word frequency, KH Coder was utilized to conduct a co-occurrence analysis, specifically modularity analysis and betweenness centrality analysis to reveal sub-graphs or communities, identify key nodes, and assess the flow of information within the network graph. The process started by tokenizing, tagging for parts of speech, and lemmatizing the text data to maintain consistency. Significant terms were selected based on frequency and part of speech, with common stop words excluded to prioritize keywords.
Once the data was prepared, statistical analyses were performed. Centrality measures such as degree, betweenness, and closeness centrality were calculated to identify the most important or influential words within the network. Modularity analysis, which measures the strength of division of a network into modules (subgraphs), uses a modularity score to indicate the network’s density and the interrelation of its substructures (Chen et al., 2018). Betweenness centrality analysis assesses a node’s influence on the flow of in-formation within a network as measured through a between-ness centrality score (Salavaty et al., 2020). This analysis aimed to identify key nodes or steep slope risk factors that play critical roles in the network, showing the influential factors within the study.
Clustering algorithms were applied to detect communities or groups of words that frequently co-occur together, indicating thematic clusters. Co-occurrence networks were plotted, with nodes representing words and edges representing their relationships. The Jaccard coefficient was employed to measure the degree of co-occurrence between words, while network density, defined as the ratio of the number of actual co-occurrences (edges) to the number of possible co-occurrences (edges) that could exist in a network, provided further insights into the network’s connectivity and structure (Higuchi, 2017).
For the MDS analysis, specific settings were selected to optimize the visualization of word relationships. The Kruskal method was chosen for non-metric MDS due to its ability to preserve the rank order of distances, making it suitable for capturing non-linear relationships between words (Suerdem, 2021). The Jaccard coefficient was also employed here as the distance measure, ideal for analyzing sparse data by emphasizing the co-occurrence of words (Higuchi, 2017).
The analysis was configured to produce a two-dimensional scatter plot for initial visualization, balancing complexity, and readability. This configuration ensured that the cluster analysis used the same distance matrix as the MDS, allowing for the possibility of non-adjacent words being grouped together. MDS translates the similarities and dissimilarities in data into a graph. This allows for a more intuitive visualization of patterns and clusters. This approach allows for a clearer understanding of the semantic relationships between words, highlighting how words are associated based on their co-occurrence in the dataset. Furthermore, MDS enhances the co-occurrence network and word frequency analyses by offering detailed insights into the relationships between the keywords. This approach provides a more in-depth understanding of the interconnectedness of factors that contribute to landslides.
Data Validity
In this study, the Delphi method was employed to assess the validity of risk factors identified through text mining. Building on its growing use in landslide and steep slope research, Delphi was selected specifically for its ability to validate qualitative and con-text-sensitive indicators that cannot be easily measured through traditional statistical models. This aligns with the study’s goal of synthesizing domain expert insights with text-mined data, which are often unstructured and interdisciplinary in nature.
The Delphi technique facilitates structured expert consensus through a process involving the collection of participants’ opinions via questionnaires and the provision of expert feedback (Hohmann et al., 2018). Its use of anonymous responses reduces social biases such as an-choring and authority effects, while feedback helps refine expert judgements and enhance consensus reliability. These features are particularly valuable when validating new or overlooked risk indicators drawn from narrative reports, as in this study. Statistical measures of agreement and expert feedback were used to analyze the convergence of opinions using Delphi—reinforcing the rigor of the validation process.
Twenty participants were asked to participate in the Delphi analysis due to their expertise in the field, including professionals from the MOIS responsible for risk assessments in steep slope management. The Delphi panel consisted of private-sector experts and local-government officials with professional experience in steep slope risk assessment and management. Their areas of expertise were directly related to steep slope evaluation, disaster-risk assessment, and field-level slope management. The participants represented different levels of professional experience, ranging from early-career personnel to senior experts with long-term experience in steep slope management. The 20-member panel was considered suitable for this study because the participants had direct professional relevance to steep slope risk assessment and management.
They completed a questionnaire that evaluated the impact of six indicators identified through text mining. Each indicator was rated on a 5-point Likert scale, from 1 (strongly disagree) to 5 (strongly agree), to indicate its influence on steep slope collapse. The responses were then analyzed for content validity, convergence, agreement, and coefficient of variation. The consequence component of risk, including criteria such as affected population, infrastructure significance, and proximity to critical facilities, followed the existing structure provided by the MOIS guidelines. Instead, the Delphi analysis aimed to strengthen the likelihood assessment by validating newly identified factors from text mining, which were then added to the existing framework to improve overall risk classification.
Content validity was assessed using Lawshe’s Content Validity Ratio (CVR), which is based on the number of panelists involved (Lawshe, 1975). The CVR provides a quantitative evaluation of content validity by calculating the proportion of experts who deem each indicator necessary (Gilbert and Prion, 2016). The formula for calculating the CVR is as follows Eq. (1):
where ne is the number of respondents rating the item as “essential” (4 or higher), and N is the total number of respondents. According to Lawshe (1975) when the panel size is 20, the minimum value of CVR is 0.42. If an indicator’s CVR exceeds this minimum value, it is considered valid.
In this study, convergence assesses the extent to which expert opinions differ (Du et al., 2021) and serves as an indicator of consensus within the expert panel. It is calculated using the Interquartile Range (IQR), which captures the spread of the middle 50% of the data points. Convergence is characterized by the following formula Eq. (2):
where, Q1 is the first quartile or the 25th percentile, and Q3 is the third quartile or the 75th percentile. A lower convergence value indicates a smaller spread in the middle 50% of responses, suggesting greater agreement among experts. Values closer to zero are considered ideal, with significance often attributed to values of 0.5 or less.
Consensus, representing the agreement or consistency within the dataset, is assessed similarly to convergence, using IQR. A value closer to 1 indicates higher validity, with a value of 0.75 or higher considered significant. Consensus is calculated as Eq. (3):
where, the Mdn is the median value of the responses. Whereas the stability of the responses is measured using the coefficient of variation (CV). It is described using the following Eq. (4):
where, S is the standard deviation and is the arithmetic mean. A CV of 0.5 or less is considered stable (English and Kernan, 1976), while relative stability is suggested when values are between 0.5 and 0.8, and lastly, it is generally considered unstable if values are above 0.8. Lastly, to validate the applicability of the identified steep slope risk factors, a survey of 200 randomly selected MOIS-identified steep slope locations was conducted incorporating the identified factors.
Results and Discussion
In this study, an extensive analysis of 60 relevant studies was conducted, listed in the Appendix (Appendix Table 1). These studies were identified through a series of filtering as outlined in the methods section and the categorization of these studies is presented in Table 3. The prevalent theme among the studies is the investigation into the synergistic influence of different geological factors on slope collapse risks, accounting for 41.67% of the total studies – highlighting the importance of geological interactions in understanding the stability of slopes.
A notable 80% of studies were published between 2013 and 2024, reflecting recent advancements and growing interest in landslide risk assessments. Detailed analyses were conducted using Gephi to visualize keyword relationships and KH Coder for statistical analyses, including betweenness centrality, modularity, and multi-dimensional scaling. These analyses highlighted key patterns and clusters in the studies, offering insights into prevailing themes in landslide risk management. The findings were then compared with existing guidelines, revealing gaps and inconsistencies, particularly in the MOIS steep slope risk assessment guidelines.
Table 3.
Summary of research papers published between 2002-2023 by category
Text Mining and Network Analysis Results
Gephi Network Analysis Results
The co-occurrence network visualization in Gephi (Fig. 4) partitions into six distinct clusters. These distinct clusters were identified and can be interpreted to correspond to the following categories in Table 4. Key elements such as ‘landslide,’ ‘soil,’ ‘rainfall,’ and ‘slope’ were prevalent within their respective clusters.
The network analysis illustrates how these factors interact, highlighting the complexity of slope stability. The implications of the identified clusters are significant for developing a precise risk assessment model. Cluster A includes fundamental terms such as ‘landslide’ and ‘soil,’ which are crucial for landslide risk assessments. Cluster B highlights the importance of geotechnical elements, such as ‘soil’ and ‘depth,’ indicating their significant impact on geotechnical evaluations and landslide susceptibility. Similarly, the yellow cluster, with terms like ‘rain,’ ‘rainfall,’ and ‘runoff,’ is vital in predicting landslides and developing mitigation strategies. The larger node sizes for ‘rain’ and ‘rainfall’ confirm the critical influence of precipitation on slope stability.
Cluster C identifies high-risk areas for targeted interventions, with ‘vegetation’ and ‘land use’ reflecting their key roles in influencing slope stability through human and natural processes. Cluster E contains terms like ‘tree,’ ‘land,’ and ‘forest,’ emphasizes the importance of vegetation in either mitigating or exacerbating landslide risks. Lastly, cluster F encompasses topographical elements such as ‘slope,’ ‘gradient,’ ‘aspect,’ and ‘elevation,’ which affect water drainage and soil movement, indicating their significant impact on landslide susceptibility.
The identified clusters illustrate the interrelationships among factors and highlight areas needing attention in risk assessments. Understanding these relationships is crucial for enhancing risk assessment guidelines. The implications of each cluster will be discussed in the following sections.
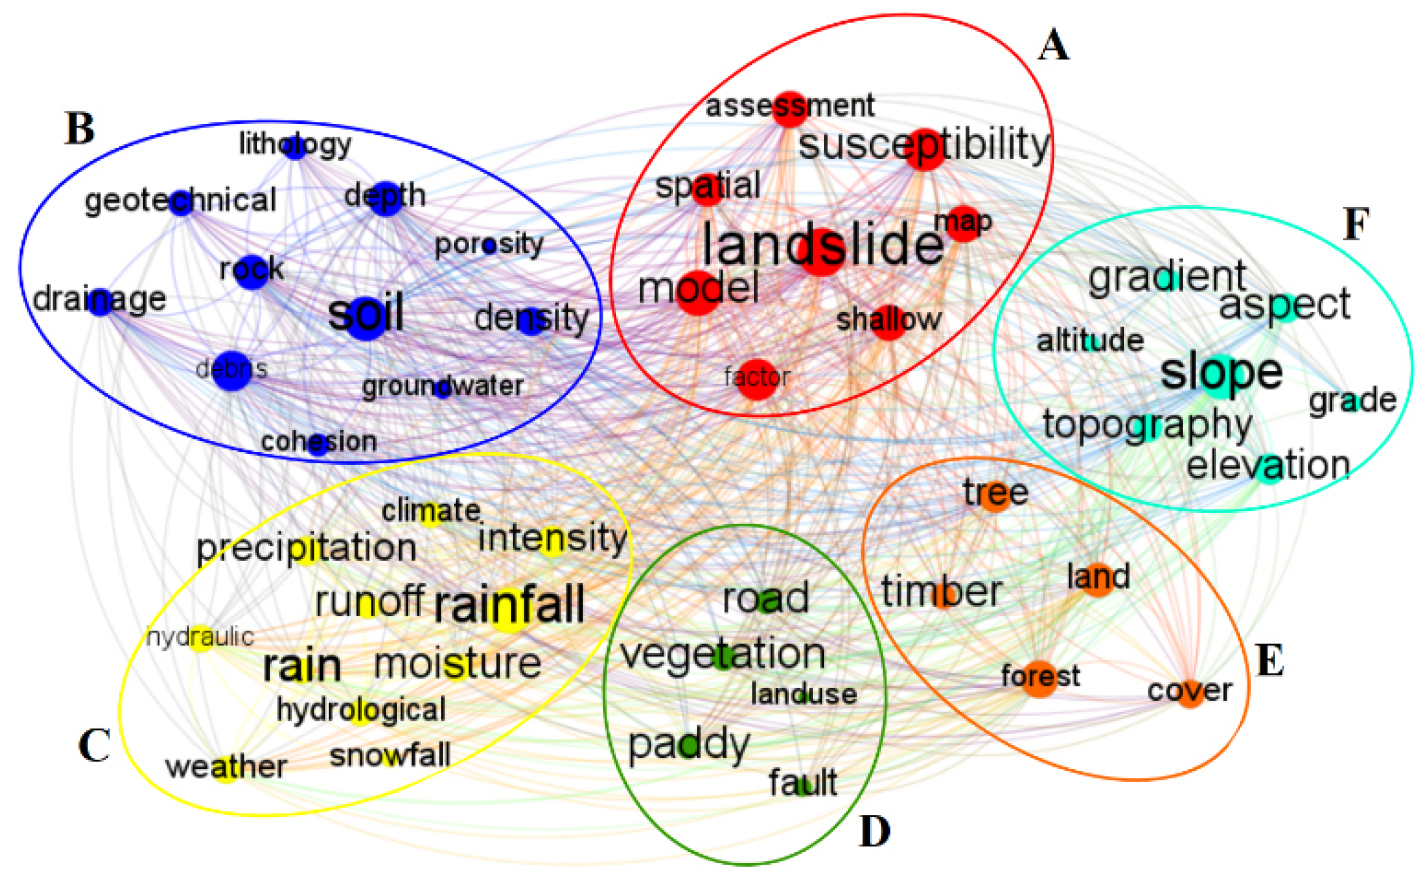
Table 4.
Summary of clusters in co-occurrence network in Gephi
KH Coder Word Frequency results
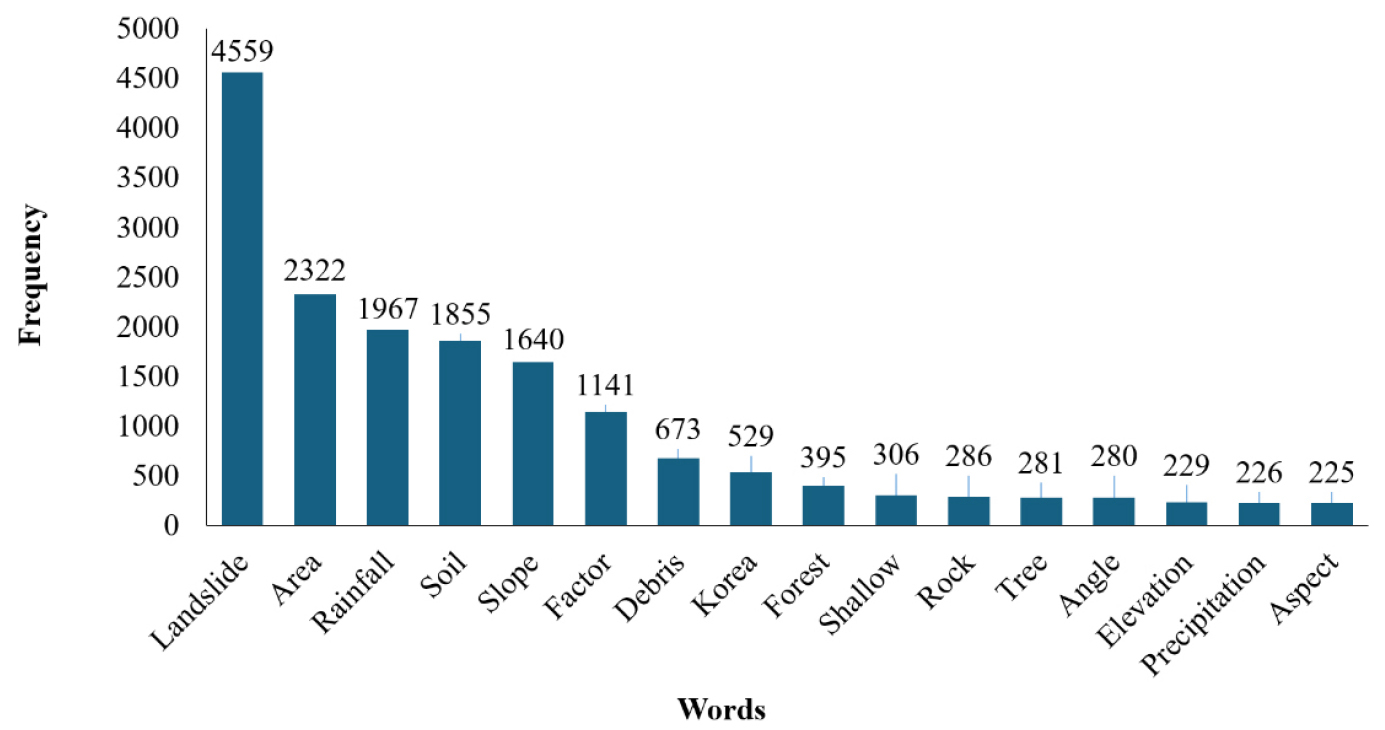
The KH Coder word frequency analysis (Fig. 5) identified the top 16 significant terms related to landslides, with “landslide” appearing most frequently (4,559 times), followed by “area” (2,322), “rainfall” (1,967), “soil” (1,855), and “slope” (1,640). These terms, prominent in both frequency and co-occurrence analyses, underscore their critical role in terrain stability and risk assessments. The findings highlight the need to incorporate these factors into risk assessment guidelines for greater accuracy and effectiveness.
KH Coder performed co-occurrence network analyses, including betweenness centrality and modularity subgraph analysis (Fig. 6). Combining both analyses provides an in-depth view of the gathered studies, revealing the thematic structure and key connectors within the dataset.
The modularity subgraph analysis in Fig. 6a, similar to the co-occurrence network in Gephi, identified distinct clusters within the network. Each cluster represents a cohesive group of frequently co-occurring words. For instance, subgraph 1 (turquoise cluster) includes terms such as ‘area,’ ‘factor,’ and ‘susceptibility,’ cantered around the keyword ‘landslide,’ which pertains to geographical and environmental factors. Another notable cluster is the subgraph 4 (red cluster), which includes terms such as ‘depth,’ ‘property,’ and ‘condition,’ with a strong centrality around the keyword ‘soil,’ indicating subjects related to soil characteristics.
Centrality measures within each cluster revealed pivotal terms and their associations. Some clusters, like those cantered around ‘landslide,’ showed strong connections, while others were more loosely connected. This analysis illustrates the varying strengths of as-sociations between terms and offers insights into the data’s underlying structure, allowing for a targeted approach to data collection and analysis. The betweenness centrality analysis (Fig. 6b) pinpoints key terms that function as bridges between different clusters or groups. Terms with high centrality such as ‘landslide,’ ‘slope,’ and ‘rainfall’ were crucial for connecting various subjects, facilitating information flow across the network. This understanding is crucial for developing an integrated risk assessment model that captures the complex interdependence between various factors influencing steep slope stability.
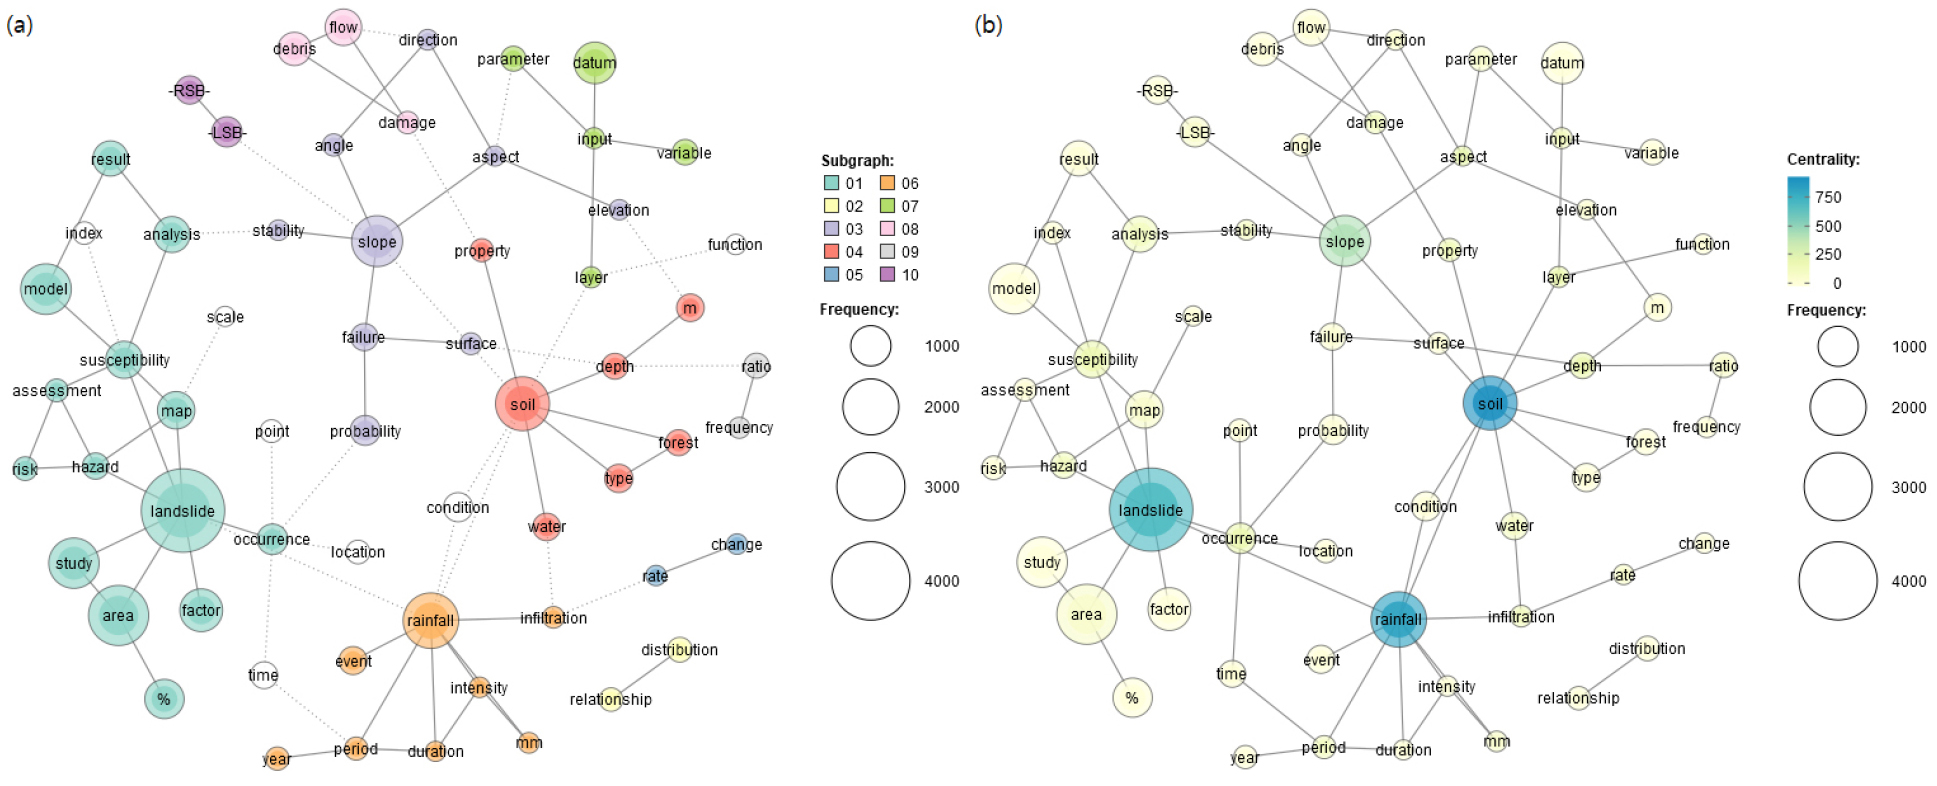
The combined analysis of the modularity subgraph and betweenness centrality not only aids in identifying and analyzing key risk factors but also ensures that the resulting risk assessment model is thorough and interconnected. This integrated approach emphasizes thematic structures and crucial connections, offering a solid framework for comprehending and addressing risks associated with steep slopes.
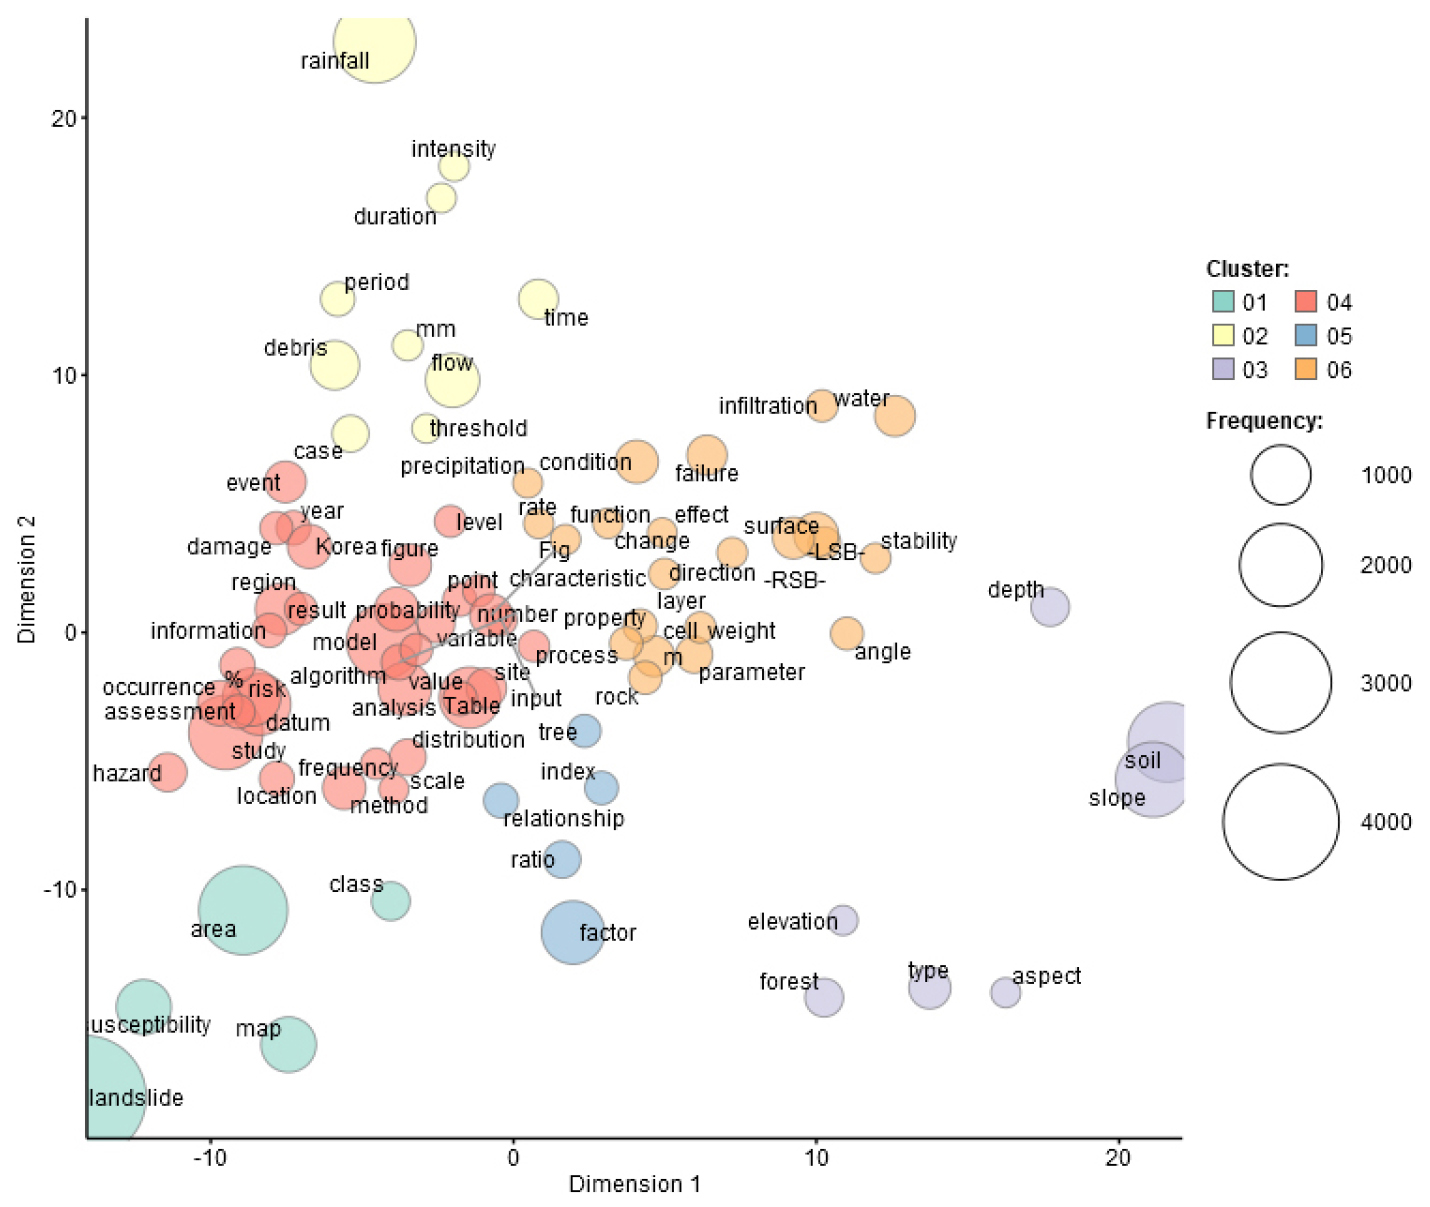
The MDS analysis (Fig. 7), identified clusters within the data, capturing key themes like potential harm, environmental factors, and spatial considerations. These findings align with the clusters observed in the Gephi network, reinforcing the connections between these factors. MDS was chosen for its ability to visualize relationships between terms, showing how closely related or distinct they are. The scatter plots illustrate these connections, with clusters of terms near the origin indicating strong relationships. The color coding in Fig. 7 aligns with the Gephi clusters, making it easy to compare the themes across different analyses.
These findings emphasize the significance of the key factors identified, highlighting their relevance in assessing steep slope risks. The consistent themes across multiple analyses reinforce the need to incorporate these factors into risk assessment frameworks, particularly for landslide mitigation on steep slopes.
Comparison with Existing Evaluation Guidelines
The previous analysis identified several factors that significantly influence steep slope risk susceptibility, including topographic features, soil characteristics, precipitation patterns, and historical environmental impacts. A comparison of these factors with the latest Evaluation Guidelines (2023 Release), shown in Table 5, highlights several critical elements missing in current risk assessments. These gaps affect the comprehensiveness of existing evaluations, particularly regarding slope aspect, elevation, soil type, rainfall, snow, and forest fire history. This study examines three types of steep slope evaluation guidelines: natural slopes, artificial slopes, and reinforced slopes. While the guidelines address factors such as social impact and an investigator calibration score, the focus of this study is limited to collapse risk factors.
Table 5.
List of Collapse Risk Factors in the Steep slope Guidelines in South Korea (2023)
Slope aspect, or the orientation of a slope relative to the cardinal directions, influences environmental factors such as sunlight exposure, moisture retention, and vegetation growth. In the co-occurrence networks, slope aspect clusters with terms like ‘altitude,’ ‘grade,’ ‘direction,’ and ‘stability,’ illustrating their role in understanding slope stability. Despite its significance in multiple research studies, existing guidelines fail to adequately address this factor. Incorporating the factor, slope aspect, into landslide susceptibility assessments enhances hazard and risk mapping by considering regional wind patterns and the dominant role of specific slope orientations in landslide processes (Gorokhovich et al., 2016). Studies show that slope aspect affects parameters such as rainfall, sunlight exposure, and discontinuities, which are essential in landslide susceptibility mapping (He et al., 2012).
Moreover, the MDS analysis further supports the importance of slope aspect, showing strong associations with environmental conditions. This is indicated by the clustering of 'aspect' with ‘forest,’ ‘elevation,’ and ‘type,’ where ‘type’ may refer to ‘soil type,’ highlighting the significance of slope aspect in risk assessments. Additionally, slope aspect in-fluences soil properties, water retention, and nutrient availability, which are crucial for vegetation recovery and erosion prevention post-wildfires (Francos et al., 2021). Furthermore, slope aspect was found to be the most frequently noticed topographical parameter of the terrain influencing soil erosion after slope steepness (Jarasiunas, 2016).
Slope ‘elevation’ appears frequently in the dataset as shown in the frequency analysis highlighting its importance in steep slope risk assessment. It directly affects slope stability where a higher slope height, given a fixed angle, increases the probability of collapse (Fenton et al., 2013). Furthermore, in Gephi’s co-occurrence network, its clusters with terms such as ‘slope angle,’ ‘height,’ and ‘topography,’ aiding in understanding how elevations impact slope failure risk. The existing guidelines fail to adequately address this factor, despite the significance it has been shown to hold in multiple research studies. Song and Li (2022) noted its impact on gravity and water infiltration relating to slope stability. Furthermore, Fadhillah et al. (2022) and Park et al. (2013) concluded that steep slope collapse occurrences are more likely in higher-elevation areas. The MDS analysis further supported the importance of elevation, showing strong associations with other topographical features, as seen in the proximity of ‘elevation’ to ‘slope,’ ‘forest,’ and ‘type’ in the graph, reinforcing its critical role in risk assessments.
‘Soil type’ is another critical factor that shows frequency and centrality in the analysis, highlighting its significance in slope stability. Specifically, the factor ‘soil type’ clusters with ‘soil type,’ ‘depth’, and ‘moisture’, emphasizing the importance of soil proper ties in determining slope failure susceptibility. Nonetheless, this is another area that the existing guideline has insufficiently addressed. Studies have shown that soil properties significantly impact slope stability. For instance, Kim and Song (2015) found lower shear strength in steep slope soils, while Kurniawan (2019) noted varying permeability in different soil types, increasing water retention and vulnerability to slope failure The National Geographic Information Institute (NGII) emphasized that the relative proportion of sand, silt, and clay particles defines soil texture. Sandy soils drain quickly but are erosion-prone (Moragoda et al., 2022), silt is cohesive but unstable when saturated (Hillel, 2004), and clay, while highly cohesive, can shrink, expand (Tang et al., 2023), and swell (Schulz et al., 2018). Given the multitude of soil types, it is more practical to assess soil based on its composition of rock soil, weathered soil, loamy soil, sandy soil, or clayey soil. Furthermore, MDS analysis confirmed the significance of soil type, showing strong associations with other geotechnical aspects, as indicated by the clustering of ‘soil’ with ‘slope’ and ‘depth,’ further emphasizing its impact on slope stability.
Additionally, ‘Rainfall’ and ‘Snow,’ are frequently mentioned factors - with ‘rainfall’ appearing in the upper 20% of the frequency analysis – shows that precipitation patterns significantly influence slope failure risk. Intense rainfall and snowmelt are major land-slide triggers, due to an increase in soil moisture and reduced shear strength (Lee, 2004; Xiong et al., 2020). These terms link with ‘precipitation,’ ‘intensity,’ and ‘infiltration,’ forming a cluster focused on hydro-logical factors. Consequently, this is another gap in the current guidelines and addresses their impact. Studies like (Kawagoe et al., 2009) corroborate this by noting the limited consideration of hydrological conditions in land condition assessments. (Lee, 2004) identified heavy rainfall as the main cause of steep slope failures in South Korea emphasized the impact of rainfall patterns, intensity, and duration on soil stability, while (Kim and Park, 2021) noted the effects of short-duration rainfall. (Wang et al., 2022) discussed the effects of freezing and thawing cycles on slope stability, and (Xiong et al., 2020) highlighted thawing’s role in water infiltration and slope deformation. These studies underscore the importance of precipitation patterns’ role in steep slope risk assessment. MDS analysis highlighted the integral connection of rainfall and snow with hydrological and soil-related terms, as shown by the clustering of ‘rainfall,’ ‘intensity,’ and ‘duration,’ reinforcing their critical role in risk assessments. These studies underscore the importance of precipitation patterns’ role in steep slope risk assessment.
Forest fire, or the ‘history and severity of forest fires’ factor, also known as wildfires, significantly influences landslide susceptibility (Zhang et al., 2022). Although less frequent than other factors it remains a key factor in risk assessments. Forest fires destabilize slopes by vegetation that binds soil and absorbs water (Movasat and Tomac, 2020). ‘Forest fire,’ as illustrated in the analysis, is associated with terms like ‘land,’ ‘forest,’ and ‘tree.’ This cluster examines fire’s ecological and environmental impacts on slope stability. This is also a factor that current guidelines do not sufficiently address. According to the British Columbia Ministry of Forests and Range, severe wildfires increase landslide risk by damaging the forest canopy and underlying vegetation. (Lee et al., 2019) linked forest fires to decreased soil permeability and increased landslide initiation, particularly in the first 1-10 years post-fire. The literature extensively documents post-fire effects on slope stability, highlighting the need to integrate these factors into risk assessments. In addition, Global warming increases forest fires, which in turn heightens landslide risk, making it essential to study this factor.
In summary, the comparison with existing evaluation guidelines has shown the importance of these inadequately addressed factors identified through co-occurrence visualization. The validation of these findings will be conducted through a Delphi analysis in the subsequent section, utilizing the insights and expertise of experts and professionals to enhance the precision of landslide susceptibility assessment guidelines.
Data Validation
The results of the Delphi technique were evaluated based on several criteria, including CVR, degree of convergence, agreement, and coefficient of variation. The values for these metrics are presented in Table 6. The analysis of the Delphi technique results provided several key insights into the factors affecting landslide susceptibility. Rainfall ap-pears to be the most significant factor, with a CVR of 0.80 and minimal variability, indicating its strong suitability for further analysis. In contrast, Slope Aspect showed a negative CVR (-0.10) and high variability, suggesting that experts do not consider it important, and its measurement is inconsistent. Therefore, it may be necessary to re-evaluate or exclude ‘Slope Aspect’ from the proposed guidelines.
Soil Type and Forest Fire both demonstrated high convergence, with scores of 0.75 each, indicating strong expert consensus and consistent results across various methods. This establishes them as reliable factors. However, Slope Elevation, despite having the highest agreement (0.88), exhibited the lowest convergence (0.25). This suggests that while experts agree on its measurements, they have differing opinions on their impact.
Table 6.
Delphi analysis results
South Korea Case Study
To confirm the factor’s field applicability, 200 steep slopes currently listed in the National Disaster Management Information System (NDMS) were randomly extracted to check whether the newly determined steep slope risk factors apply to the field, with the category scoring shown in Table 7. The applicability of the extracted factors to South Korean conditions was then examined through Delphi validation by Korean experts and field application to 200 MOIS-registered steep slope sites. Thus, the South Korean case study was used to assess domestic applicability of the extracted factors, rather than to provide full event-based predictive validation.
Table 7.
Factor classification and score
Significant changes in landslide susceptibility have been observed upon integrating the risk factors, as shown in Table 8. For slopes graded as A (Very Low Risk), only one lo-cation was identified before weighing, with no additional risk detected after weighing or when excluding slope aspect, indicating minimal influence from these factors.
Table 8.
Analysis of disaster risk of 200 steep slope locations
For slopes graded as B (Low Risk), the number of locations dropped from 63 before weighing to 5 after weighing, demonstrating that additional factors significantly reduce perceived risk. Excluding slope aspect, the count increased to 18, showing impact of slope aspect but emphasizing the importance of the added factors.
For slopes graded as C (Moderate Risk), the number of locations experiencing in-creased disaster risk rose from 63 to 82 when additional factors were included. Conversely, excluding the slope aspect led to a slight decrease to 75 locations, suggesting that slope aspect reduces perceived risk when considered.
For slopes graded as D (High Risk) and E (Very High Risk), both categories showed a similar increase in locations, from 64 to 75 and from 9 to 38, respectively, highlighting that additional factors reveal significantly more high-risk locations. However, while the locations increased in category D when excluding slope aspect, Category E revealed a decrease in location indicating that for very high-risk locations the inclusion of slope aspect is crucial. The increase in Grade E classifications indicates that the revised system is more sensitive to underrepresented likelihood-related factors and can identify slopes that may require closer attention under the updated assessment framework.
Participants in the Delphi method reached a consensus among the 20 experts on the importance of incorporating these additional steep slope risk factors to enhance current disaster risk assessment and management practices in South Korea. Furthermore, the newly identified factors are applicable to all three types of slopes outlined in the evaluation guidelines, reinforcing the need for a comprehensive approach.
The definitive identified key risk factors include slope elevation, soil type, precipitation patterns, and the history and severity of forest fires. The slope aspect was removed from the final list of factors due to conflicting opinions in the Delphi analysis. Although experts agreed on its measurements, they had differing views on its impact. Ultimately, the Delphi analysis confirmed the significance and importance of the remaining factors. Field tests further demonstrated their applicability in diverse settings. Consequently, the proposed framework offers a comprehensive approach to steep slope risk assessment, emphasizing the need for updated guidelines that incorporate these validated factors. These findings also have significant implications for global risk assessment practices, providing a model adaptable to various mountainous regions to enhance disaster mitigation and community resilience.
Synthesis of Analysis Results
This section presents a comprehensive analysis integrating the study’s findings with existing national guidelines for steep slope risk assessment. The analysis identified several key risk factors, including slope elevation, soil type, precipitation patterns, forest fire history, and snow. Despite their recognition in various studies, the study’s text mining and network analysis highlight the significance of these factors, which are surprisingly absent in the current guidelines. These identified factors are fundamental concepts in slope stability but are often overlooked. A detailed comparison revealed gaps such as the lack of consideration for the increased risks associated with higher elevations, generalized soil types without evaluating shear strength and permeability, insufficient details on precipitation intensity and patterns, the overlooked impact of forest fires, and inadequate attention to snow accumulation.
The co-occurrence network analysis in Gephi identified significant relationships, forming important clusters such as Geological Conditions, Hydrometeorological Conditions, Spatial Vulnerability Assessment, Ecological Influences, and Terrain Features. Key topics within these clusters include ‘landslides,’ ‘soil,’ ‘rainfall,’ ‘vegetation,’ ‘tree,’ and ‘slope.’ Word frequency analysis further underscored the importance of terms like ‘rainfall,’ ‘soil,’ and ‘forest’ as indicators of landslide susceptibility. KH Coder’s analysis identified subgraphs or communities within the network, with key nodes like ‘slope,’ ‘depth,’ and ‘moisture’ being central in information flow. The MDS results supported these findings, visually grouping terms like ‘slope elevation,’ ‘forest,’ and ‘type,’ emphasizing the interconnections between these factors. These results stress the necessity of incorporating these interdependencies into risk assessment frameworks to improve landslide mitigation, especially on steep slopes.
A final comparison with existing guidelines confirmed the importance of Slope Aspect, Slope Elevation, Soil Type, Rainfall, Snow Depth, and Forest Fire. The Delphi analysis highlighted rainfall as the primary factor impacting landslide susceptibility, indicating its potential for further examination. The soil type and forest fire demonstrated strong agreement among experts and yielded consistent results, establishing them as reliable factors. Slope aspect, however, was deemed less significant with inconsistent results. While slope elevation showed high agreement, its impact remains debated, suggesting the need for further evaluation.
This study employed a novel methodology that combines text mining and Delphi analysis to identify key risk factors for steep slope failure that are missing from current guidelines. Compared to traditional landslide susceptibility models, which often rely on quantitative data and historical records, this qualitative approach adds contextual depth and uncovers emerging risk factors that might not be immediately apparent in existing data. While traditional models focus on fixed parameters like slope angle or soil type, they often fail to account for the dynamic nature of risk factors that vary with time, environmental changes, and other factors like forest fires and snow depth. The Delphi analysis provided flexibility and local relevance, making it particularly useful in situations where historical data is sparse or evolving. Moreover, by integrating expert knowledge, this approach helps fill gaps in the data, leading to a more comprehensive risk assessment framework.
While quantitative models remain essential for large-scale assessments, this qualitative Delphi-based approach allows for more nuanced, region-specific insights that can better inform policy decisions and disaster response strategies, especially in regions with highly variable environmental conditions like South Korea. Although the primary objective of this study was to improve the identification and validation of underrepresented factors that affect the likelihood of landslide occurrence, the overall risk classification used in the Delphi analysis and field validation did incorporate both likelihood and consequence components. Consequence factors—such as estimated population exposure, infra-structure importance, and road traffic volume—were evaluated in alignment with South Korea’s existing MOIS risk assessment structure. These were included in the expert panel’s scoring process during the 200-site field assessment. While the consequence parameters themselves were not revised in this study, their integration ensured that the final risk classifications reflected a comprehensive understanding of both dimensions of risk.
The field test on 200 randomly selected steep slope locations in South Korea showed that including these validated factors in the models greatly improved prediction accuracy and reliability. Areas with low risk saw a decrease in risk, while high-risk areas saw an increase, confirming the importance of these factors in enhancing the precision of land-slide risk assessments. Models that integrate these factors offer more accurate predictions of slope instability, enabling more precise and efficient mitigation strategies.
Practical Implications, Limitations, and Future Research Directions
This study’s comprehensive analysis and validations via Delphi analysis revealed key factors that contribute to landslide susceptibility, especially on steep slopes similar to those of South Korea. While the factor, slope aspect, was excluded due to low impact, other factors demonstrated a significant expert consensus. Integrating the identified factors into the Steep Slope Evaluation Guidelines provides significant implications for various stakeholders.
For policymakers, updating national and regional guidelines to include critical fac-tors such as slope elevation, soil type, rainfall intensity, snow accumulation, and forest fire history will enhance risk assessments and guide resource allocation and emergency preparedness. These updates should reflect the latest research on the relationship between topographic characteristics and geomorphological processes (Emberson et al., 2022; Lee et al., 2002). According to Suk et al. (2019), it is crucial to consider different factors when developing risk assessment guidelines in order to create effective strategic plans for mitigating specific hazards. This study provides evidence to update these guidelines by directly incorporating validated factors that significantly influence landslide risk, ensuring a more comprehensive and effective approach to risk management.
For practitioners, the improved guidelines offer means to better identify high-risk areas, allowing for more focused mitigation strategies and optimized resource allocation. This is particularly critical in mountainous areas where accurate elevation data and knowledge of soil composition are crucial for predicting the risks of erosion and slope failure (Kim and Song, 2015), giving importance in mitigating weather-related risks. By effectively prioritizing interventions, practitioners can improve the capacity of efficient control methods for erosion and traffic management techniques. Furthermore, Regular training programs will further enhance their understanding of risk assessments, ensuring the new guidelines are effectively implemented.
For communities, enhanced early warning systems and targeted mitigation efforts reduce vulnerability to landslide hazards. Educating residents about updated risk factors promotes a stronger sense of awareness and preparedness, ultimately strengthening community resilience. Furthermore, by considering factors such as forest fire history, which has an impact on slope stability, stakeholders can better anticipate and reduce the risks of landslides post-fire.
For global communities, encouraging international collaboration, particularly with regions with similar mountainous terrain, to share best practices, research findings, and technological advancements in steep slope risk management is essential. Although the mountainous terrain of South Korea shares topography and soil similarities with countries like Taiwan, Japan, China, and the Philippines (Gue, 2024), the specific landslide risks are influenced by unique factors inherent to each region. By enhancing the methodologies and technologies used in landslide risk assessment in South Korea, these advancements can be shared and adapted by other nations to bolster their own risk assessment capabilities (Gue, 2024). The exchange of knowledge and best practices in landslide risk assessment can lead to a more comprehensive understanding of landslide vulnerabilities across regions with similar geological features.
The validated risk factors from this study can be adapted to various contexts, improving risk management practices, and strengthening resilience against steep slope collapse. This analysis highlights the importance of integrating validated factors into existing guidelines to enhance their comprehensiveness and effectiveness. Future research should focus on collecting data on overlooked factors and incorporating local studies for a more detailed understanding.
On a broader scale, the inclusion of various factors ensures a holistic approach to evaluating landslide risk. This approach considers the complex connection between topographic features and geomorphological processes, promoting sustainable development by integrating these guidelines into urban planning and development projects. This promotes safer construction practices and long-term resilience against natural disasters. Beyond that, considering variables such as rainfall intensity and forest fire history aids in understanding the effects of climate change on slope stability.
However, despite the aim of the paper to be fully comprehensive, this study has several limitations that must be addressed. Because the candidate factors were extracted from repeated textual patterns within the screened corpus, this approach reduced direct author-driven selection of risk factors. Nevertheless, the number of selected studies and the focus on English-language publications remain limitations, and future studies should incorporate Korean-language technical reports, domestic disaster records, and additional regional case studies. In addition, the lack of extensive data on snow depth and forest fire history, together with the potential for language bias due to reliance on English literature during the literature gathering. Additionally, it is necessary to develop dynamic models that can adapt to climate change and urban development, as current static models are insufficient in capturing the changing dynamics of environmental conditions that affect slope stability. Future research should validate the revised classifications against actual collapse cases, particularly slopes previously classified as low or moderate risk but later affected by failure.
While this paper uses South Korea as a case study, its findings can serve as a foundational basis for other regions with similar attributes. However, it is imperative that extensive research on each region’s unique characteristics, particularly soil type, is conducted to ensure accurate and effective risk assessment and mitigation strategies.
Continuous research and development should prioritize the refinement of identified factors and exploration of new variables to enhance predictive models. Integrating advanced technologies like remote sensing and GIS can enhance disaster management practices by providing precise and efficient risk assessments (Wang et al., 2022). This approach promotes well-informed decision-making and supports the creation of resilient communities and manifestly plays a vital role in safeguarding lives and property from natural disasters.
Conclusion
This study has identified and validated key risk factors contributing to steep slope collapses through advanced text analytics and the Delphi Method. The refined methodologies employed in South Korea’s steep slope risk assessment exhibit broader applicability to regions with similar topography and soil types, such as Japan, Taiwan, and the Philippines. These advancements assist in prioritizing mitigation efforts in high-risk areas and empower decision-makers and policymakers to develop targeted strategies for improved risk management. Key Findings are as follows:
1. Validated Key Risk Factors: Confirmed slope elevation, soil type, 1-hour disaster performance target rainfall, snow depth, and forest fire as critical risk factors.
2. Text Analytics and Network Analysis: Identified clusters of critical risk factors, including geological, hydrological, and topographical elements, illustrating their inter-relationships.
3. Delphi Method Validation: Achieved consensus among 20 experts on the significance of the identified risk factors.
4. Practical Applicability: Evaluated 200 random steep slope locations in South Korea, confirming the enhanced sensitivity and effectiveness of the updated risk assessment models.
Updating risk assessment guidelines based on these findings can support more in-formed decision-making, improve resource allocation, and strengthen community resilience to slope-related hazards. The classification and scoring system introduced here provides a practical tool for local government evaluators, especially in settings with limited technical or financial capacity. While developed for South Korea, the framework is to other regions with comparable geomorphological and climatic conditions, offering a transferable model for enhancing landslide risk assessments globally.
Nevertheless, certain limitations remain, including incomplete data on snow accumulation and forest fire history, as well as potential language bias within the text mining corpus. Future research should address these limitations by incorporating a broader range of environmental variables and applying the framework in diverse regional settings.
Overall, this study offers a replicable and policy-relevant contribution to risk management in steep terrain. By integrating computational evidence mining with expert consensus, it provides a scalable foundation for updating hazard models and improving disaster preparedness in vulnerable communities worldwide.
Appendix