

Introduction
Description of the Study Area and Policy
The status of soybean production of China
Connotations and features of soybean target price subsidy policy of soybean
The time and implementation process of soybean target price policy
Materials and Methods
Sampling and methods of data collection
Econometric model specification
Estimation procedure
Result and Discussion
Descriptive statistics
Estimation results
Conclusion
Introduction
China is well known as an agricultural country. In order to promote stable development of grain production, the Chinese government put forward the requirements of “exploring target price subsidy system” in the National Instrument that are the medium and long-term plan for the national food safety (2008-2020) and the nationwide increasing by 100 billion tons of grain production capacity planning (2009-2020) explicitly.
Soybean plays a very important role in Chinese agriculture. It is not only the main source of vegetable oil but also an important source of plant protein. Since 2008, the implementation of the temporary and storage policy, played a security role in terms of protecting soya farmers’ income (Xu et al., 2010). On October 17th, 2008, the central government purchased soybean at the price of 85 yuan/kg in the Northeast and Inner Mongolia region in order to ensure production increase and promote production of food under the background of the impact of the international soybean’s prices sharp fall. In the early implementation of the store policy, there were some problems about the store policy such as unreasonable limited volume and time limited acquisition, but after two years of exploration and attempt, until 2010, the store policy of soybeans was basically mature and the mainly purchaser was China Grain Reserves Corporation. Generally, acquisition period began from November to April 30th the next year, and the price also increased year by year, rising from 1.85 yuan/jin in 2008 to 2.3 yuan/jin in 2013. The implementation of the soybean temporary and storage policy made the domestic soybean price stable. It secured soya farmers planting income guarantee, however, there were some challenges such as the single acquisition subject, high adjusting cost of storage and transportation, soybean price remaining high, weak international competitiveness of downstream of soybean processing enterprises, accessing to the post by the means of reselling at a profit and being diverted subsidies (Chen et al., 2016).
In 2014, Central Document No.1, put forward that “Practice the soybean target price subsidies pilot in the northeast and Inner Mongolia”. The reforms of target price subsidies pilot relatives to the whole situation of reform on Chinese agricultural pricing mechanism, improving the pricing mechanism, solving domestic and international price inversion problem of agricultural products, but according to practicing, it was found that there were some challenges such as difficult to figure out soybean planting area, moral hazard and high cost of subsidies (Wang et al., 2016). Lu et al. (2015) pointed out timely discovery of the problems existing in target price subsidies pilot, summarizing experience, not only relates to protection of the development of the national cotton, soybean industry and reasonable profits of cotton and soybean farmers pilot area, but also assumes the exploration mission of pricing mechanism in the agricultural products market.
Using the data from 2004 to 2015 gotten from China Rural Statistical Yearbook ,designing DID model, using STATA software, this study analyzed the soybean target price subsidy policy to find out whether it affects the Chinese soybean production and its average production. On this basis, the purpose is to find out the existing problems in the policy and to improve the soybean target price subsidy policy, while putting forward corresponding policy recommendations. The study is also of an important theoretical and realistic significance to provide reference for other agricultural products price reforms.
Description of the Study Area and Policy
The status of soybean production of China
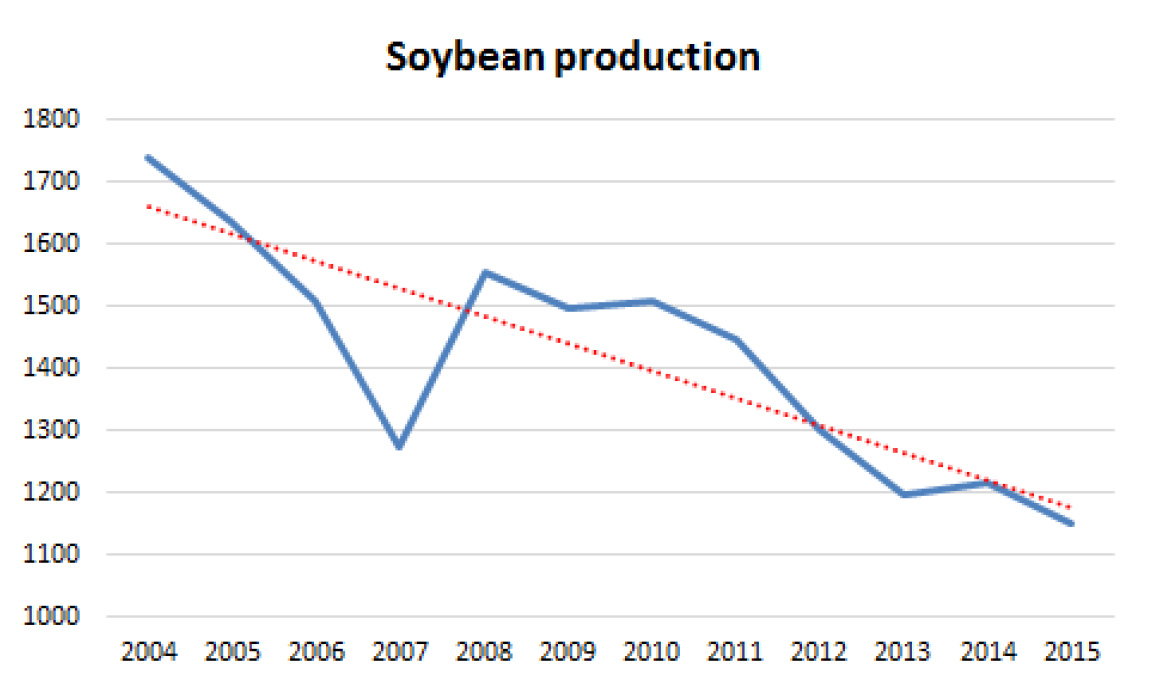
In recent years, Chinese soybean production had a glide-slope descent. Within the background of an increasing complexity of domestic and international environment and severe economic situation, the quality of domestically grown soybean was left to improve itself and avoid the excessive dependence on imported soybean processing enterprises. Many other causes contributed to the falling of domestic soybean yields and the decreasing of farmers’ enthusiasm about planting soybean. In order to satisfy the growing domestic soybean consumption demand, increasing soybean import is the only choice, which makes its self-sufficiency rate falling.
Output was an important index of soybean production during the 1949-2004 periods. The Chinese soybean output was on the rise and it reached a record 17.4 million tons in 2004. Table 1 presents the annual Chinese soybean output, which had a downward, trend overall and a slight rebound after a downward trend from 2007 to 2008. Fig. 1 presents the trend of Soybean production of the whole nation from 2004 to 2015.
Table 1.
Chinese soybean productionUnit: Million tons
| year | 2004 | 2005 | 2006 | 2007 | 2008 | 2009 |
| Soybean production | 1740.15 | 1634.78 | 1508.18 | 1272.5 | 1554.16 | 1498.15 |
| year | 2010 | 2011 | 2012 | 2013 | 2014 | 2015 |
| Soybean production | 1508.33 | 1448.53 | 1301.09 | 1195.1 | 1215.4 | 1150.0 |
In China, Heilongjiang Province, Jilin Province, Liaoning Province and Inner Mongolia are districts that have pursued target price policy for soybean since 2014. Before then, the government had put in place temporary purchase and storage policy in these provinces from 2008 to 2013. Other provinces in China did not pursue these two policies from 2008.
Connotations and features of soybean target price subsidy policy of soybean
The soybean target price subsidy policy mainly target price based on the deficiency payments policy of trigger mechanism, which is composed of three elements: target price, trigger mechanism, and deficiency payments. Firstly, target price is a reference line set for some product by the government at the time of implementing subsidy policy as commodity prices standard. It is a subjective, virtual price and a kind of institutional arrangement of social consciousness reaction on society in the market management practice by government. Secondly, trigger mechanism means subsidies at the time of effective price producers get below target price. The effective price is real income gained by producers’ sales unit of the agricultural product, including sale price pluses production subsidies except for the target price subsidies. Finally, deficiency payments, contains three elements: per unit product subside, subsidy quantity and the total amount of subsidies. The subsidy rate triggered by target price is the price difference the effective price lower than the target price, and the amount of subsidies can choose different policy intention according to the actual production, sales, or historical base production.
Target price subsidies policy of agricultural products having capability of providing price risk protection for producer according to price fluctuation, will not distort markets, as well as protect the interests of the producers effectively.
Firstly, the effect of setting target price is mainly price signal guiding function for the farmers in accordance with the market price of selling agricultural products. Thus, it can avoid direct interference and distortion owing to the government pricing. Furthermore, this makes agricultural product price change from agricultural prices determined by supply and demand by the government in the past to price determined by market, promoting all kinds of price comparison relationship problems return market equilibrium mechanism, gradually repairing some problems such as price imbalances and price inversion. Secondly, government and its authorized agencies do not directly get involved in the purchase of agricultural products, avoiding the situation of tendency of agricultural products market. Not only can stable the expectations of the market main body such as traders, processing enterprises, play the role of market mechanism, but also can avoid a large policy-oriented inventory, reduce the pressure of government purchases and policy implementation cost. Thirdly, the setting of target price has an impact on effectively protecting the interests of farmers, arousing the enthusiasm of farmers' production. When agricultural market prices are lowers than the target price, the price difference between them subsiding to farmers by the government, makes farmers get the incomes equivalent to the earnings acquiring according to the target price of sales. This method can effectively guarantee basic income of farmers, and also affect grain quality and reasonable price through market mechanism and guide farmers to plant more grain and quality food.
The time and implementation process of soybean target price policy
In 2014, taking the lead by the National Development and Reform Commission and the Ministry of Finance, Cooperating with other ministries closely, the reform of target price policy began. On May 17, National Development and Reform Commission, the Ministry of Finance and Ministry of Agriculture jointly issued soybean target price of 4800 yuan per ton in 2014. For the purpose of accomplishing explanation and publicity well, on August 26th, the Ministry of agriculture made an interpretation about soybean target price reform on the Official Website. On November 18, the Ministry of Finance released guidance about the soybean target price subsidies, putting forward guidance about the guiding ideology, basic principles, main contents and organizational leadership of target price subsidies, was put forward. At the beginning of December, the National Development and Reform Commission and the Ministry of Finance jointly issuing Approval of the implementation plan for pilot reform of soybean target price, agreed to pilot reform of Heilongjiang, Jilin, Liaoning, and Inner Mongolia n in principle. By the end of January 2015, all pilot provinces to formulate working instruction about the implementation of the soybean target price reform Fig. 2.
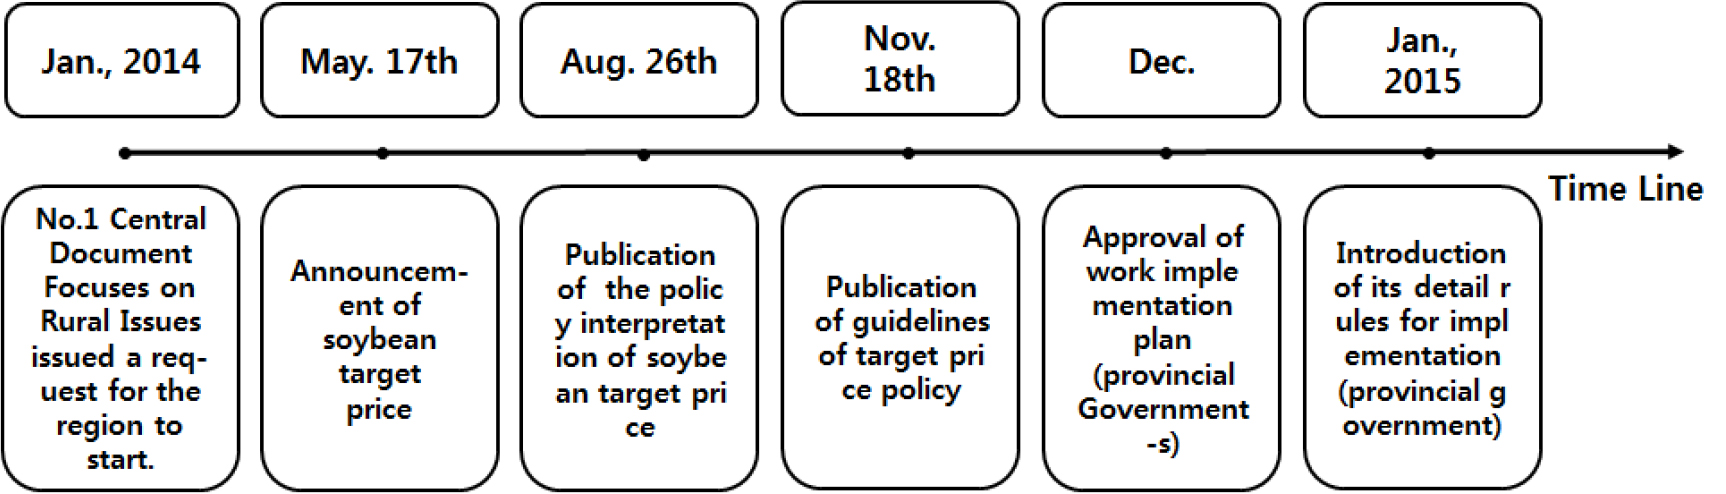
Fig. 3 shows the soybean target price subsidy policy implementation process in pilot areas. The implementation of the soybean target price subsidies in the pilot areas mainly includes formulation and promulgation of target price, verification on planting area, collection of the market price, subsidy funds and other links.
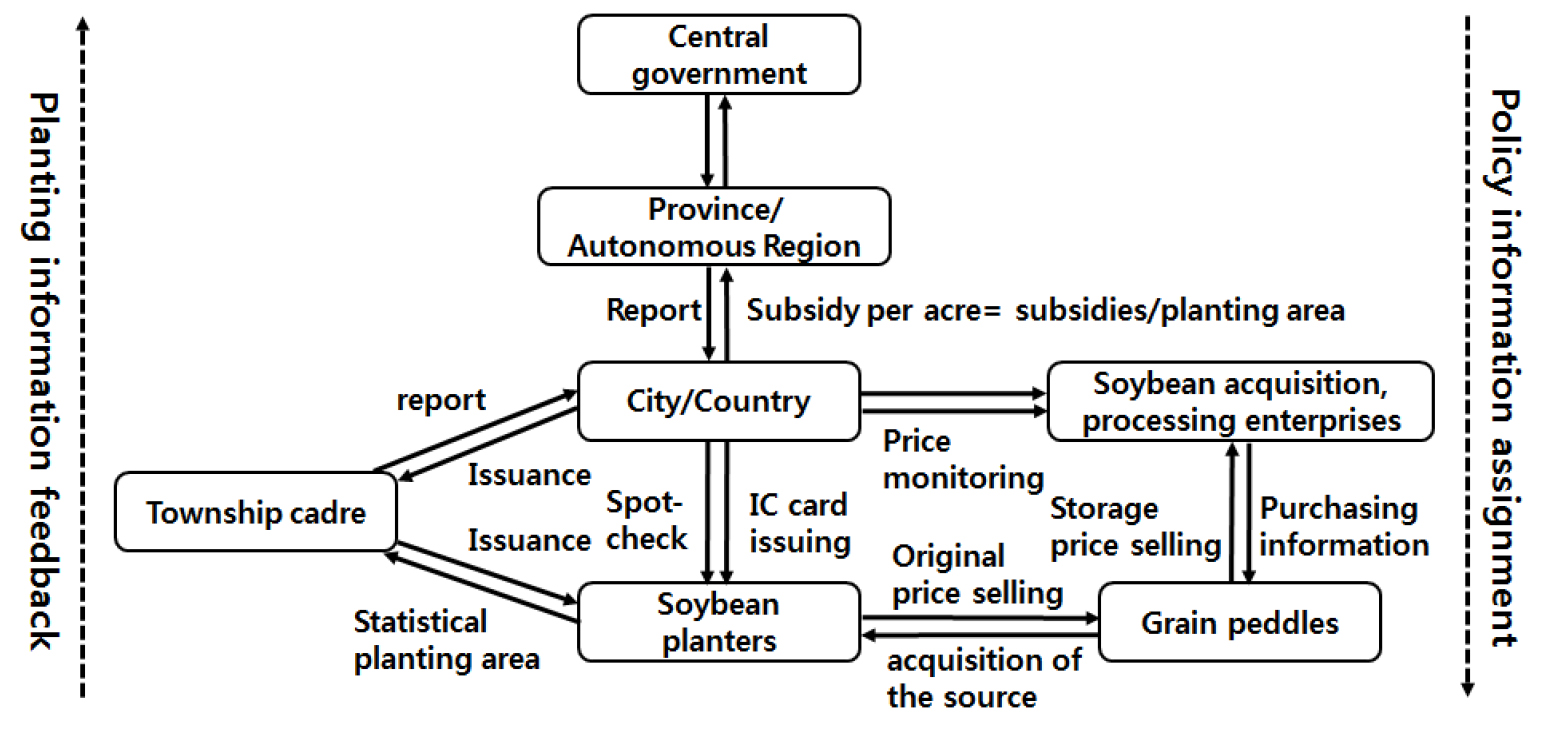
Among them, the key links are collection of the market price and verification on planting area: the Price Bureau of National Development and Reform Commission is responsible for the collection of soybean market prices Price, meanwhile, Ministry of Agriculture, Grain Bureau and other departments are involved in the collection as well. Price of pilot areas are collected by the average soybean market price between October and March the next year. The National Development and Reform Commission mainly gather information from larger purchase quantity and presentative strongly grain depot, processing enterprises, and traders who have a perennial fixed collection spot to purchase.
Ministry of Agriculture make use of farmers selling prices monitored by relevant institutions and data such as the price of market transaction making auxiliary adjustment about market price monitoring of soybean. The verification of acreage is mainly responsible for Bureau of Statistics and National Bureau of Statistics Province survey office. Survey office province, the specific data is subject to National Bureau of Statistics Province survey office. Planting area is counted by the local authorities’ statistic, reporting layer upon layer after checking.
According to the comparison before and after the soybean target price subsidy policy, by means of data analysis to evaluate whether the soybean target price subsidies having an effect on soybean production, finally, related Suggestions will be put forward to perfect the target price policy.
Materials and Methods
Sampling and methods of data collection
In China, Heilongjiang Province, Jilin Province, Liaoning Province and Inner Mongolia are districts that pursued target price policy for soybean since 2014. Before that, the government had put in temporary purchase and storage policy in these provinces from 2008 to 2013. Other provinces in China aren’t pursued these two policies since 2008.
There are 31 provinces in China and the four provinces (Ningxia, Qinghai, Tibet, Shanghai) produce soybean nearly on thousands of hectares, so I choose 27 provinces in the data. The dataset contains information on 4 provinces implemented policies defined treatment group and 23 provinces not pursued policies defined control group from China Rural Statistical Yearbook, an ongoing panel data from the year of 2004 to 2015. Except for treatment group and control group, the data also contains some control variables: The disposable income of the rural population, total power of agricultural machinery, Mulch application amount, covered disaster areas of crops, agricultural fertilizer application amount and pesticide application.
Econometric model specification
The study will divide the data of 27 provinces from the year of 2004 to 2015 into 6 subsamples by , , G three dummy variables. Thereinto, G=1 represents the provinces practiced target price policy and temporary purchase and storage policy, G=0 represents the provinces without practicing the two policies. represents the period of the provinces practiced policy 1 (temporary purchase and storage policy), represents the period without practicing policy 1. represents the period with practicing policy 2. represents the period without practicing policy 2.
According to the subsamples definition, the DID model can be defined as:
Where is the observed dependent variable, in this case soybean output, for i=1, 2, 3, …, n.; is the control variables; is entity fixed effect; is random disturbance term.
The meaning of each parameter in the DID model are shown in Table 2. From equation (1), we can find that the effect of soybean production before and after practicing policy 1 is and respectively, the range of effect on production is , similarly, the increase level of soybean production about other provinces is and before and after practicing policy 1 respectively, the range of soybean production without practicing policy is . That is to say the net impact of policy 1 on soybean production is . We also find that the effect of soybean production before and after practicing policy 2 is and respectively, the range of effect on production is , similarly, the increase level of soybean production about other provinces is and before and after practicing policy 2 respectively, the range of soybean production without practicing policy is . That is to say the net impact of policy 2 on soybean production is .
Table 2.
The meaning of each parameter in DID model
| Policy |
Policy provinces (Treatment group, G=1) |
Other provinces (Control group, G=0) | DID |
| No policy period (=0, =0) | |||
| Policy 1 period (=1, =0) | |||
| Difference 1 | |||
| Policy 2 period (=0, =1) | |||
| Difference 2 |
Estimation procedure
The important prerequisite of using DID model is for the control group and treatment group to meet Common trend hypothesis. That is to say there is no system difference in the soybean production between the four provinces (treatment group) and other provinces (control group) if the policies don’t exist. In this natural experiment, the years from 2004 to 2015 are selected. Policy 1 was practiced from 2008 to 2013 and policy 2 was practiced from 2014. Because there are continue two policies practiced in the treatment group, if we want to estimate the effect of policy 2, the effect of policy 1 need to be estimated. We use t-test to estimate the whether the change of production and average production of the control group and treat group were significant before and after policy 1 implemented respectively. Then estimate the change production and average production between policy 1 unpracticed and practiced by using t-test. Do the same to the policy 2. In the end, we use DID model to estimate the net effect of target price policy on the change of production and average production.
Result and Discussion
Descriptive statistics
Table 3 presents the explanation, name, unit and calculation method of the variables which were selected based on available factors affect the soybean production used in the analyses.
Table 3.
Definition of dependent variables and control variables, and their expected sign, in the equation
Table 4 presents the descriptive statistics for the variables used in the analyses. For measuring the production of the soybean, regard the logarithm of production (ln production) and logarithm of average production (ln avepro) as dependent variables. There is a dummy variable as core indicator that the policies whether practiced in province. The value is 1 if the province had practiced the policies and the value is 0 if not.
Table 4.
Descriptive Statistics of the sample variables
For controlling other factors, there are some control variables are selected. On the base of input and output of the soybean, planting acreage, total power of agricultural machinery, mulch application amount, covered disaster areas, agricultural fertilizer application amount and pesticide application amount are selected.
Estimation results
Table 5 and Table 6 present t-test of production and average production of soybean before and a before-and-after comparison on temporary purchase and storage policy between control group and treatment group. Using SPSS V.20 to do the t-test. It was found that there were significant changes between control group and treatment group before and after temporary purchase and storage policy implementation. In addition, it was observed that the policy was not of a significant change, on the net effect on production and average production of soybean.
Table 5.
T-test of production on temporary purchase and storage policy
| Policy 1 | Before | ln production | S. Err. | |t| | P > |t| |
| Control | 4.006 | ||||
| Treated | 4.267 | ||||
| Diff (T-C) | 0.261 | 0.078 | 3.33 | 0.001*** | |
| After | ln production | S. Err. | |t| | P > |t| | |
| Control | 4.224 | ||||
| Treated | 4.463 | ||||
| Diff (T-C) | 0.239 | 0.078 | 3.05 | 0.003*** | |
| Diff-in-Diff | -0.022 | 0.099 | 0.22 | 0.825 |
Table 6.
T-test of average production on temporary purchase and storage policy
| Policy 1 | Before | ln avepro | S. Err. | |t| | P > |t| |
| Control | 3.319 | ||||
| Treated | 3.598 | ||||
| Diff (T-C) | 0.278 | 0.055 | 5.07 | 0.000*** | |
| After | ln avepro | S. Err. | |t| | P > |t| | |
| Control | 3.390 | ||||
| Treated | 3.685 | ||||
| Diff (T-C) | 0.296 | 0.055 | 5.38 | 0.000*** | |
| Diff-in-Diff | 0.017 | 0.070 | 0.25 | 0.806 |
Table 7 and Table 8 present t-test of production and average production of soybean before and a before-and-after comparison on target price policy between control group and treatment group. It was found that there were significant changes between control group and treatment group before and after target price policy implementation. Also it is known that the policy is not significant change of the net effect on production and average production of soybean.
Table 7.
T-test of production on soybean target price policy
| Policy 2 | Before | ln production | S. Err. | |t| | P > |t| |
| Control | 4.005 | ||||
| Treated | 4.313 | ||||
| Diff (T-C) | 0.308 | 0.068 | 4.52 | 0.000*** | |
| After | ln production | S. Err. | |t| | P > |t| | |
| Control | 3.931 | ||||
| Treated | 4.139 | ||||
| Diff (T-C) | 0.208 | 0.130 | 1.59 | 0.112 | |
| Diff-in-Diff | -0.100 | 0.139 | 0.72 | 0.473 |
Table 8.
T-test of average production on soybean target price policy
| Policy 2 | Before | ln avepro | S. Err. | |t| | P > |t| |
| Control | 3.328 | ||||
| Treated | 3.645 | ||||
| Diff (T-C) | 0.318 | 0.046 | 6.89 | 0.000*** | |
| After | ln avepro | S. Err. | |t| | P > |t| | |
| Control | 3.354 | ||||
| Treated | 3.550 | ||||
| Diff (T-C) | 0.196 | 0.088 | 2.21 | 0.028*** | |
| Diff-in-Diff | -0.122 | 0.094 | 1.30 | 0.196 |
Due to the result of temporary purchase and storage policy, data from the year of 2004 to 2013 used before target price policy can be analyzed directly. DID model is used to estimate the net effect of soybean target price policy because of the quasi-natural experiment issued by the Chinese government. Table 9 presents the analysis of regression. It shows that column (1) and column (2) are the results of regression without any other control variables, column (3) and column (4) are the results of regression with control variables. It was found that the policy was not significant without control variables and with the control variables. In addition to, Planting acreage was positively and significantly affecting soybean production per year and was negatively and significantly affecting soybean production per unit at 1% level. Soybean production per year rises 80.3% and per unit declines 13.4% when the planting acreage increases one unit. Total power of agricultural machinery was negatively and significantly affecting soybean production per year and per unit at 1%. The reason is that the increase in Chinese total power of agricultural machinery of soybean planting lead to higher mechanization degree, which make the efficiency of soybean planting increased, but the Chinese soybean price is serious effected by international market, so that the production of soybean planting had a glide-slope descent. Mulch application amount, agricultural fertilizer application amount, and pesticide application amount were positively and significantly affecting soybean production per year and per unit. Covered disaster areas was insignificantly affecting soybean production per year and negatively and significantly affecting soybean production per unit.
Table 9.
T-test of average production on soybean target price policy
| Independent Variables |
(1) lnproduction |
(2) lnavepro |
(3) lnproduction |
(4) lnavepro |
| T2 | -0.278*** | 0.0367 | -0.0737 | 0.0265 |
| (-5.23) | (1.30) | (-1.33) | (0.71) | |
| G | 1.765** | 0.0265 | 0.308*** | 0.318*** |
| (3.15) | (0.24) | (4.52) | (6.89) | |
| T2*G | -0.245 | -0.0833 | -0.1000 | -0.122 |
| (-1.69) | (-1.13) | (-0.72) | (-1.30) | |
| Lnplanting | 0.803*** | -0.134*** | ||
| (33.83) | (-8.31) | |||
| lnmachinery | -0.196*** | -0.216*** | ||
| (-3.78) | (-6.14) | |||
| Lnmulch | 0.135*** | 0.185*** | ||
| (3.92) | (7.92) | |||
| lndisaster | 0.0149 | -0.0715*** | ||
| (0.64) | (-4.52) | |||
| lnfertilizer | 0.184** | 0.212*** | ||
| (2.96) | (5.03) | |||
| lnpesticide | 0.157*** | 0.149*** | ||
| (4.68) | (6.56) | |||
| _cons | 19.17*** | 7.535*** | 4.005*** | 3.328*** |
| (76.78) | (124.67) | (6.88) | (8.44) | |
| N | 324 | 324 | 323 | 323 |
Conclusion
According to the DID model analysis, the result shows that planting acreage, total power of agricultural machinery, mulch application amount, agricultural fertilizer application amount, and pesticide application amount had a significant effect on soybean production per year and per unit but covered disaster areas only had a significant effect on soybean production per unit. But whether or not control variables were added, soybean target price subsidy policy does not solve the problem of soybean production nor affects the issue of soybean reserves fundamentally.
Soybean target price subsidy policy is to guarantee the basic benefits of farmers, improves the middle and lower reach of the soybean production enthusiasm, and improves the market pricing mechanism, but there exists some problems such as lower target price, failing to arouse the enthusiasm of farmers’ production, some unreasonable executing process and Inadequate subsidies. Main reasons that influence the production under the policy of soybean target price: Firstly, the soybean target price level is lower. Target price of soybean was 4800 yuan/ton from 2014 to 2015 in China, but storage price of soybeans is 4600 yuan/ton in 2013. The target price was 4.35% higher than store price. In 2014, the rural consumer price index was 1.8%, actual price growth was just 2.55% excluding price factors. Second, the scope of soybean target price subsidies policy implementation is small. According to China's subsidies policy regulation, it can only be receive legal acreage, to get target price subsidies. Moreover, the target price subsidy policy announced by the government were not in place, farmers knowing of policy is not enough, also the time of subsidies issuance was late, farmers couldn’t get subsidies during the farming, directly affected the enthusiasm of farmers planting soybeans.
Finally, suggestions will be put forward aiming at the problems of soybean target price subsidy policy: firstly, guiding farmers planting arrangement using the real science, improving the enthusiasm of farmers, adjusting the agricultural structure to promote the development of soybean industry. Secondly, exploring the innovated subsidies policy, alleviating the pressure of farmers to achieve the goal of production. Until the present moment, correction on defect in policy innovation reform is needed for government reforms. The government's subsidy policy in some extent alleviated the pressure of farmers, but facing with the international trend of soybean prices decreasing, China's agricultural sector should make agricultural products price format mechanism, ensure production and incomes, promote the development of food and agriculture.
