


Introduction
Materials and Methods
Test Tractor
Test Setup
Signal Acquisition and Preprocessing
Vibration Evaluation Metrics for Seat Mounting
PSD-Based Frequency Characteristic Analysis
Noise Evaluation Metrics
Results and Discussion
Comparison of Frequency-Weighted Vibrations at Seat Mounting Point
PSD-Based Frequency Characteristic Analysis
Noise Characteristics at the Driver’s Ear Position According to Gearshift Conditions
Conclusions
Introduction
Tractors are representative multipurpose machines used not only for agricultural tasks such as tillage, land preparation, and harvesting but also for various livestock operations, including loader work and feed transport. Tractors are operated under various driving conditions depending on the type of implement, workload, and transmission shifting conditions, and operators are continuously exposed to vibration and noise transmitted into the cab during operation (Bilski, 2013; Choi et al., 2023; Khaksar et al., 2013). Such exposure to vibration and noise not only increases operator fatigue and reduces work comfort but can also have negative long-term effects on the operator’s health. Whole-body vibration (WBV) is closely associated with low back pain, and prolonged exposure to vibration has been reported to increase the strain on the musculoskeletal system, including the spine (Bovenzi and Betta, 1994; Griffin, 2012; Mayton et al., 2008). Therefore, in-cab vibration and noise levels must be quantitatively evaluated under various driving conditions to identify the differences in major frequency components for each driving condition.
Hence, various studies have been conducted to quantitatively assess the vibration exposure of tractor operators and identify the characteristics of vibration variations under different work and driving conditions. Han et al. (2022) applied six road surface conditions in a four-post road simulator and quantitatively assessed the WBV of a 100-kW-class tractor operator using the vibration assessment metrics specified in ISO 2631-1 (ISO, 1997). Singh et al. (2021) analyzed the characteristics of vibration exposure based on operating conditions by evaluating the WBV exposure of operators while varying travel speed and implement settings during actual soil tillage operations. Meanwhile, regarding frequency characteristic analysis, Khaksar et al. (2013) analyzed WBVs transmitted to the driver’s seat under plowing, disc tilling, hay baling, and trailer transport conditions using power spectral density (PSD); they reported that, in most operations except for trailer transport, the maximum vibration energy occurred in the low-frequency band of 5 Hz or less. Gao et al. (2024) analyzed the vibrations of a tractor-rotary implement combination in both the time and frequency domains and reported that while the overall vibration level generally increased with increasing travel speed, the magnitude of the main frequency components did not increase uniformly.
Meanwhile, research has also been conducted to reduce the vibrations transmitted to the operator and improve ride comfort. Chung et al. (2017) optimized the spring stiffness and damping coefficient of the cab suspension system to reduce ride vibrations in a 90-kW-class tractor cab. Cutini et al. (2019) proposed a simplified evaluation procedure and metrics for comparing the ride comfort of agricultural tractors. Sun et al. (2024) analyzed the key factors affecting WBV in an operator by developing a dynamic model for a 162 kW-class tractor that included the stiffness and damping characteristics of the seat suspension and tires. These studies demonstrated that the structural characteristics of tractors can significantly influence vibration transmission to the cab and ride comfort. In addition, studies evaluating both noise and vibration have been conducted. Baesso et al. (2014) evaluated noise at the driver’s ear position and seat vibration in tractors with different power ratings, suggesting the need to comprehensively consider noise and vibration in the tractor operating environment.
However, previous studies have primarily focused on evaluating vibration exposure based on road surface and operating conditions, comparing vibration and noise across different tractor models, analyzing the vibration characteristics of tractor-implement combinations, or improving suspension systems. In contrast, research is lacking on the change in seat mounting vibrations and noise at the driver’s ear position when only the gearshift combination is altered under the same engine speed conditions. In particular, because gearshift combinations can affect the excitation characteristics of the drivetrain and the vibration and noise transmission characteristics to the vehicle body and cab, seat mounting vibrations and noise characteristics at the driver’s ear positions under different gearshift combinations should be comprehensively compared. Therefore, in this study, the three-axis vibrations at the seat mounting point and the noise levels at the driver’s left and right ear positions were measured through dynamometer tests conducted in an anechoic chamber. The measurement results were analyzed using vibration indices, PSD, and noise evaluation indices based on the frequency-weighting method specified in ISO 2631-1 (ISO, 1997). Based on this analysis, we sought to quantitatively compare the vibration levels at the seat mounting point and the noise levels and frequency characteristics at the driver’s left and right ear positions under different gearshift combinations.
Materials and Methods
Test Tractor
The tractor used in this test had a rated engine speed of 2,200 rpm and power output of 76.8 kW. The engine was a 4-stroke, 4-cylinder diesel engine, and the powertrain consisted of a clutch, transmission, differential, final reduction gear, and final drive shaft. The driving transmission consisted of a forward/reverse shift, four main speed ranges (1st-4th), four sub-ranges (C/L/M/H), and a Hi/Lo range, whereas the power take-off (PTO) transmission could be shifted among three speeds: 540, 750, and 1,000 rpm. The detailed specifications of the tractor are presented in Table 1, and the tractor’s nominal speeds according to gear combinations are shown in Table 2.
Table 1.
Specifications of the test tractor
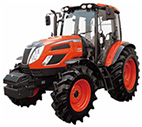
Table 2.
Transmission gear combinations and nominal travel speeds
| Transmission gear combination | Nominal travel speed (km/h) |
| L1 | 2.24 |
| L2 | 2.93 |
| L3 | 3.81 |
| L4 | 4.98 |
| M1 | 6.22 |
| M2 | 8.14 |
| M3 | 10.58 |
| M4 | 13.81 |
| H1 | 17.28 |
| H2 | 22.60 |
| H3 | 29.39 |
| H4 | 38.35 |
Test Setup
In this study, the engine speed was set to the rated speed of 2,200 rpm. To eliminate the influence of the front-wheel drive system and compare differences based on gear combinations, we fixed the drive mode to rear-wheel drive. In addition, the gearshift conditions were classified into neutral and forward driving. For forward driving conditions, the sub-gear ratios L, M, and H were selected to cover typical agricultural work and driving speed ranges, excluding sub-gear ratio C, which is used for extremely low-speed operations. For each sub-gear range, all the main gears (1-4) were applied, resulting in a total of 12 gear combinations. Furthermore, the Hi/Lo selector was fixed to the Hi position for all forward driving conditions to control the influence of its position and maintain consistent test conditions. The gearshift conditions applied in the test are presented in Table 3.
Table 3.
Transmission conditions for noise and vibration tests
| Engine speed | Sub-transmission | Main transmission |
| 2,200 rpm | N | - |
| L | 1, 2, 3, 4 | |
| M | 1, 2, 3, 4 | |
| H | 1, 2, 3, 4 |
The test was conducted in an anechoic chamber at the Korea Institute of Industrial Technology to maintain consistent environmental conditions and minimize the influence of external factors such as background noise. The forward driving conditions were simulated inside the anechoic chamber using a dynamometer. Hence, the rear wheels of the test tractor were positioned on the left and right rollers of the dynamometer, and the transmission was engaged. The power generated by the engine was transmitted to the rear wheels via the transmission and rear-wheel drive system, and the rollers were rotated through tire-roller contact. Consequently, even at the same engine speed, the rotational speed of the rear wheels varied depending on the gear ratio. No separate active drive or braking torque was applied to the rollers during the test, and the rollers rotated passively in response to changes in the rear wheel rotational speed due to tire-roller contact. Therefore, this test did not replicate the traction load of an actual road surface; rather, it compared the vibration and noise characteristics of different gear combinations under free-rotating roller conditions without external braking loads. Hence, vibration and noise signals were measured for 30 s for each gear combination, and the same test was repeated three times. The test setup using a dynamometer and the vibration measurement coordinate system are shown in Figs. 1(a) and 1(b), and the main specifications of the anechoic chamber and dynamometer are presented in Table 4.
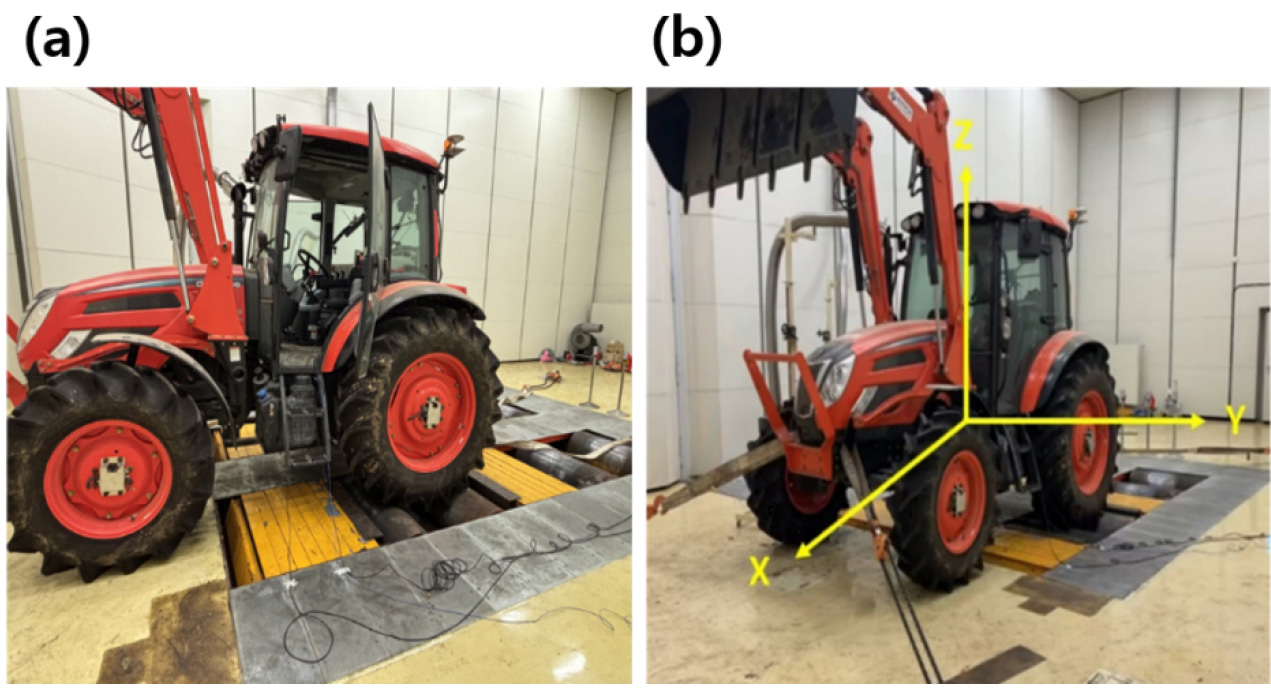
Table 4.
Specifications of the anechoic chamber and chassis dynamometer
The vibration sensor was attached to the seat mounting point where the cab floor connects to the driver’s seat to measure the vibrations transmitted from the tractor body to the driver’s seat. A three-axis accelerometer was used as the measurement sensor. Based on the tractor’s direction of travel, the forward and backward directions were defined as the X-axis, the left and right directions as the Y-axis, and the up and down directions as the Z-axis. Noise measurements were taken while the driver was seated in the normal driving position using two microphones installed at the left and right ear positions, respectively, to measure sound pressure signals. The microphone installation positions were based on the driver measurement positions specified in ISO 5131 (ISO, 2015), and the same positional criteria were applied symmetrically on both sides of the seat center plane. Accordingly, the center of each microphone was positioned 250 ± 20 mm to the left and right of the seat center plane, respectively, and 700 ± 20 mm upward and 100 ± 20 mm forward from the seat index point (SIP). The microphone axes were kept horizontal, and the diaphragms were installed facing forward. The installation locations of the vibration and noise sensors are shown in Fig. 2, and the main specifications of each sensor are shown in Table 5.
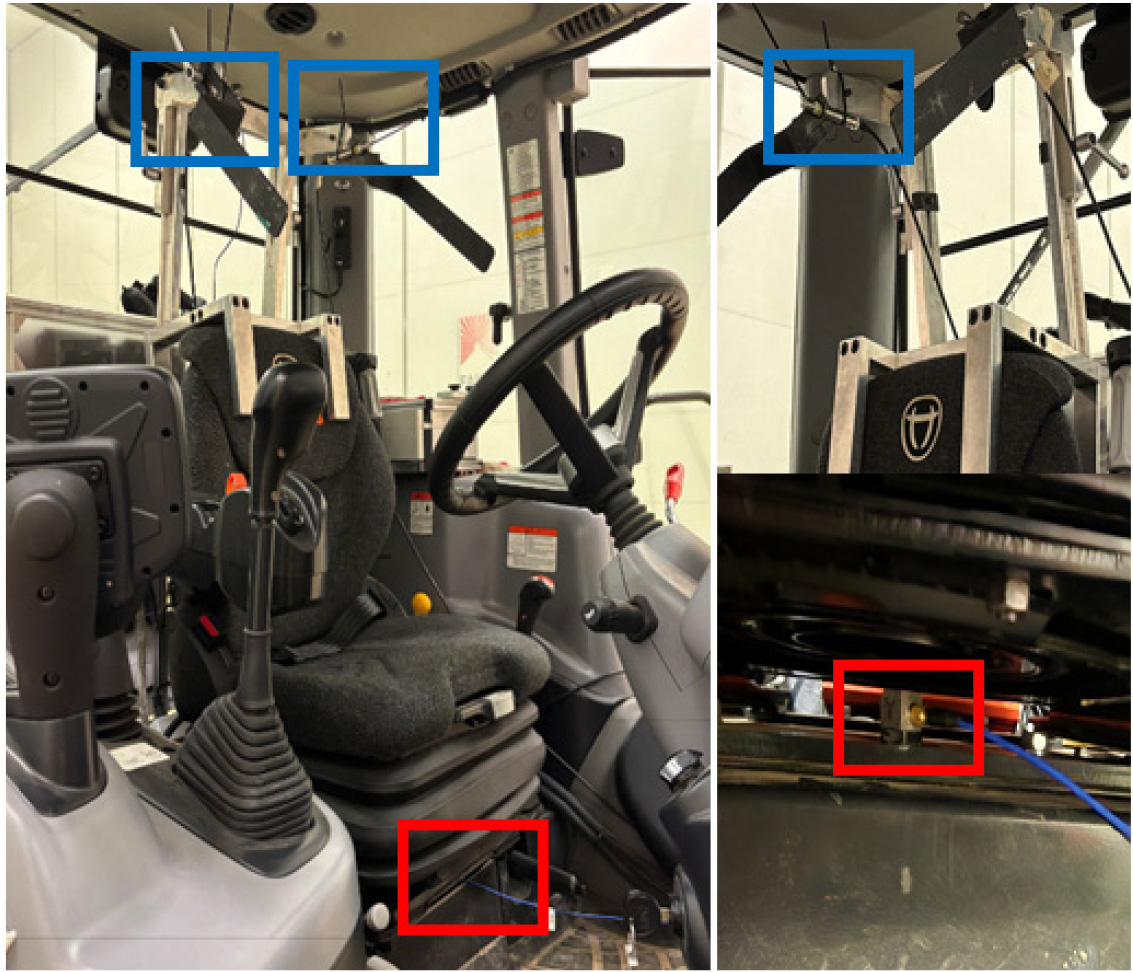
Table 5.
Specifications of sensors
Signal Acquisition and Preprocessing
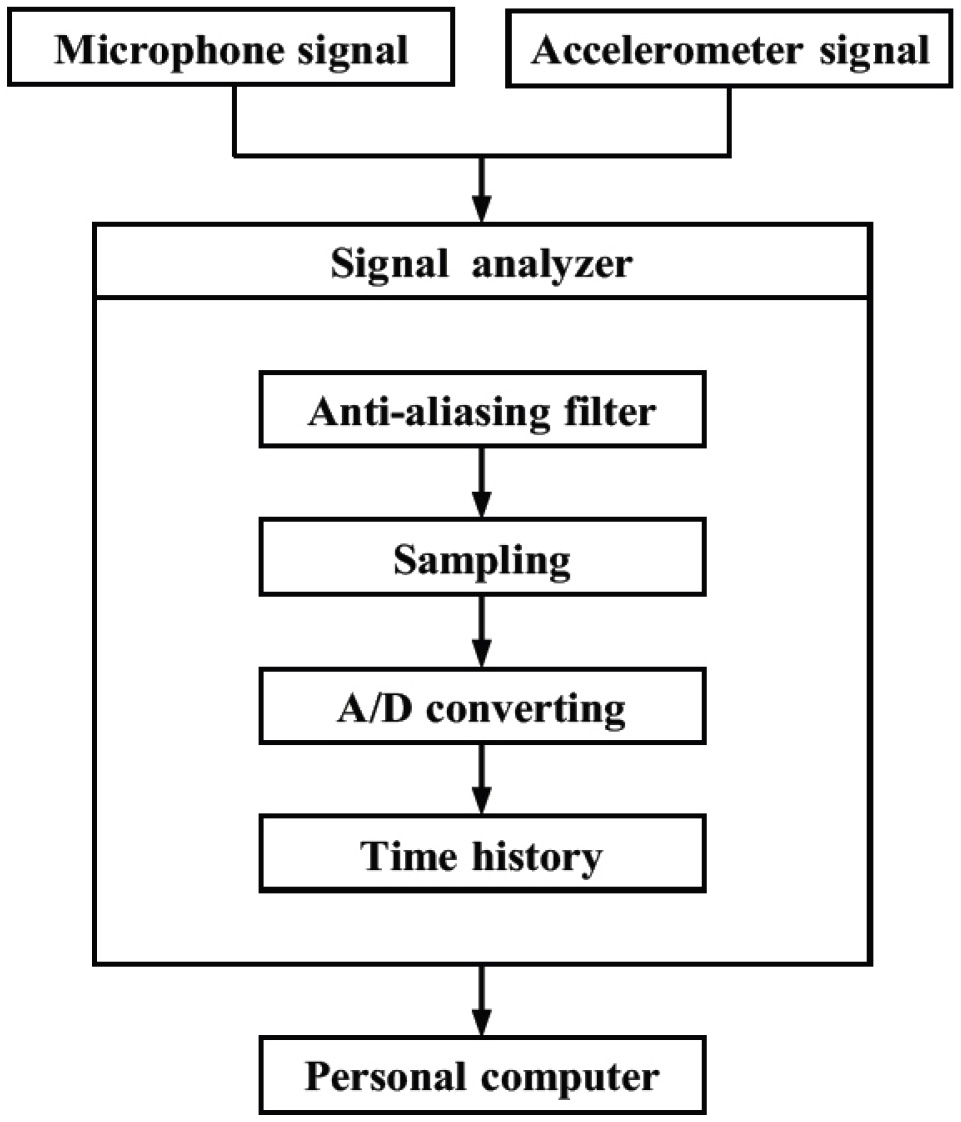
Vibration and noise signals were acquired simultaneously using Simcenter SCADAS Mobile (Siemens Digital Industries Software, USA), and the sampling frequencies for the vibration and noise signals were set to 1,024 Hz and 51.2 kHz, respectively. Each signal passed through an anti-aliasing filter within the signal analyzer to limit high-frequency components exceeding the sampling bandwidth; they were then stored as time-history data through sampling and analog-to-digital conversion. The entire signal acquisition process is shown in Fig. 3.
Vibration Evaluation Metrics for Seat Mounting
The vibration signal was limited to the 0.5-80 Hz band, considering the scope of application of the frequency weighting method specified in ISO 2631-1 (ISO, 1997). Additionally, the frequency-weighting filter specified in ISO 2631-1 (ISO, 1997) was applied to compare the vibration characteristics of the seat mounting assembly along each axis under different gearshift conditions. The frequency-weighting filters have been designed to reflect the frequency sensitivity of the human body in different directions. represents weighting functions applied to horizontal vibrations in the forward-backward direction (X-axis) and left-right direction (Y-axis), respectively, whereas is a weighting function applied to vertical vibrations in the up-down direction (Z-axis). Eq. (1) presents the process of calculating the frequency-weighted acceleration history by applying axis-specific weighting functions to the frequency components of the raw acceleration signal, as well as the axis-specific application relationships shown in and . Subsequently, the axis-specific weighted root-mean-square (RMS) accelerations , , and were calculated from the frequency-weighted acceleration signals for each axis using Eq. (2). Here, the axis- specific weighted RMS acceleration is an indicator that reflects the vibration sensitivity of the human body as a function of frequency and represents the effective value of the frequency-weighted acceleration over the measurement period.
where, = frequency-weighted acceleration time history in axis i (m/s2)
= Fourier transform of the original acceleration signal in axis I
= frequency-weighting function applied to axis I
= frequency-weighting function for the horizontal X- and Y-axis vibrations
= frequency-weighting function for the vertical Z-axis vibration
= inverse Fourier transform
i = axis direction (x, y, or z)
f = frequency (Hz)
where, = frequency-weighted RMS acceleration along i-axis (m/s2)
= frequency-weighted acceleration time history along the i-axis (m/s2)
T = measurement duration (s)
i = measurement axis (x, y, or z)
In addition, the vibration total value was calculated to comprehensively evaluate the vibration amplitudes in the X, Y, and Z directions. The vibration total value was calculated using the weighted RMS acceleration along the three orthogonal axes using the formula for the vibration total value presented in ISO 2631-1 (ISO, 1997), as shown in Eq. (3). This value represents the vibration components of each axis as a single composite value and was used to comprehensively compare the vibration levels at the seat mounting point under different gearshift conditions.
where, = vibration total value (m/s2)
, , = frequency-weighted RMS acceleration in the x-, y-, and z-directions (m/s2)
, , = multiplying factors for the x-, y-, and z-directions
In this study, , , and were all set to 1.0 to combine and compare the vibration magnitudes measured at the seat mounting point along each axis using a uniform standard. Meanwhile, to quantitatively compare the relative influence of each axis component on the total vibration value, this study defined the relative contribution rate for each axis as the proportion that the squared weighted RMS acceleration component of each axis accounts for in . This is because the total vibration value is calculated as the square root of the sum of the squares of the weighted RMS acceleration for each axis; the objective is to express the relative contribution of each axis as a percentage of the total sum of squares. The relative contribution in the direction of axis was calculated as follows:
where, = relative contribution of axis i to the total vibration value (%)
= frequency-weighted RMS acceleration in axis i (m/s2)
= total vibration value (m/s2)
= multiplying factor for axis i
PSD-Based Frequency Characteristic Analysis
The PSD of the acceleration signal was analyzed to compare the distribution of vibration energy and dominant frequency bands under different gearshift conditions. The PSD is an indicator that shows the distribution of the mean-square value of a vibration signal across frequency bands, enabling a quantitative assessment of the degree to which vibration energy is concentrated in a specific frequency band. The PSD was estimated using the Welch average periodogram method via the pwelch function in MATLAB R2024b (MathWorks, Natick, MA, USA) and the application of a 4-s-long Hann window with 50% overlap. The frequency resolution was approximately 0.25 Hz.
Noise Evaluation Metrics
To evaluate the noise levels at the driver’s ear position according to gearshift combinations, we calculated the A-weighted equivalent noise level () from the noise signals collected at each measurement interval. A-weighting is a frequency-weighting method that reflects human auditory sensitivity across different frequencies. In this study, was used as a representative indicator of the overall noise level at the driver’s ear position under each gearshift condition. Here, the reference sound pressure for calculating the sound pressure level was set to 20 µPa, which is the reference sound pressure in air. The A-weighted equivalent noise level was calculated as shown in Equation (5). Here, the effective measurement frequency range of the noise signal was set to 3.75 Hz-20 kHz, considering the frequency response range of the microphone used. This range includes the typical human audible frequency range of 20 Hz-20 kHz.
Furthermore, to compare the calculated with noise exposure standards for work environments for reference, Table 6 presents the permissible noise exposure limits of the U.S. Occupational Safety and Health Administration (OSHA, n.d.). However, because the OSHA standards are intended to evaluate cumulative noise exposure over a workday, the comparison with the values measured for individual test intervals in this study was not intended to determine workers' actual daily noise exposure or whether the permissible limits were exceeded; rather, it was used only as a reference to identify the OSHA permissible exposure-time range corresponding to the measured noise levels.
where, = A-weighted equivalent sound pressure level (dB(A))
= A-weighted sound pressure as a function of time (Pa)
= reference sound pressure (Pa)
T = measurement duration (s)
Results and Discussion
Comparison of Frequency-Weighted Vibrations at Seat Mounting Point
The vibration characteristics of the seat mounting at a rated engine speed of 2,200 rpm were compared under different gear combinations. The evaluation metrics used were the frequency-weighted RMS acceleration along the X-, Y-, and Z-axes (, , ) and the total vibration value (); each result is presented as the mean ± standard deviation of three repeated measurements.
Fig. 4(a)-(d) show the frequency-weighted RMS acceleration along each axis (, , ) and the total vibration value () for each gearshift combination. The X-axis (forward/reverse) weighted RMS acceleration () ranged from 0.104 to 0.403 m/s2 under forward driving conditions and was lowest at 0.026 ± 0.002 m/s2 under neutral (N) conditions. Among the forward driving conditions, M3 had the highest value at 0.403 ± 0.157 m/s2, whereas L4 and H1 also showed relatively high values at 0.355 ± 0.034 m/s2 and 0.286 ± 0.011 m/s2, respectively. This indicates that X-axis vibration did not increase consistently with an increasing main-gear stage but was relatively high in certain gear combinations. The weighted RMS acceleration along the Y-axis (left and right) () ranged from 0.099 to 0.650 m/s2 under forward driving conditions and was 0.046 ± 0.001 m/s2 in neutral. In M3 and H1, the values were high at 0.650 ± 0.338 and 0.630 ± 0.033 m/s2, respectively, whereas L4 and M4 also showed relatively high values of 0.406 ± 0.030 m/s2 and 0.378 ± 0.068 m/s2, respectively. In particular, in M3 and H1, the Y-axis acceleration was higher than that of the X- and Z-axes, indicating that left-right vibration components were dominant. The Z-axis (up-down) weighted RMS acceleration () ranged from 0.268 to 1.266 m/s2 under forward driving conditions and 0.283 ± 0.003 m/s2 under neutral conditions, which was higher than the X-axis and Y-axis accelerations under the same conditions. Among the forward driving conditions, the value was highest at H4 at 1.266 ± 0.069 m/s2 and was also relatively high at H3, H1, and H2 at 0.618 ± 0.026, 0.529 ± 0.016, and 0.517 ± 0.011 m/s2, respectively. These results indicate that the Z-axis component was generally dominant compared with the X- and Y-axis components, and vertical vibrations were relatively significant, particularly under certain H-stage conditions. When the results for each axis were synthesized, the Z-axis component was the highest under most gearshift conditions; however, under the L4, M3, and H1 conditions, the Y-axis component was the highest, confirming that the dominant vibration direction varied depending on the gearshift combination. Furthermore, a comparison of the X-axis and Y-axis components did not reveal a consistent trend of increasing vibration with an increase in the main-gear stage; instead, relatively high values were observed under specific gearshift combinations. These results demonstrate that even under the same engine speed conditions, the vibration level and dominant vibration direction at the seat mounting point can vary depending on the gearshift combination. These differences are considered to be related to changes in the dynamic and vibration transmission characteristics of the drivetrain depending on the gear combination. Therefore, in the vibration evaluation of tractors, both engine speed and gearshift combinations must be considered as important operating variables.
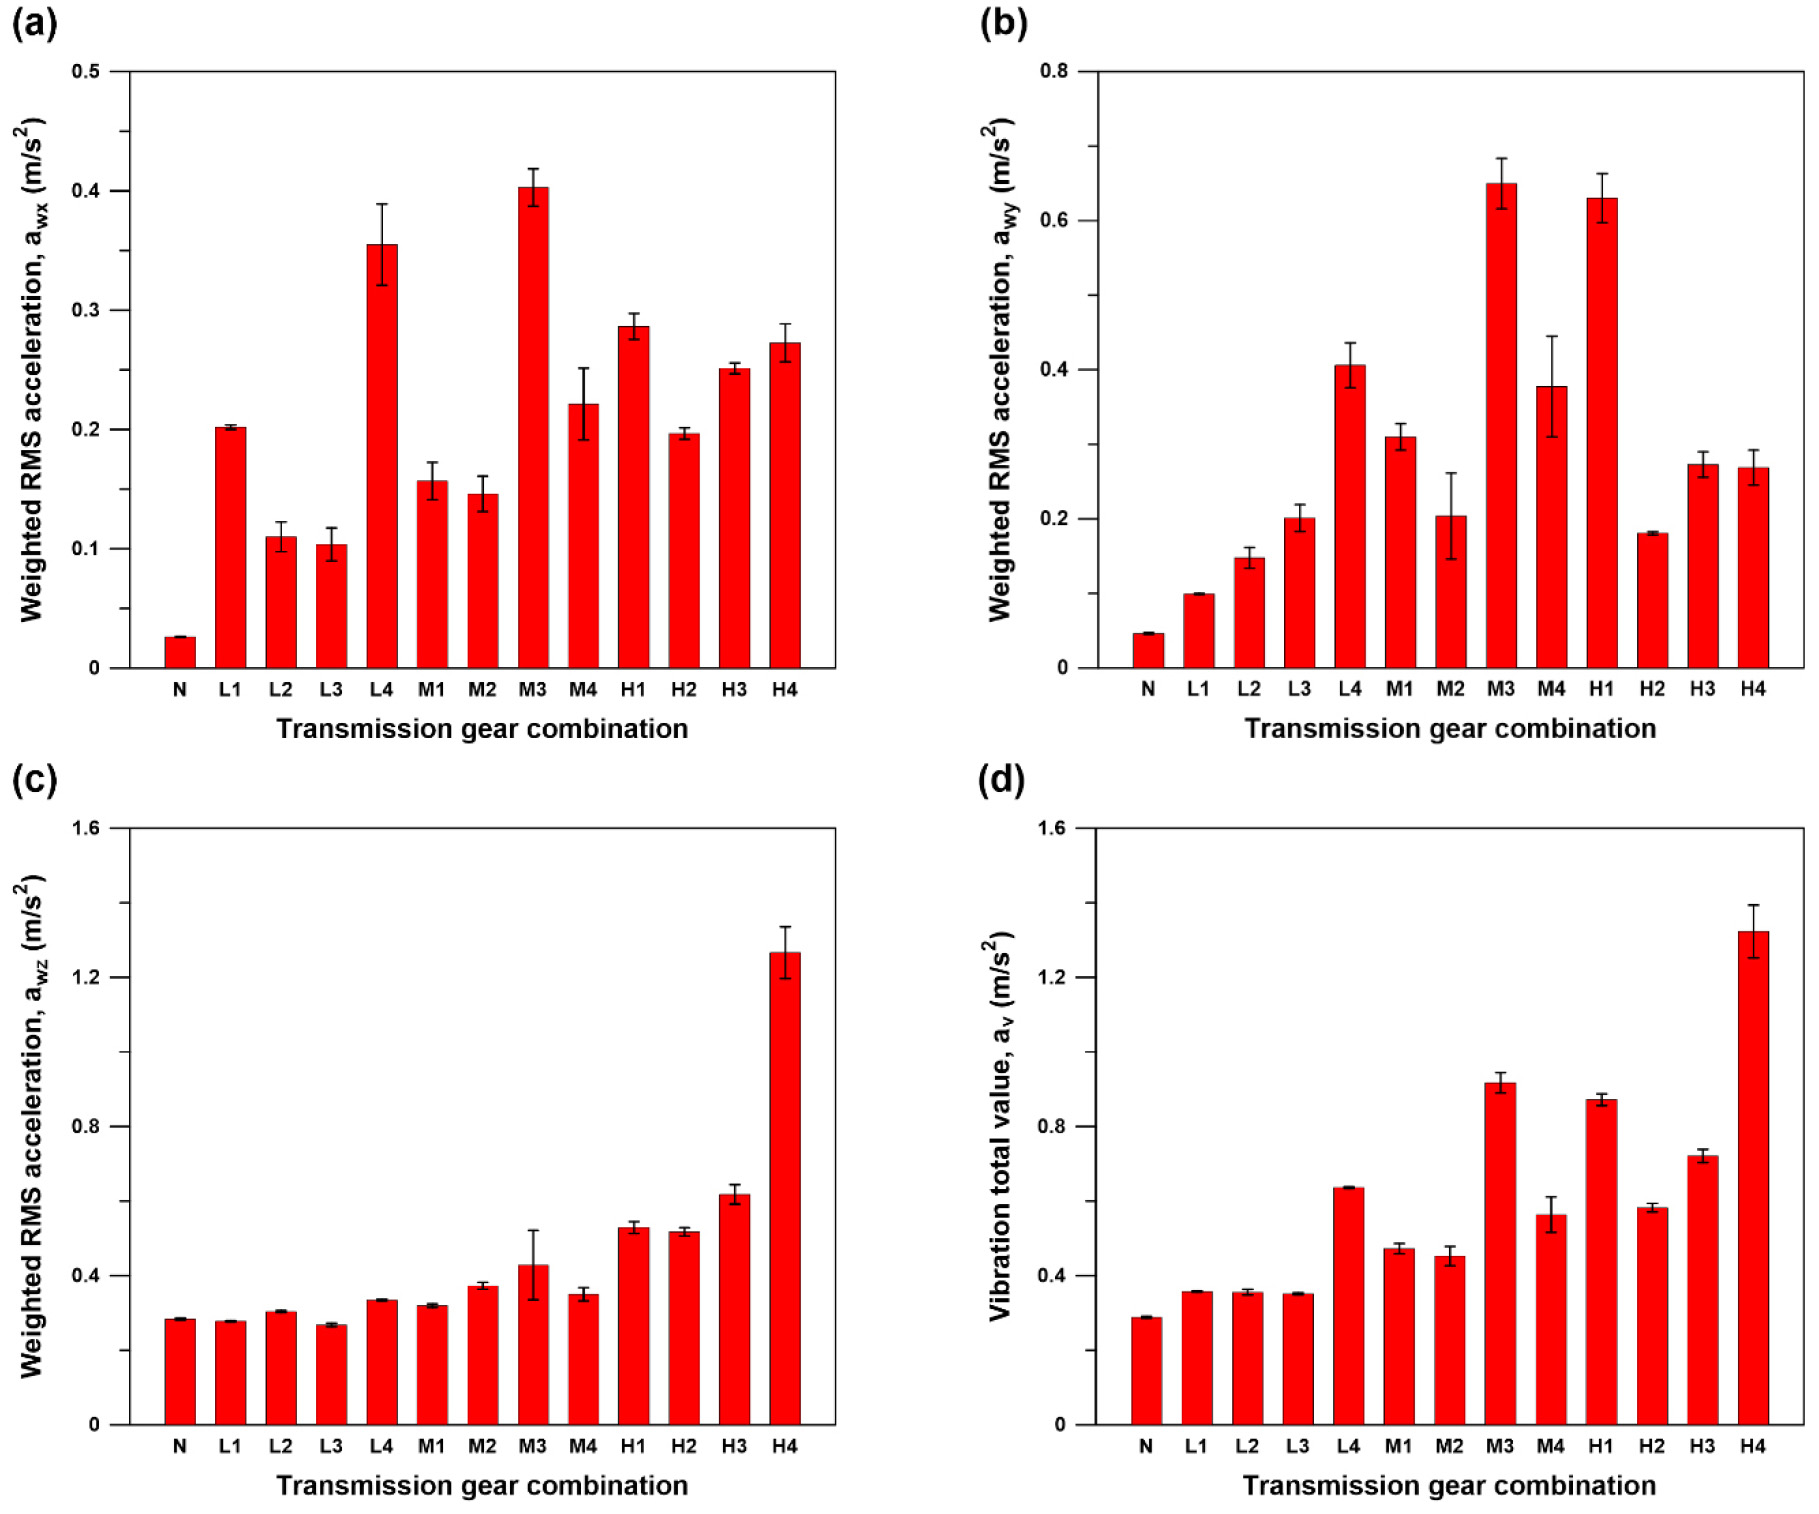
An analysis of revealed that it was the lowest at 0.288 ± 0.003 m/s2 in neutral, whereas under forward driving conditions, it ranged from 0.351 to 1.323 m/s2. Among the gear combinations, was highest under the H4 condition at 1.323 ± 0.071 m/s2, followed by M3 (0.917 ± 0.027 m/s2), H1 (0.872 ± 0.016 m/s2), and H3 (0.721 ± 0.018 m/s2). In contrast, among the driving conditions, L3 had a value of 0.351 ± 0.003 m/s2, which was the lowest among the forward driving conditions and was similar to those of L1 (0.357 ± 0.002 m/s2) and L2 (0.356 ± 0.008 m/s2). The maximum for H4 was approximately 3.77 times higher than the minimum value among the driving conditions (L3) and approximately 4.59 times higher than that under the neutral condition, confirming that at the seat mounting point varies significantly depending on the gearshift combination, even at the same engine speed. A comparison of changes across sub-gears within each gear range showed that in the L range, L1-L3 were 0.351-0.357 m/s2 but increased to 0.636±0.003 m/s2 in L4. In the M range, M3 was relatively higher than M1, M2, and M4, whereas in the H range, the value decreased from H1 to H2 and then increased again in H3 and H4. These results indicate that does not increase consistently with an increase in the main speed stage but rather exhibits characteristics that vary depending on specific combinations of the auxiliary speed stage and the main speed stage.
To test the statistical significance of these differences, we performed a one-way analysis of variance (ANOVA) on the axis-wise frequency-weighted RMS acceleration and total vibration values using three replicate measurements for each condition. In addition, for the 12 forward driving conditions (excluding neutral), a two-way ANOVA was performed with sub-gears (L, M, and H) and main gears (1-4) as fixed factors to test the main effects and interactions of each factor. The statistical significance level was set at p < 0.05, and the contribution rate of each condition factor was calculated as the ratio of the sum of squares for that factor to the total sum of squares, including the error term. The results of the one-way ANOVA showed that the gearshift condition had a significant effect on the frequency-weighted RMS acceleration and total vibration values along the X-, Y-, and Z-axes (p < 0.001). This demonstrates that, even at the same engine speed, the vibration level at the seat mounting point varies significantly depending on the gearshift combination. A two-way ANOVA performed on forward driving conditions revealed that, on the X-axis, the main gear ratio and interaction between the sub- and main gear ratios had significant effects (all p < 0.001), whereas the main effect of the sub-gear ratio was not significant (p = 0.063). On the Y-axis, the sub-gear (p = 0.008), main gear (p = 0.010), and interaction between the two factors (p < 0.001) were all significant. On the Z-axis and for the total vibration value, the sub-shift, main shift, and interaction between the two factors all had significant effects (p < 0.001). A comparison of the contribution rates by condition factor revealed that, on the X- and Y-axes, the contribution rate of the sub-gearshift and main-gearshift interaction was highest at 47.89% and 44.18%, respectively. In contrast, for both the Z-axis and vibration total value, the range gear had the highest contribution rates, at 51.70% and 40.91%, respectively. These results showed that the combination of secondary gearshift and primary gearshift had a relatively large effect on the horizontal vibrations along the X- and Y-axes, whereas the influence of the secondary gearshift was relatively greater on the vertical vibrations along the Z-axis and the total vibration value. The detailed results of the two-way ANOVA and the contribution rates by condition factor are presented in Table 7.
Table 7.
Two-way ANOVA results and percentage contributions of transmission factors to frequency-weighted vibration indices
Meanwhile, to compare the relative influences of each vibration direction constituting the total vibration value, we analyzed the relative contribution rates by axis. The relative contribution rates by axis were calculated from each repeated measurement and presented as averages by condition. Summarizing the relative contribution rates by axis, in 9 of the 12 drive conditions, the Z-axis had the highest contribution rate, indicating that, under most conditions, the up-and-down components contributed the most to the total vibration value. In particular, for H4, the Z-axis contribution was the most prominent at approximately 91.5%, whereas the X-axis and Y-axis contributions were approximately 4.7% and 3.8%, respectively. In contrast, in L4, M3, and H1, the Y-axis contribution was the highest, indicating that the influence of left-right vibrations becomes relatively greater under specific gearshift combinations. The Y-axis contribution rates for L4 and H1 were approximately 40.7% and 52.2%, respectively, whereas the X-axis contribution rates were approximately 31.1% and 10.8%, respectively. In particular, the X-axis contribution rate was also relatively high in L4.
In summary, even at the same engine speed, the vibration level at the seat mounting point and the dominant vibration direction varied significantly depending on the gearshift combination. In particular, horizontal vibrations were strongly influenced by the interaction between the range and main gears, whereas the range gear had a relatively greater influence on vertical vibrations and the total vibration value. Therefore, in the vibration evaluation of tractors, both the engine speed and gear combinations must be considered as important operating variables.
PSD-Based Frequency Characteristic Analysis
As discussed earlier, seat-transmitted vibration did not increase consistently with increasing main-gear stage but tended to be relatively high under certain gear combinations. This indicates the need to identify at which frequency components the vibration differences resulting from gear combinations occur. Accordingly, based on the results of the ISO 2631-1 (ISO, 1997) frequency-weighted vibration indices from the previous section, we selected L4, M3, H1, and H4—which encompassed the L, M, and H sub-gear ranges and exhibited relatively high total vibration values—as representative comparison conditions. For the selected conditions, the PSDs of the X-, Y-, and Z-axes were compared to identify the dominant frequencies and energy concentration bands, and the frequency characteristics of conditions where seat-transmitted vibration was relatively high were analyzed.
Fig. 5(a)-(d) show the PSDs of the X-axis (forward-backward) vibration under the gearshift conditions L4, M3, H1, and H4. The analysis revealed that both L4 and M3 exhibited a dominant component at approximately 0.98 Hz, indicating a frequency response dominated by low-frequency components. In particular, for M3, in addition to the dominant component at 0.98 Hz, a secondary component was identified at approximately 2 Hz, resulting in a relatively more complex frequency distribution than that of L4. In H1, the dominant component appeared at approximately 1.66 Hz, and a secondary component was identified at approximately 3 Hz. In H4, the dominant component appeared at approximately 3.61 Hz, and the PSD peak magnitude was also larger than in the other representative conditions. Therefore, when comparing the four selected conditions, the dominant frequency on the X-axis exhibited a trend of shifting toward higher frequency ranges from 0.98 to 3.61 Hz, with a particularly pronounced increase in the 3.61 Hz component in H4.
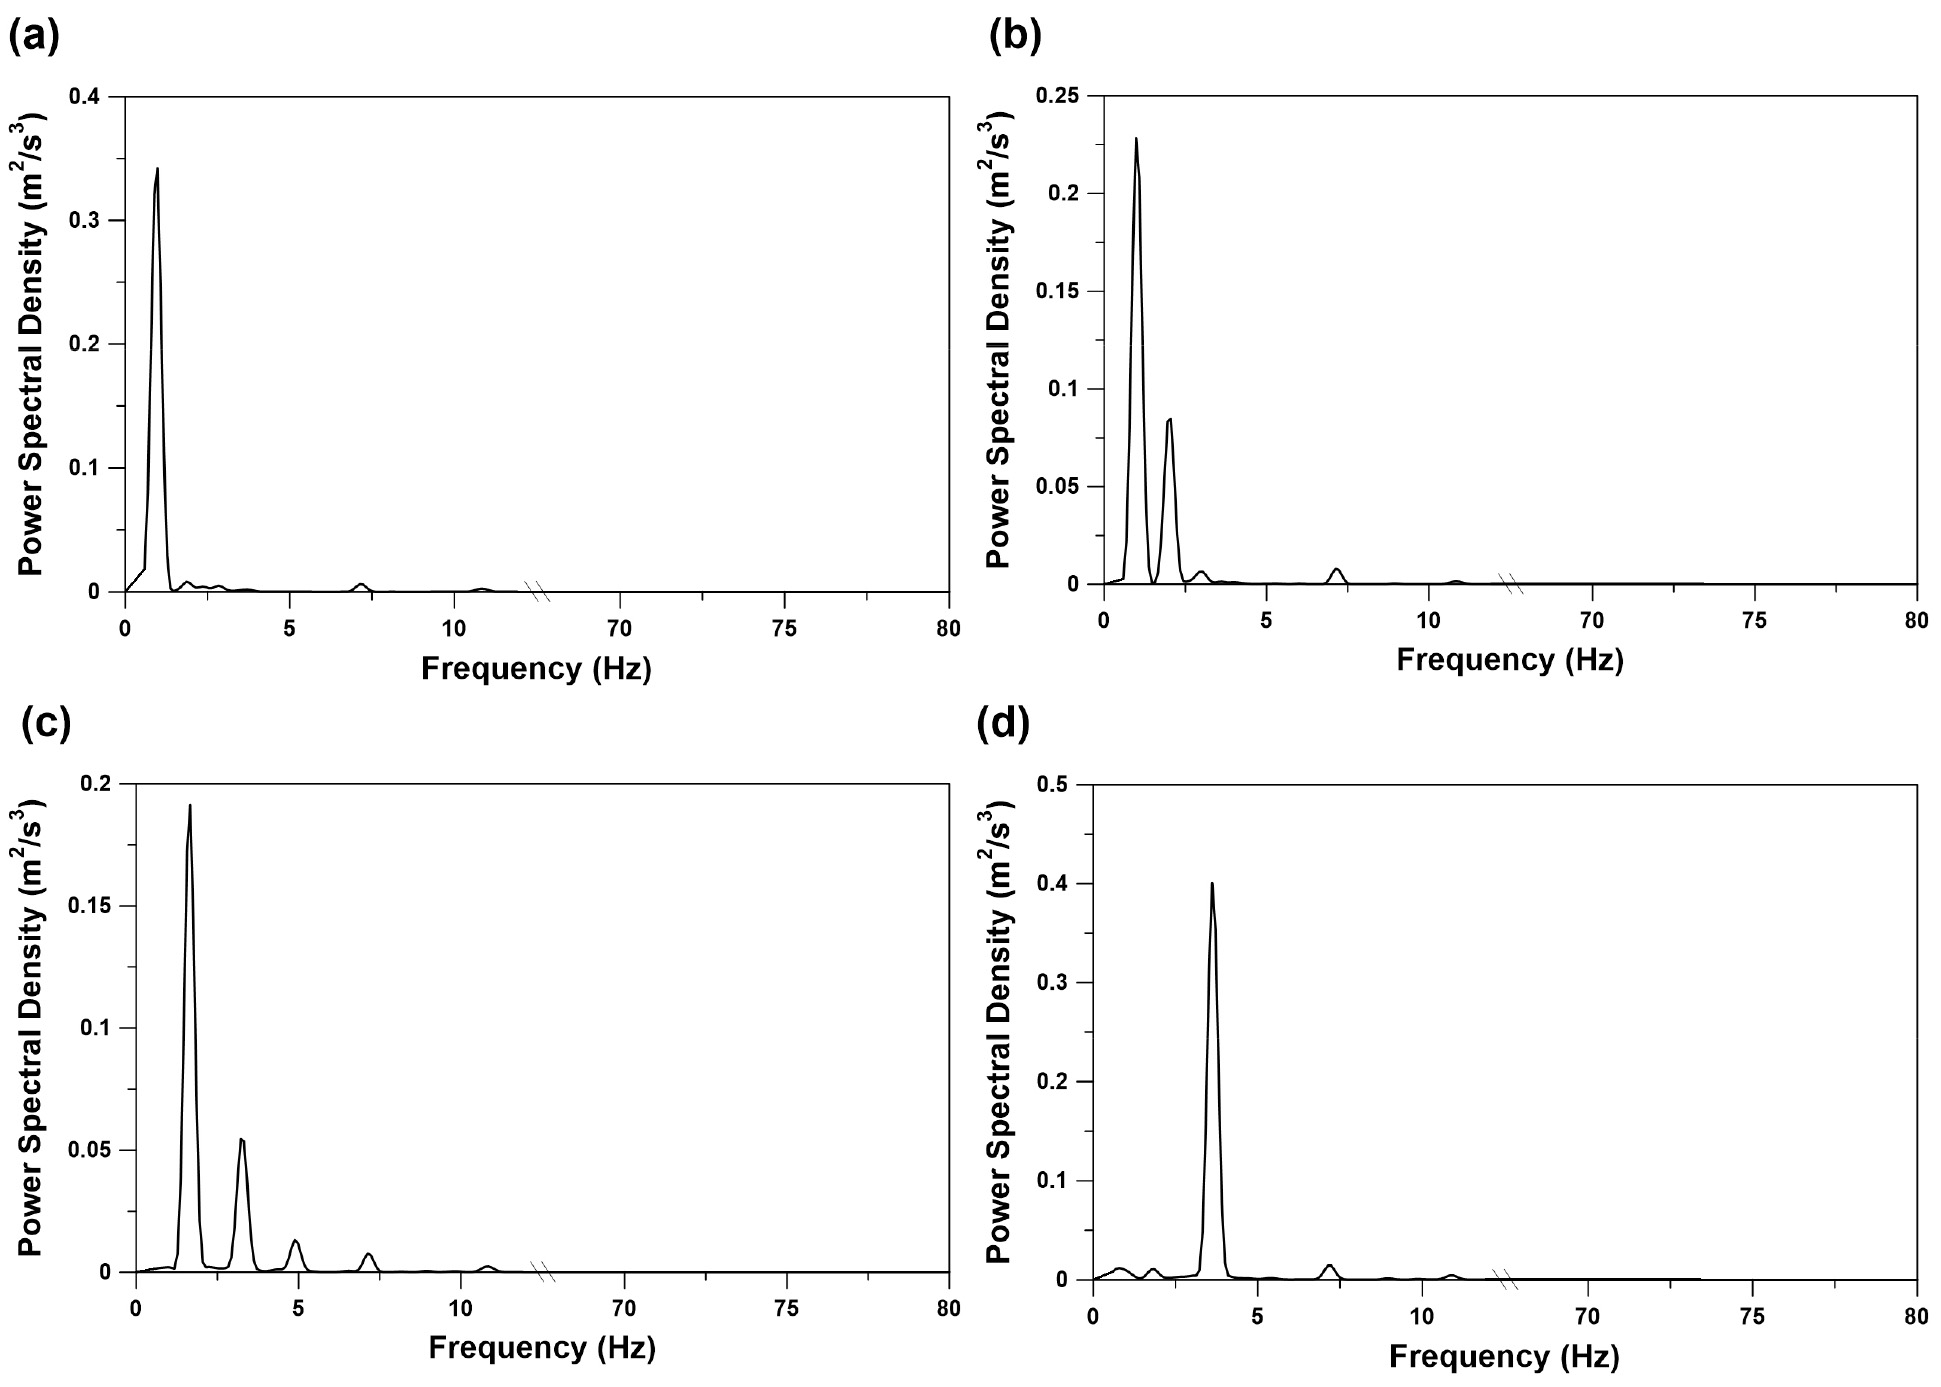
Fig. 6(a)-(d) show the PSDs of the Y-axis (left-right) vibration measured under the gearshift conditions L4, M3, H1, and H4. The analysis revealed that, similar to the X-axis, a dominant component appeared at approximately 0.98 Hz in both L4 and M3, whereas a secondary component at approximately 2 Hz was also identified in M3. In H1, the dominant component appeared at approximately 1.66 Hz, and the peak amplitude was larger than that observed in L4 and M3. In H4, the dominant component appeared at approximately 3.61 Hz, and secondary components were also identified at approximately 0.98, 8, and 10-12 Hz, showing a distribution of vibration components across a wider frequency range than in other conditions. Therefore, similar to the X-axis, the Y-axis also exhibited a trend in which the dominant frequency among the representative conditions shifted toward higher frequency ranges. In particular, in H4, several secondary components appeared together, resulting in vibration energy distributed over a wider frequency range than in other conditions.
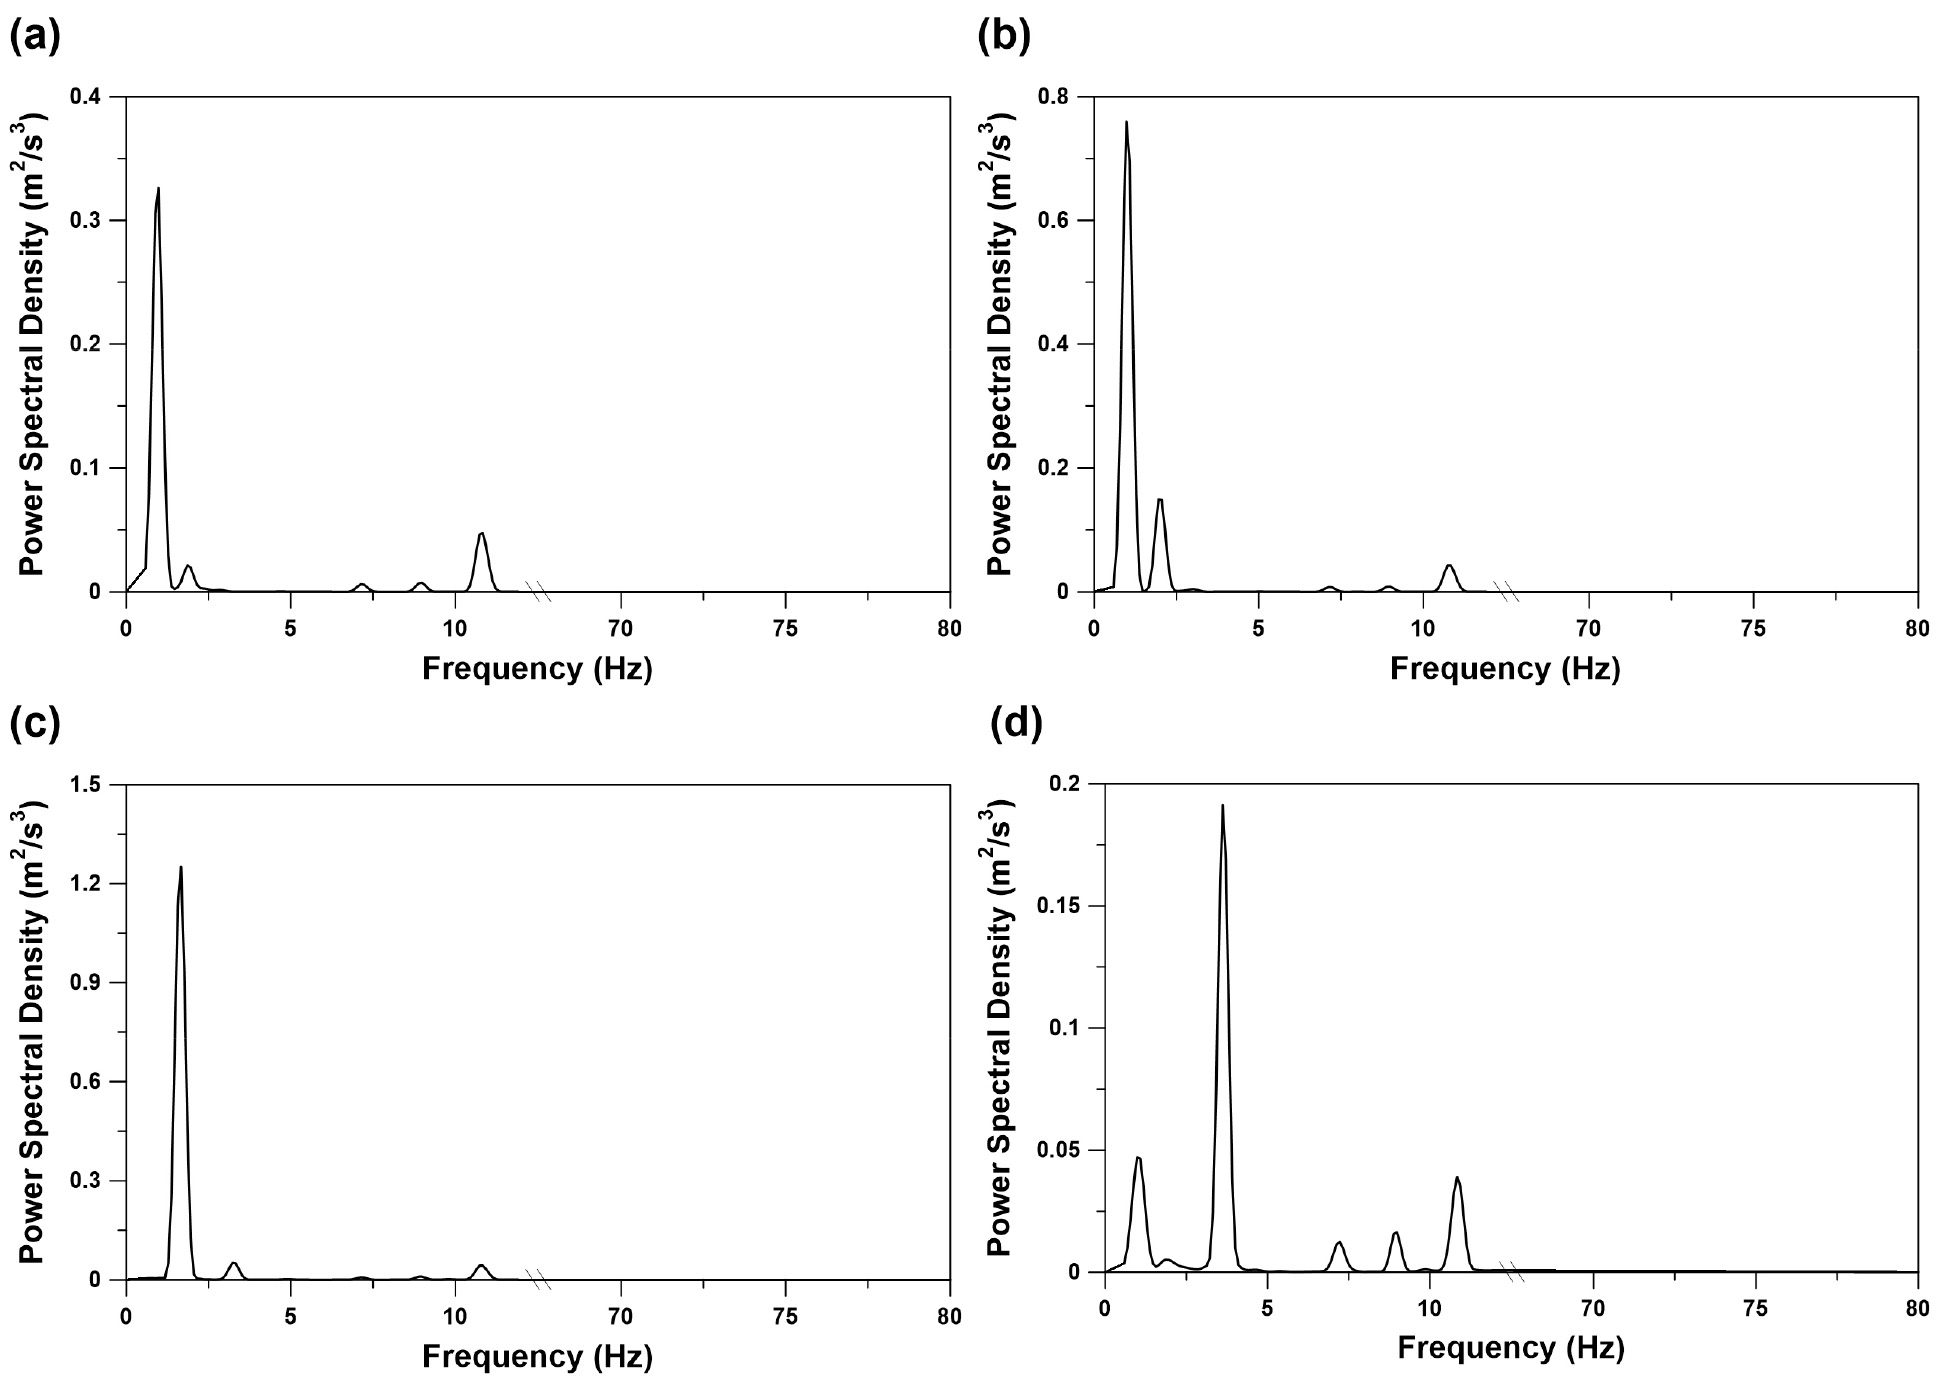
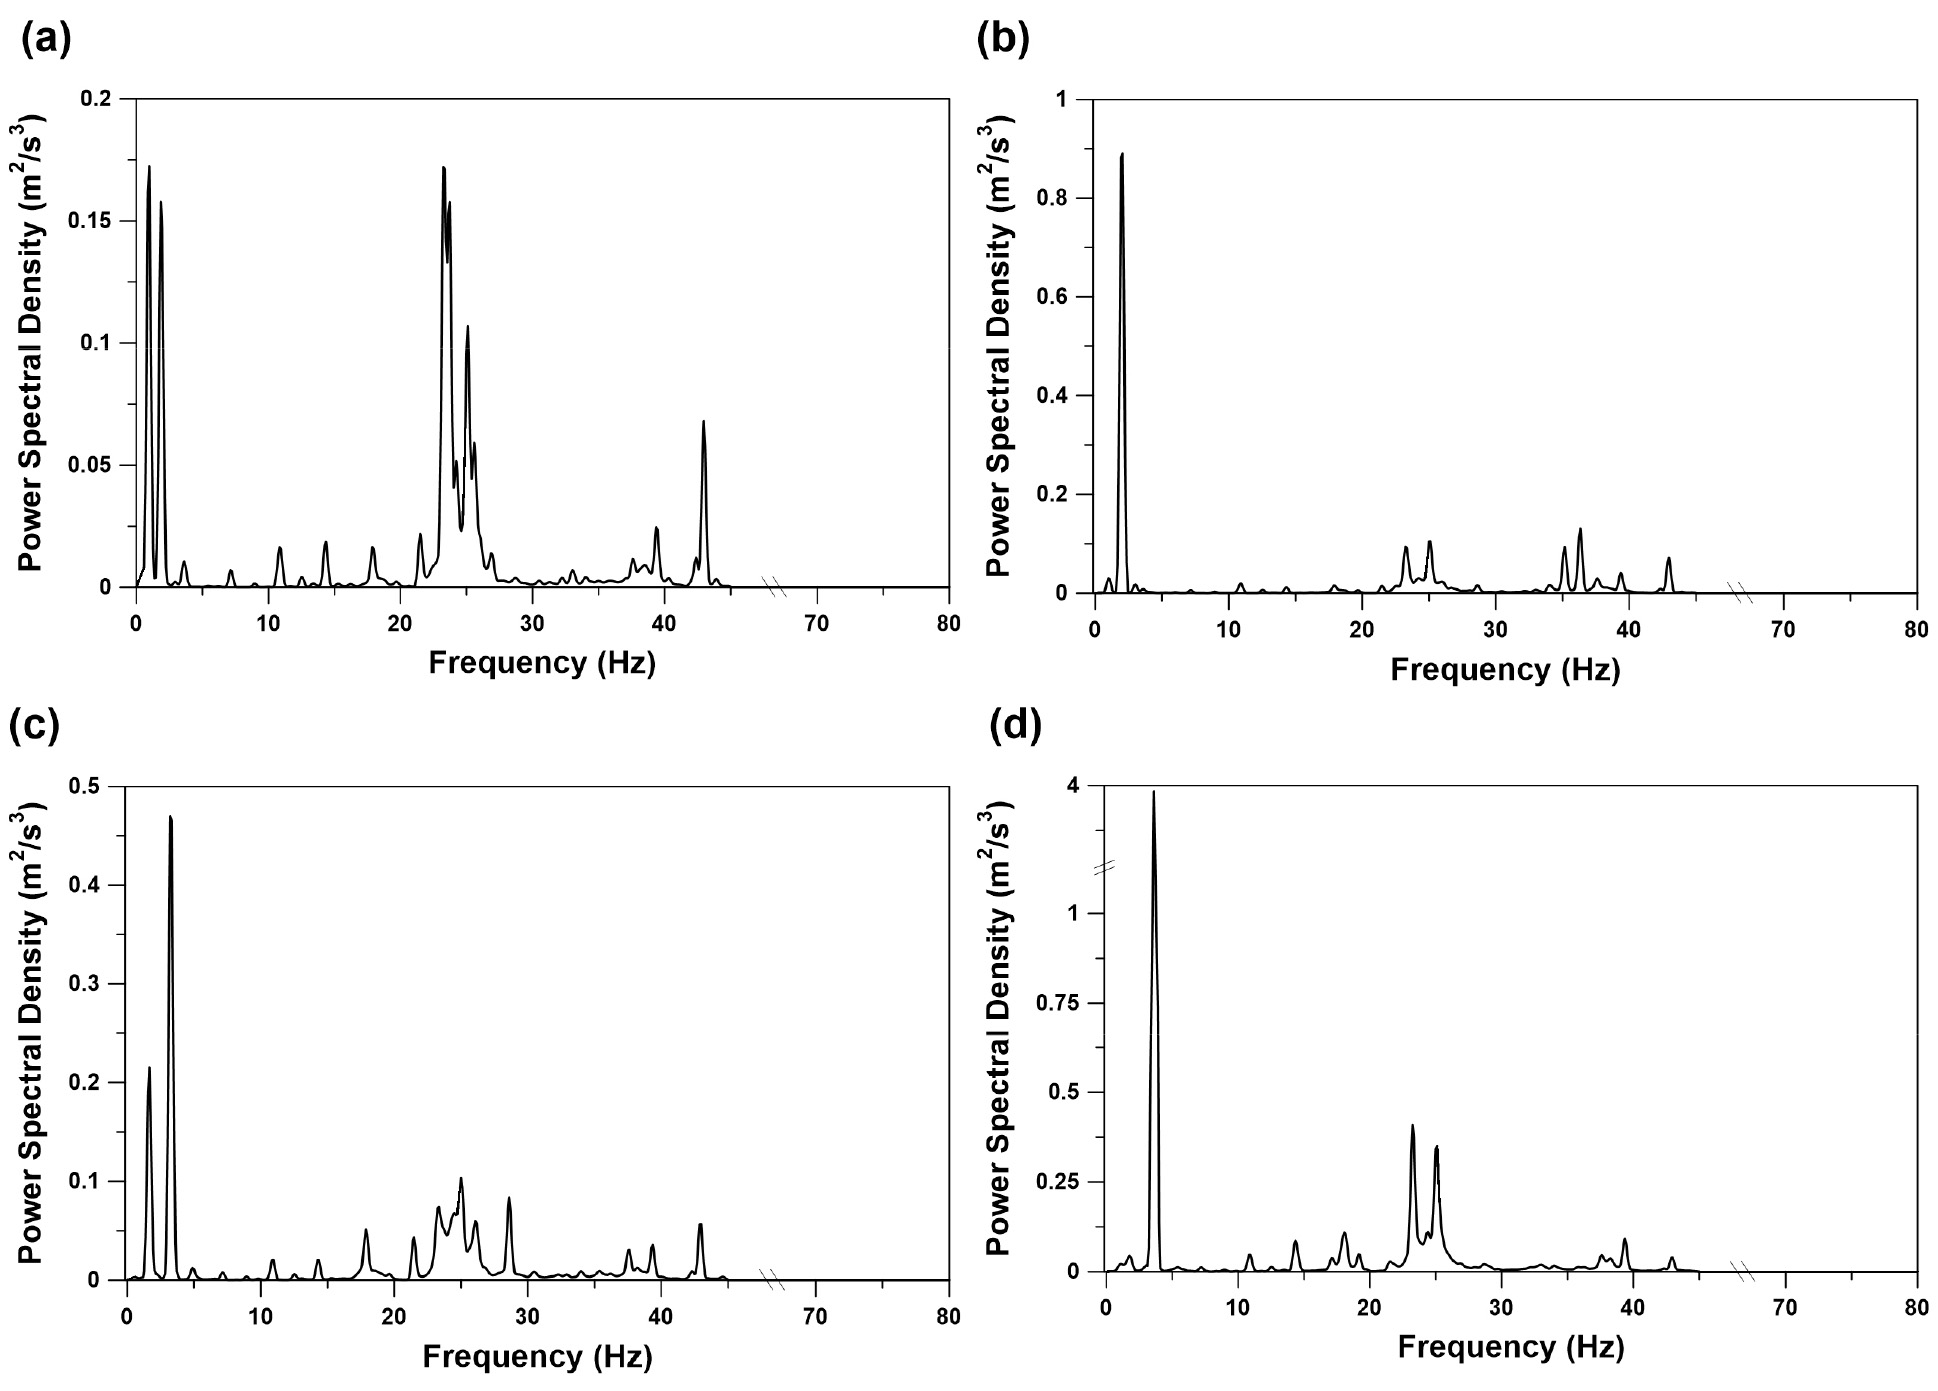
Fig. 7(a)-(d) show the PSDs of the Z-axis (upward and downward) vibrations measured under the shift conditions L4, M3, H1, and H4. The analysis revealed that in L4, the dominant component appeared at approximately 0.98 Hz, and relatively large secondary components were also identified near 23-25 and 42 Hz. In M3, the dominant component appeared at approximately 2.05 Hz, and secondary components were identified at approximately 23-25, 35-37, and 42 Hz. In H1, the dominant component appeared at approximately 3.22 Hz, accompanied by continuous peaks around 23-28 Hz and a secondary component around 39-42 Hz. In H4, a dominant component significantly larger than in the other representative conditions appeared at approximately 3.61 Hz, and a relatively distinct secondary component was also identified at 23-25 Hz. Therefore, when comparing the four selected conditions, the dominant frequency on the Z-axis showed a trend of shifting from approximately 0.98 Hz to higher frequency ranges of 2.05, 3.22, and 3.61 Hz. Furthermore, on the Z-axis, a secondary component around 23-25 Hz was commonly observed in all representative conditions, and under some conditions, an additional secondary component appeared around 35-42 Hz, showing a relatively more complex spectral structure than the X- and Y-axes.
When the results from the three axes were synthesized, a common pattern emerged in which the dominant frequency shifted toward higher frequency ranges as the gearshift combinations changed across the selected representative conditions. In particular, for H4, the dominant component appeared at approximately 3.61 Hz on all three axes, and the PSD peak on the Z-axis was significantly larger than those in other representative conditions. This suggested that the previously confirmed high total vibration value for H4 and the high relative contribution ratio of the Z-axis were closely related to the prominent upward and downward vibration components primarily around 3.61 Hz. Furthermore, on the Z-axis, a secondary component around 23-25 Hz was commonly observed in all representative conditions, and in some conditions, additional secondary components appeared around 35-42 Hz, indicating a relatively more complex spectral structure compared with the X- and Y-axes. These results demonstrate that the primary vibration components generated or transmitted in the drivetrain can vary depending on the gear combination. However, because this study did not directly analyze individual excitation sources or vibration transmission paths, limitations existed in identifying the specific causes of each frequency component. In the future, the generation and transmission mechanisms of the main frequency components for each gearshift combination should be more quantitatively elucidated through dynamic analysis of the drivetrain or transfer path analysis.
Noise Characteristics at the Driver’s Ear Position According to Gearshift Conditions
Fig. 8 shows the A-weighted equivalent noise level () at the driver’s ear position under each gearshift condition. The levels ranged from 79.87 to 92.76 dB(A) at the right ear and from 78.29 to 91.30 dB(A) at the left ear, confirming that the noise levels to which the driver is exposed vary significantly depending on the gearshift combination. Furthermore, under most conditions, the noise level at the right ear position was approximately 1-2 dB(A) higher than at the left. This difference was considered to be influenced by the asymmetry of the sound field inside the cabin, as well as the location and radiation directionality of major noise sources; however, because individual noise sources and transmission paths were not analyzed separately, the specific cause is difficult to identify.
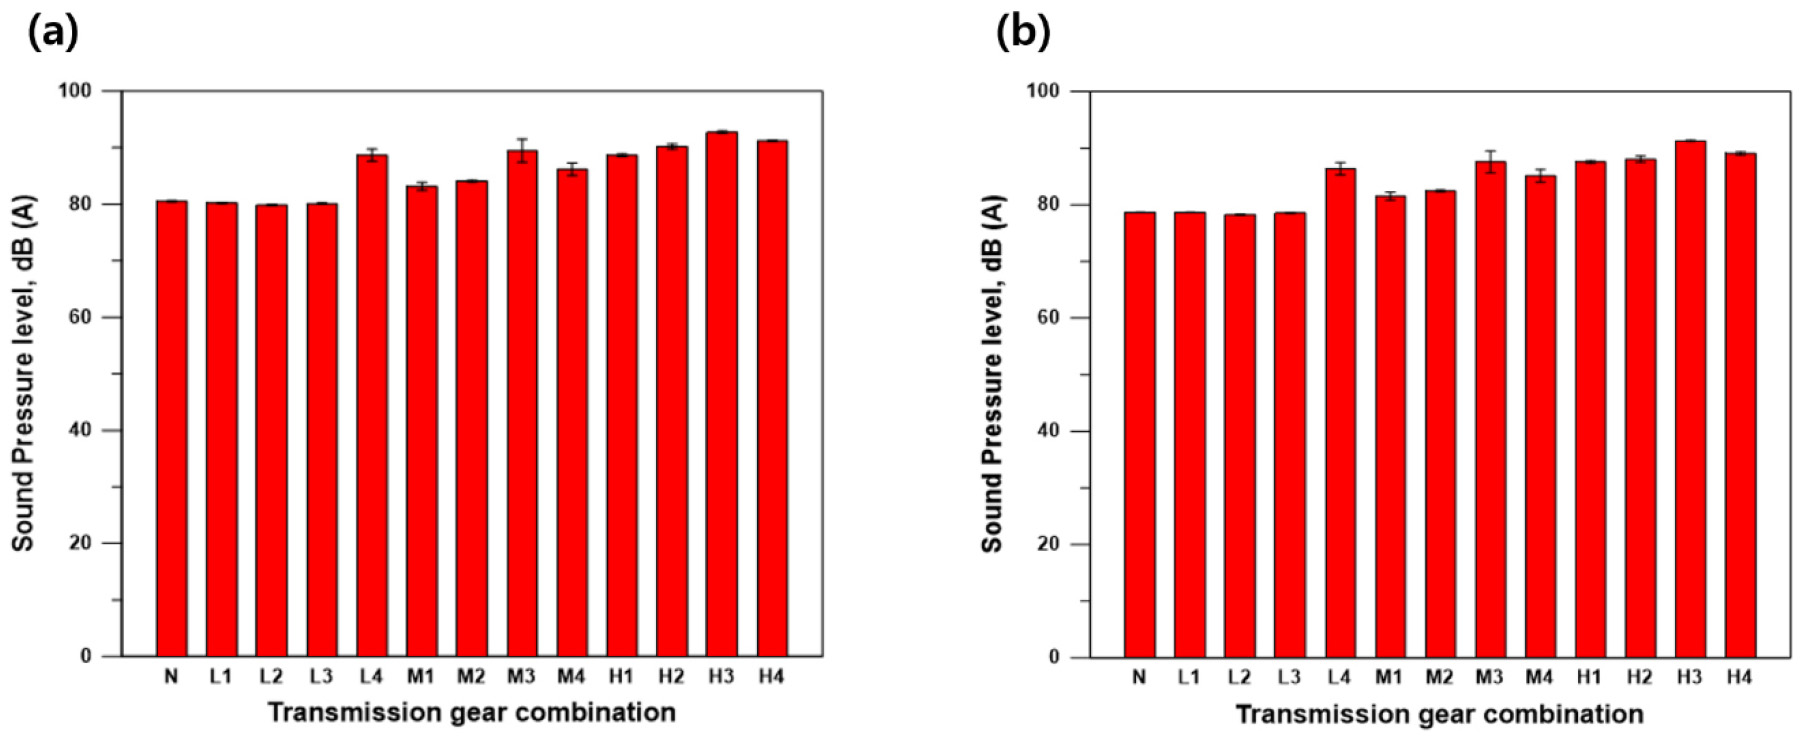
In the low-range (L) gears L1-L3, the noise levels were relatively consistent at 79.87-80.21 dB(A) on the right and 78.29-78.66 dB(A) on the left, and the standard deviation was small (0.11 dB(A) or less), indicating minimal variation between repeated measurements. In contrast, in L4, the levels were 88.68 ± 1.05 dB(A) on the right and 86.37 ± 1.12 dB(A) on the left—approximately 8 dB(A) higher than in L1-L3—indicating a significant increase in noise under specific gear combinations. In the M-range sub-gear, M3 recorded 89.44 ± 2.06 dB(A) on the right and 87.59 ± 1.91 dB(A) on the left, which were relatively higher than other sub-gear conditions, and the deviation between repeated measurements was also relatively large. In the H-range sub-shifts, generally high noise levels were observed in the H1-H4 range; in particular, H3 exhibited the highest noise levels among all shifting conditions, with 92.76 ± 0.16 dB(A) on the right and 91.30 ± 0.11 dB(A) on the left. In particular, noise levels and total vibration values were both relatively high in L4, M3, H3, and H4. This suggests that, even at the same engine speed, noise at the driver’s ear and vibration at the seat mounting point can simultaneously be high depending on the combination of specific sub- and main-gear ratios.
Using the three repeated measurements obtained under the 12 forward-driving conditions, we also performed one-way and two-way ANOVA and contribution-rate analyses for using the same procedure used for the vibration indices. The results of the one-way ANOVA showed that the shifting conditions had a significant effect on at both the right and left ear positions (p < 0.001). The results of the two-way ANOVA also showed that the sub-shift gear, main-shift gear, and interaction between them all had a significant effect on at both ear positions (p < 0.001). A comparison of the contribution rates by condition factor revealed that the contribution rate of the sub-speed group was the highest at both the right and left ear positions, at 60.31% and 63.51%, respectively. The contribution rates of the main gearshift were 18.37% and 17.43%, respectively, whereas the contribution rates of the interaction between the sub- and main gearshifts were 18.24% and 15.97%, respectively. This indicated that the secondary gearshift contributed most significantly to the variation in noise levels at the driver’s ear position depending on the shifting conditions, and that the interaction between the secondary and main gearshifts also played a significant role. The detailed results of the two-way ANOVA and the contribution rates by condition factor are presented in Table 8.
Table 8.
Two-way ANOVA results and percentage contributions of transmission factors to A-weighted equivalent sound levels
Furthermore, when compared with the OSHA permissible noise exposure limits in Table 6, noise levels exceeded 90 dB(A) under some conditions. Therefore, assuming that these noise levels persist throughout the work shift, this suggests that the permissible exposure time may be shorter than 8 h. In particular, in H3, the noise levels were 92.76 dB(A) on the right and 91.30 dB(A) on the left, indicating the need to consider noise exposure levels during prolonged driving. However, because these results were based on a comparison of —measured for a short duration under each gearshift condition—with OSHA standards, they should be interpreted as reference data rather than a direct assessment of cumulative noise exposure over an entire workday or an 8-h time-weighted average. Furthermore, this study confirmed that noise levels at the driver’s ear can vary depending on the gearshift combination, even under the same engine speed conditions. In particular, noise levels tended to increase with the total vibration value in certain gearshift combinations where the total vibration value was high. This suggests that the characteristics of the drivetrain, which vary depending on the gear combination, may have a complex influence not only on structure-borne vibration but also on the noise transmitted into the cabin. However, because this study did not analyze the contributions of individual noise sources or distinguish their transmission paths, further quantitative verification through acoustic transmission path analysis and noise source contribution analysis is necessary.
Conclusions
In this study, dynamometer tests conducted in an anechoic chamber were used to compare and analyze the vibrations at the tractor seat mounting point and the noise characteristics at the driver’s left and right ear positions under a rated engine speed of 2,200 rpm and various gearshift combinations. The test conditions included neutral and combinations of four main gears (1-4) and three range gears (L, M, and H). Under each condition, the vibration acceleration of the seat mounting in the X-axis (forward/backward), Y-axis (left/right), and Z-axis (up/down) directions, as well as the A-weighted equivalent noise level () at the driver’s left and right ear positions, were measured. The frequency weighting method specified in ISO 2631-1 (ISO, 1997) was applied to the measured vibrations to calculate the weighted RMS acceleration and total vibration values. The weighted RMS acceleration was used to evaluate vibration magnitude and axis-wise contribution, whereas PSD analysis was used to identify the frequency characteristics of each gearshift condition. The vibration analysis revealed that, even under the same engine speed conditions, the level of vibration transmitted to the seat varied significantly depending on the gearshift combination. The total vibration value () was lowest at 0.288 ± 0.003 m/s2 under neutral conditions and ranged from 0.351 to 1.323 m/s2 under drive conditions. Among the gear combinations, H4 exhibited the highest value at 1.323 ± 0.071 m/s2; rather than increasing consistently with higher gear ratios, relatively high values were observed in specific gear combinations such as L4, M3, H1, and H4. Furthermore, the relative contribution of the Z-axis was the highest in 9 of the 12 driving conditions. In H4, the Z-axis contribution was approximately 91.5%, indicating that vertical vibrations primarily contributed to the high total vibration value. However, in L4, M3, and H1, the Y-axis contribution was the highest, confirming that the axis primarily contributing to vibration varies depending on the gearshift combination. Statistical analysis revealed that the gearshift conditions had a significant effect on the frequency-weighted RMS acceleration and total vibration values for all axes (p < 0.001). The interaction between the range gear and main gear contributed relatively more to horizontal vibrations, whereas the range gear contributed relatively more to vertical vibrations and the total vibration value.
Furthermore, this study analyzed the PSD using L4, M3, H1, and H4 as representative conditions. The analysis results showed that the dominant frequency ranged from approximately 0.98 to 3.61 Hz depending on the condition. When the selected representative conditions in the order of L4, M3, H1, and H4 were compared, a trend was observed in which the dominant frequency generally shifted toward higher frequency bands. While on the X- and Y-axes the main components appeared primarily in the 0.98-3.61 Hz range, on the Z-axis, a secondary component around 23-25 Hz was commonly observed in all representative conditions alongside the dominant component. In some representative conditions, additional secondary components appeared around 35-42 Hz, and the Z-axis exhibited more complex spectral characteristics spanning a wider frequency range than the X- and Y-axes. In particular, for H4, a dominant component was identified at approximately 3.61 Hz on all three axes, and the PSD peak on the Z-axis was significantly larger than in other representative conditions. This demonstrates that not only the magnitude of vibration but also the dominant direction and frequency composition can vary depending on the gearshift combination.
Noise analysis results showed that the A-weighted equivalent noise level at the driver’s ear position ranged from 79.87 to 92.76 dB(A) on the right and 78.29 to 91.30 dB(A) on the left. Under most conditions, the level at the right ear was approximately 1-2 dB(A) higher than at the left ear. In particular, noise levels were relatively high under conditions L4, M3, H3, and H4, and these conditions partially overlapped with those where the total vibration values were high. This demonstrates that, even at the same engine speed, vibration at the seat mounting and noise levels at the driver’s ear position can increase together depending on specific gearshift combinations. Statistical analysis revealed that the gearshift conditions had a significant effect on both the right and left ear positions (p < 0.001), with the contribution rates of the sub-gearshifts being the highest at 60.31% and 63.51%, respectively.
Therefore, the results of this study are expected to serve as foundational data not only for the design of vibration and noise reduction in agricultural tractors and the improvement of the operator’s working environment but also for establishing transmission operating conditions. However, this study was limited to indoor tests conducted on a single tractor, and because vibrations were measured at the mounting point beneath the seat suspension, limitations existed in directly evaluating the WBV actually transmitted to the driver. Therefore, future studies should further verify the vibration and noise characteristics associated with different transmission combinations under actual road conditions and with various implement attachment conditions. Additionally, they should simultaneously measure vibrations at the seat mounting point, driver-seat contact surface, and steering wheel to comprehensively evaluate the damping characteristics of the seat suspension system and the whole-body and hand-arm vibrations transmitted to the driver.