


Introduction
Materials and Methods
Plant Material and Experimental Design
Growth and Morphological Measurements
Physiological and Photosynthetic Measurements
Statistical Analysis
Results
Morphological responses and growth dynamics under different LED light qualities
Physiological performance assessment
Seedling quality evaluation and integrated analysis
Discussions
Spectral composition differentially regulates morphological and physiological traits
White LED integrates structural compactness with enhanced photosynthetic capacity
Implications for seedling quality assessment in closed-type nursery systems
Conclusion
Introduction
Melon (Cucumis melo L.), recognized as a premium horticultural crop for its exceptional flavor and aroma, has shown consistent production growth in South Korea, with both cultivation area and total yield exhibiting continuous annual increases (RDA, 2018, 2021). Melon production primarily relies on protected cultivation systems using transplants from commercial nurseries. However, prolonged high temperatures exceeding 35°C and persistent cloudy conditions during the rainy season have increasingly destabilized conventional nursery environments, inducing excessive stem elongation, weak root development, and increased disease incidence, ultimately compromising seedling uniformity and transplant establishment (Luo et al., 2020; Pugliese et al., 2024). Most commercial nurseries heavily depend on natural light, making them vulnerable to summer heat stress and seasonal light deficiency under changing climate conditions. Among greenhouse crops, melon seedlings are particularly susceptible to high temperature and high humidity stress during summer, which can cause severe damage to seedling growth and result in significant economic losses (Weng et al., 2022). To address these challenges, closed-type nursery systems equipped with artificial lighting are increasingly being adopted. These systems enable precise control of temperature, humidity, and light intensity, ensuring uniform seedling development regardless of external weather fluctuations while providing additional benefits such as enhanced resource use efficiency (Graamans et al., 2018; Hwang et al., 2020; Kozai, 2018; Liu et al., 2022). Among artificial light sources, Light-emitting diodes (LEDs) are the preferred light source due to their higher energy efficiency, lower heat emission, and capability for precise wavelength control to manipulate plant morphological and physiological responses (Hammock et al., 2023; Ouzounis et al., 2015; Pay et al., 2024).
Light quality is a critical factor regulating plant development by activating different photoreceptors depending on wavelength (Wei et al., 2023). Blue light (400-500 nm) suppresses stem elongation, resulting in compact seedlings and enhanced photosynthetic performance, whereas red light (600-700 nm), when applied alone, promotes excessive elongation and produces elongated seedlings with reduced stem diameter and lower overall seedling quality (Izzo et al., 2020; Li et al., 2023). Green light (500-600 nm) penetrates deeply to enhance photosynthesis in lower leaves, while far-red light (700-800 nm) is typically minimized during seedling production due to shade avoidance responses, although appropriate levels can benefit leaf expansion (Meng et al., 2019; Terashima et al., 2009). Recently, quantum dot (QD) LED technology has enabled precise control of wide-red and far-red wavelengths through semiconductor nanoparticles, with studies demonstrating their effectiveness in promoting growth and metabolite accumulation in leafy vegetables (Choi et al., 2019; Kwon et al., 2025; Zhang et al., 2019). To evaluate light quality effects on seedling production, integrated assessment combining morphological measurements with physiological indicators such as reflectance-based vegetation indices and chlorophyll fluorescence parameters is essential (Katuwal et al., 2023). Research on LED light quality effects has been actively conducted across horticultural crops, with optimal conditions established primarily in leafy vegetables and solanaceous crops (Kwon et al., 2023; Lee et al., 2023; Liu et al., 2022). Studies on cucurbit crops have confirmed that blue to red light ratios significantly affect seedling quality (Bantis et al., 2020). Recent advances in LED technology and multivariate analysis methods enable more comprehensive evaluation of seedling quality beyond conventional morphological measurements. Applying this integrated assessment framework to melon seedling production would provide valuable insights for optimizing closed-type nursery systems. The domestic seedling industry faces climatic challenges including summer heat stress and rainy season light deficiency, making closed-type systems with optimized LED light quality increasingly important (Jeong et al., 2020; Kwon et al., 2023).
Therefore, this study aimed to determine the optimal LED light quality for melon seedling production in closed-type nursery systems under climate variability by comparatively evaluating five LED spectra (Blue, Blue+Red, Red, Blue+Wide-Red+Far-Red, and White) on seedling growth, photosynthetic performance, and quality indices. The results will provide scientific evidence for LED spectrum optimization and establish a foundation for stable production of high-quality melon seedlings, contributing to enhanced competitiveness of the domestic seedling industry under changing climate conditions.
Materials and Methods
Plant Material and Experimental Design
Melon (Cucumis melo L. cv. ‘Haniwon’) seeds were sown in paper pots containing commercial horticultural substrate and arranged in 50-cell propagation trays. The experiment was conducted from March 22 to April 19, 2024 (28 days) in a closed-type plant factory at Kangwon National University, Chuncheon, Republic of Korea (Fig. 1a, b). Ten seedlings per treatment (n = 10) were randomly assigned. Five LED spectral treatments were evaluated: Blue, Blue+Red, Red, Blue+Wide-Red+Far-Red, and White (Fig. 1c). All LED treatments were standardized to 300 µmol/m2/s1 photosynthetic photon flux density (PPFD) with a 16-h photoperiod (06:00-22:00). Environmental conditions were maintained at 30/20°C (day/night) with constant relative humidity throughout the experimental period. Seedlings were irrigated once daily in the morning using a sub-irrigation system with tap water. No additional nutrient solution was applied during the experimental period.
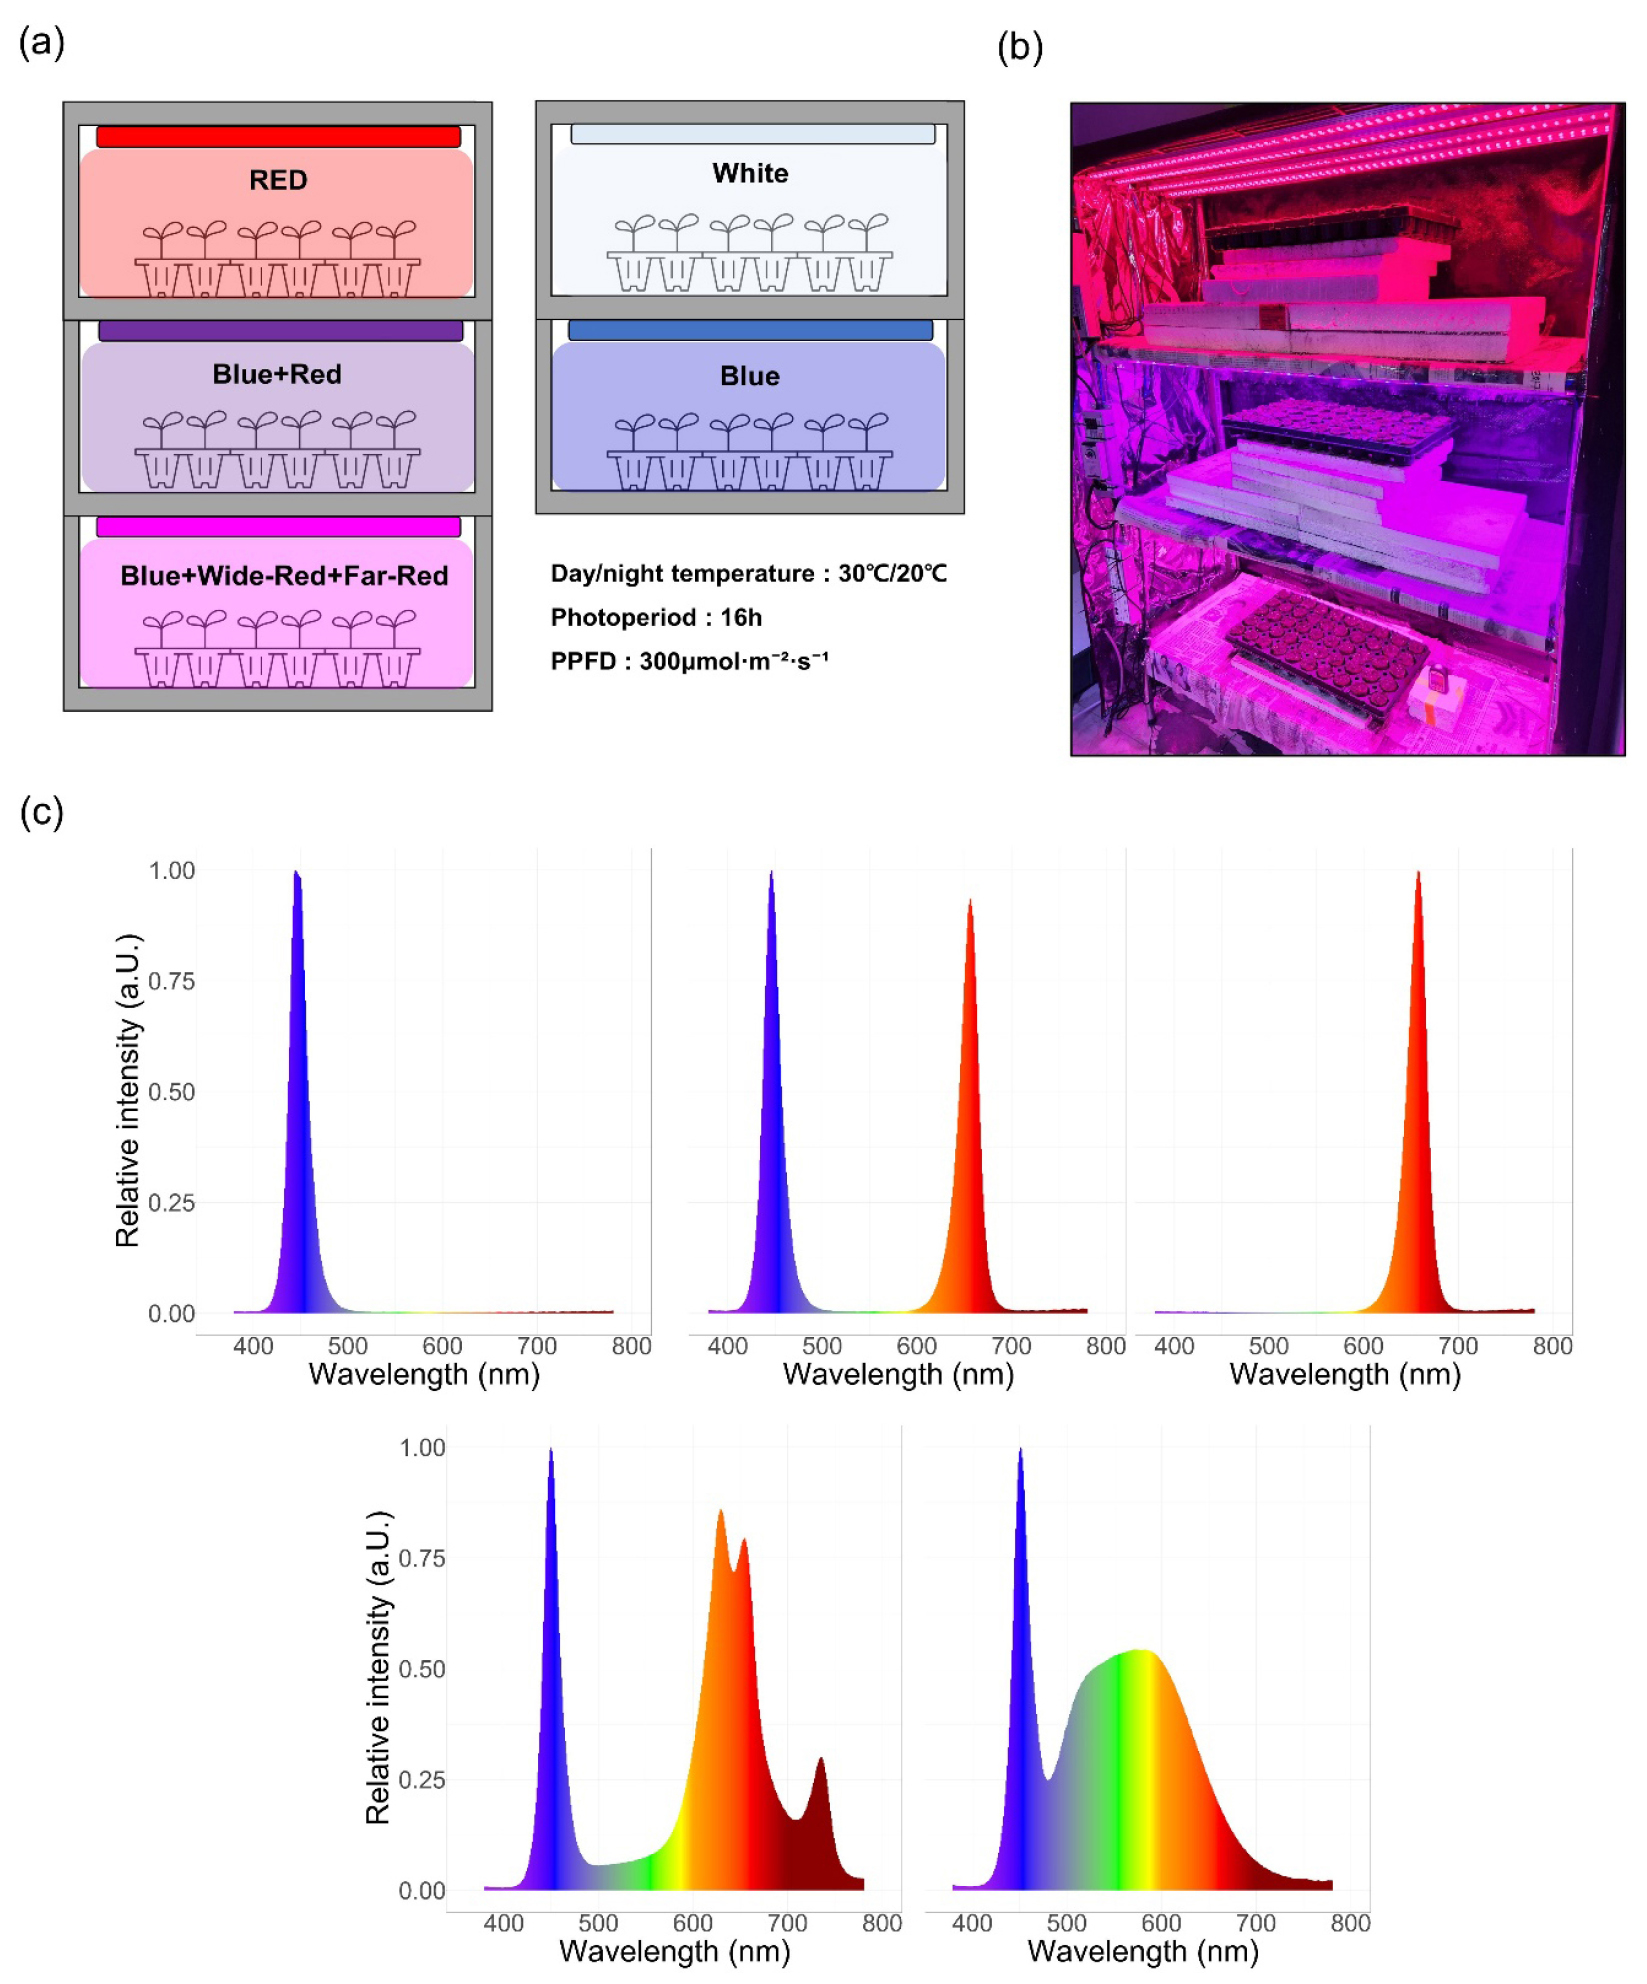
Fig. 1.
(a) Schematic diagram of the plant growth chamber illustrating the experimental cultivation environments under different LED light treatments. (b) Representative photograph of the plant cultivation chamber used in the experiment. (c) Light quality of the LED light sources applied in this study. From left to right: Blue, Blue + Red, Red, Blue + Wide Red + Far-Red, and White.
Growth and Morphological Measurements
Growth parameters were measured at 7-day intervals (0, 14, 21, 28 days after treatment, DAT), with final destructive measurements conducted at 28 DAT. Plant height was measured from the substrate level to the shoot apex. Leaf number was recorded by counting only fully expanded leaves. Stem diameter was measured at the cotyledon node using a digital caliper. Total leaf area per plant was calculated using a modified formula below (Lim et al., 2021; Wu et al., 2010)
Total leaf area (cm2) = 0.73 × leaf length (cm) × leaf width (cm) × mean leaf number per treatment
At final harvest (28 DAT), fresh weight (FW) and dry weight (DW) of shoots and roots were measured separately. Plant samples were oven-dried at 70°C for 72 h until constant weight was achieved. Seedling quality indices were calculated as follows: shoot-to-root ratio (T/R ratio) based on both FW and DW; specific leaf area (SLA, cm2/g) as total leaf area divided by leaf dry weight; and compactness (g/cm) as shoot dry weight divided by plant height.
Physiological and Photosynthetic Measurements
Vegetation indices including normalized difference vegetation index (NDVI), photochemical reflectance index (PRI), anthocyanin reflectance index (ARI), and carotenoid reflectance index (CRI) were measured using a Polypen RP 410 spectrophotometer (Photon Systems Instruments, Drásov, Czech Republic) (Gamon et al., 1992; Gitelson et al., 2001, 2002; Rouse, 1974). Relative chlorophyll content (SPAD value) was determined using a SPAD-502Plus chlorophyll meter (Konica Minolta, Osaka, Japan). Chlorophyll fluorescence parameters were assessed using a Fluorpen FP 110 fluorometer (Photon Systems Instruments, Drásov, Czech Republic) following 20 minutes of dark adaptation. Fast chlorophyll fluorescence transients (OJIP curves) were recorded, and JIP test parameters were calculated according to Strasser et al. (2004), including performance index on absorption basis (Pi_Abs), and specific energy fluxes per active reaction center: absorbed energy flux (ABS_RC), trapped energy flux (TRo_RC), electron transport flux (ETo_RC), and dissipated energy flux (DIo_RC) (Strasser et al., 2004).
Statistical Analysis
All data were analyzed using R software version 4.3.0 (R Core Team, Vienna, Austria). Data normality and homogeneity of variance were assessed prior to analysis. One-way analysis of variance (ANOVA) was performed to detect significant differences among treatments, followed by Duncan’s multiple range test (DMRT) at the 5% significance level (p < 0.05) using the ‘agricolae’ package (version 1.3.7). To explore multivariate relationships among measured parameters, principal component analysis (PCA) was conducted using the ‘FactoMineR’ package (version 2.11), with visualization generated using the ‘factoextra’ package (version 1.0.7). Hierarchical clustering analysis based on Pearson correlation coefficients was performed to identify functional groupings among parameters. Correlation heatmaps were generated using the ‘pheatmap’ package (version 1.0.12) to visualize relationships between morphological, physiological, and photosynthetic traits (Harrell and Dupont, 2020; Kassambara and Mundt, 2016; Kolde, 2019; Lê et al., 2008; Mendiburu, 2019; Wickham et al., 2019).
Results
Morphological responses and growth dynamics under different LED light qualities
Visual observations at 28 days after treatment (DAT) revealed clear morphological differentiation among melon seedlings subjected to different LED light quality treatments (Fig. 2). Seedlings grown under Red light exhibited pronounced stem elongation with markedly extended internodes, whereas those under Blue, Blue+Red, Blue+Wide-Red+Far-Red, and White spectra developed compact architectures with shorter stature and enhanced structural stability. The relative position of cotyledons with respect to true leaves reflected substantial variation in hypocotyl and epicotyl elongation, with Red-grown seedlings showing the most excessive vertical extension.
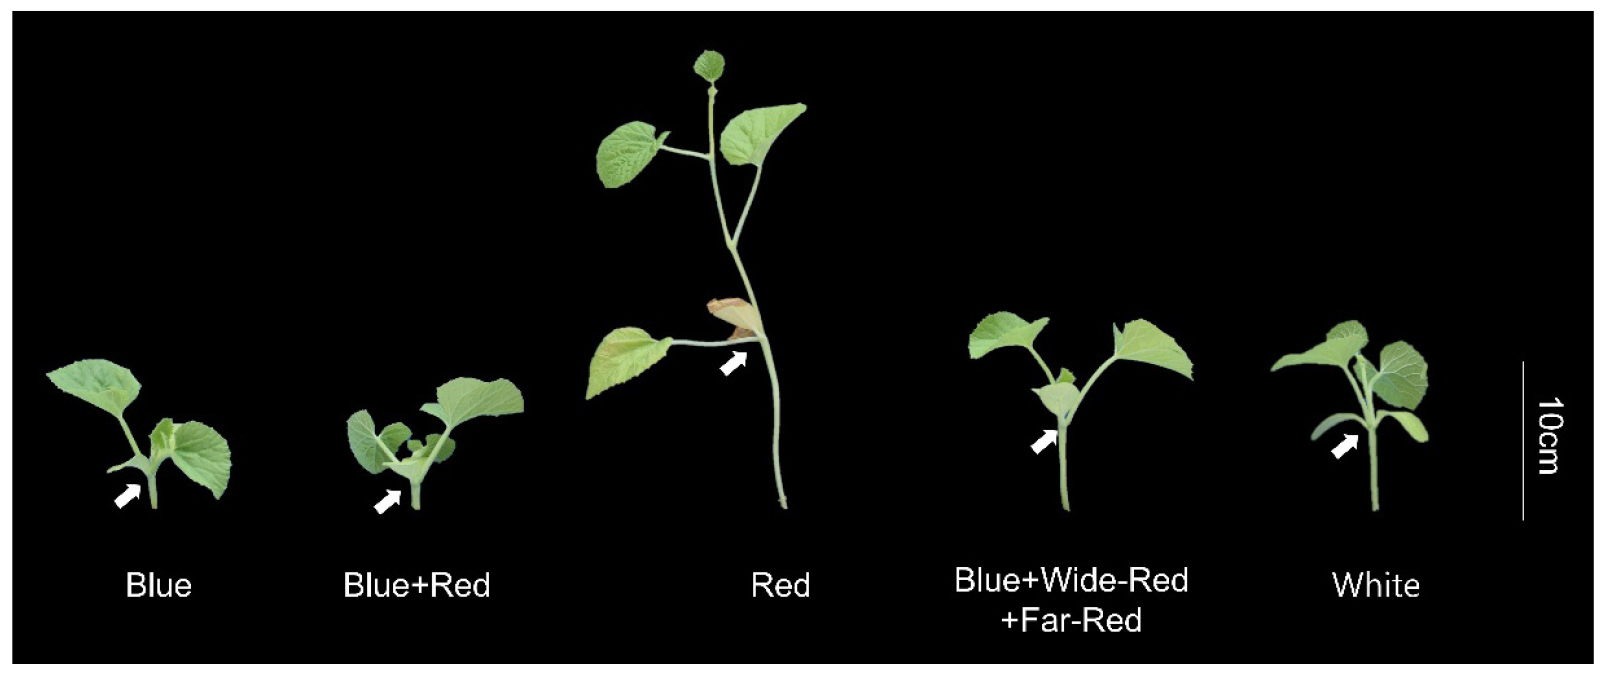
Fig. 2.
Morphological appearance of melon seedlings after 28 days of exposure to different LED light qualities. The white arrows indicate the position of the cotyledons, which demarcates the boundary between the hypocotyl and epicotyl. All images were captured with a scale bar, and a 10 cm reference is shown for size comparison.
Temporal dynamics of growth parameters demonstrated distinct developmental patterns among light quality treatments throughout the nursery period (Fig. 3). Plant height under Red light diverged significantly from all other treatments as early as 14 DAT and remained consistently highest. Blue, Blue+Red, Blue+Wide-Red+Far-Red, and White treatments exhibited statistically similar height values during early growth stages, with White seedlings displaying intermediate height by 28 days. Leaf area expansion followed comparable trends, with Red treatment producing significantly larger areas than all others, while Blue+Red and White formed an intermediate group. Red light resulted in the highest leaf number, statistically comparable to Blue+Red treatment, whereas Blue light produced the slowest leaf initiation rate.
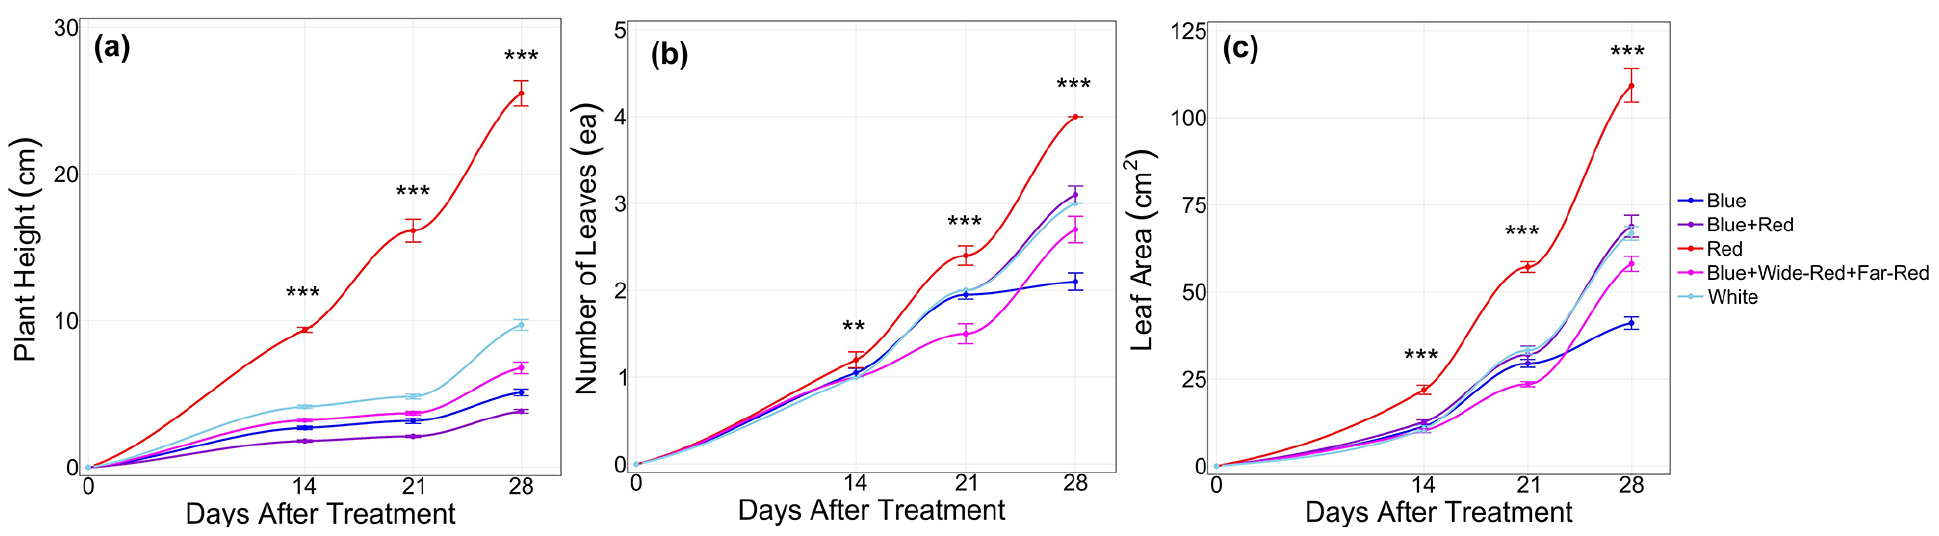
Fig. 3.
Effects of different LED light qualities on morphological characteristics of melon seedlings during the nursery period.(a) Plant height (cm), (b) Number of leaves (ea), and (c) Leaf area (cm2) were measured at 7-day intervals (0, 14, 21 and 28 days after treatment). Data represent means ± standard error (n = 10). Asterisks indicate significant differences among treatments at each time point based on one-way ANOVA (*p < 0.05, **p < 0.01, ***p < 0.001).
Morphometric evaluation at harvest revealed distinct statistical groupings among treatments (Table 1). Red light generated the tallest seedlings with the largest total leaf area, both significantly exceeding all other treatments, yet induced significantly reduced stem diameter compared to White and Blue+Wide-Red+Far-Red treatments. Blue treatment exhibited the shortest height and smallest leaf area, although stem diameter remained comparable to Blue+Red treatment. SPAD measurements indicated two distinct groups: Blue, Blue+Red, and White treatments maintained significantly higher chlorophyll content than Red and Blue+Wide-Red+Far-Red treatments, reflecting differential chlorophyll accumulation under varying spectral compositions.
Table 1
Effects of different LED light qualities on growth characteristics of melon seedlings at 28 days after treatment ± SEM (n = 10)
| Treatment |
Height (cm) |
Number of Leaves (ea) |
Leaf Area (cm2) |
Stem diameter (mm) | SPAD |
| Blue | 5.10 ± 0.2d1) | 2.1 ± 0.1d | 41.04 ± 1.8d | 4.05 ± 0.2b | 25.46 ± 0.9a |
| Blue+Red | 3.82 ± 0.1d | 3.1 ± 0.1b | 68.86 ± 3.2b | 4.22 ± 0.1ab | 24.79 ± 0.3a |
| Red | 25.5 ± 0.9a | 4.0 ± 0.0a | 109.2 ± 4.8a | 3.67 ± 0.1c | 15.52 ± 0.9b |
| Blue+Wide-Red+Far-Red | 6.78 ± 0.4c | 2.7 ± 0.2c | 58.06 ± 2.2c | 4.39 ± 0.1ab | 15.22 ± 0.8b |
| White | 9.71 ± 0.4b | 3.0 ± 0.0b | 66.80 ± 2.0b | 4.50 ± 0.1a | 25.68 ± 0.9a |
Seedling quality indices further revealed spectral composition-specific biomass allocation patterns (Table 2). Red light resulted in significantly higher T/R ratios on both fresh and dry weight bases compared to all other treatments, while the remaining treatments showed statistically similar shoot-to-root allocation. Compactness index was highest under Blue+Red treatment, significantly exceeding all others, whereas Red treatment exhibited the lowest value. Leaf area ratio formed three distinct groups: Red treatment highest, followed by Blue+Red and White treatments, with Blue treatment lowest. Notably, dry weight-based T/R ratio showed minimal variation among most treatments, except Blue treatment, which exhibited significantly lower values than Blue+Red and Red treatments, indicating relatively enhanced root biomass investment under monochromatic blue light.
Table 2
Effects of different LED light qualities on seedling quality index of melon seedlings at 28 days after treatment ± SEM (n = 8)
| Treatment |
T/R ratio (FW) |
T/R ratio (DW) |
Leaf area ratio (cm2/g) |
Compactness (g/cm) |
| Blue | 3.69 ± 0.3b1) | 1.12 ± 0.0c | 43.00 ± 1.4d | 0.39 ± 0.0b |
| Blue+Red | 3.78 ± 0.3b | 1.16 ± 0.0a | 71.32 ± 3.4b | 0.52 ± 0.0a |
| Red | 6.65 ± 0.3a | 1.17 ± 0.0a | 114.7 ± 3.9a | 0.08 ± 0.0e |
| Blue+Wide-Red+Far-Red | 3.04 ± 0.2b | 1.16 ± 0.0ab | 60.01 ± 2.2c | 0.29 ± 0.0c |
| White | 3.76 ± 0.3b | 1.13 ± 0.0bc | 69.17 ± 1.4b | 0.21 ± 0.0d |
Physiological performance assessment
Vegetation indices reflecting chlorophyll content and photosynthetic light-use efficiency demonstrated distinct patterns among light quality treatments (Fig. 4). NDVI, a primary indicator of chlorophyll abundance, was highest under Blue light, significantly surpassing all other treatments, while Red light produced the lowest values. White treatment exhibited intermediate NDVI, forming a statistically distinct group between Blue and Red treatments. PRI, indicative of photosynthetic efficiency linked to the xanthophyll cycle, showed a contrasting pattern. White treatment achieved the highest PRI values, significantly exceeding all others, whereas Red treatment exhibited the lowest efficiency. Carotenoid-related indices revealed additional spectral-dependent variations in pigment composition. CRI1, which correlates with carotenoid-to-chlorophyll ratio, was highest under Blue light, followed by an intermediate group comprising Blue+Red and White treatments, while Red and Blue+Wide-Red+Far-Red treatments showed significantly lower values. ARI1 displayed an inverse relationship with chlorophyll accumulation. Blue treatment exhibited significantly lower ARI1 compared to Blue+Red, Red, and Blue+Wide-Red+Far-Red treatments, while White treatment showed values comparable to Blue.
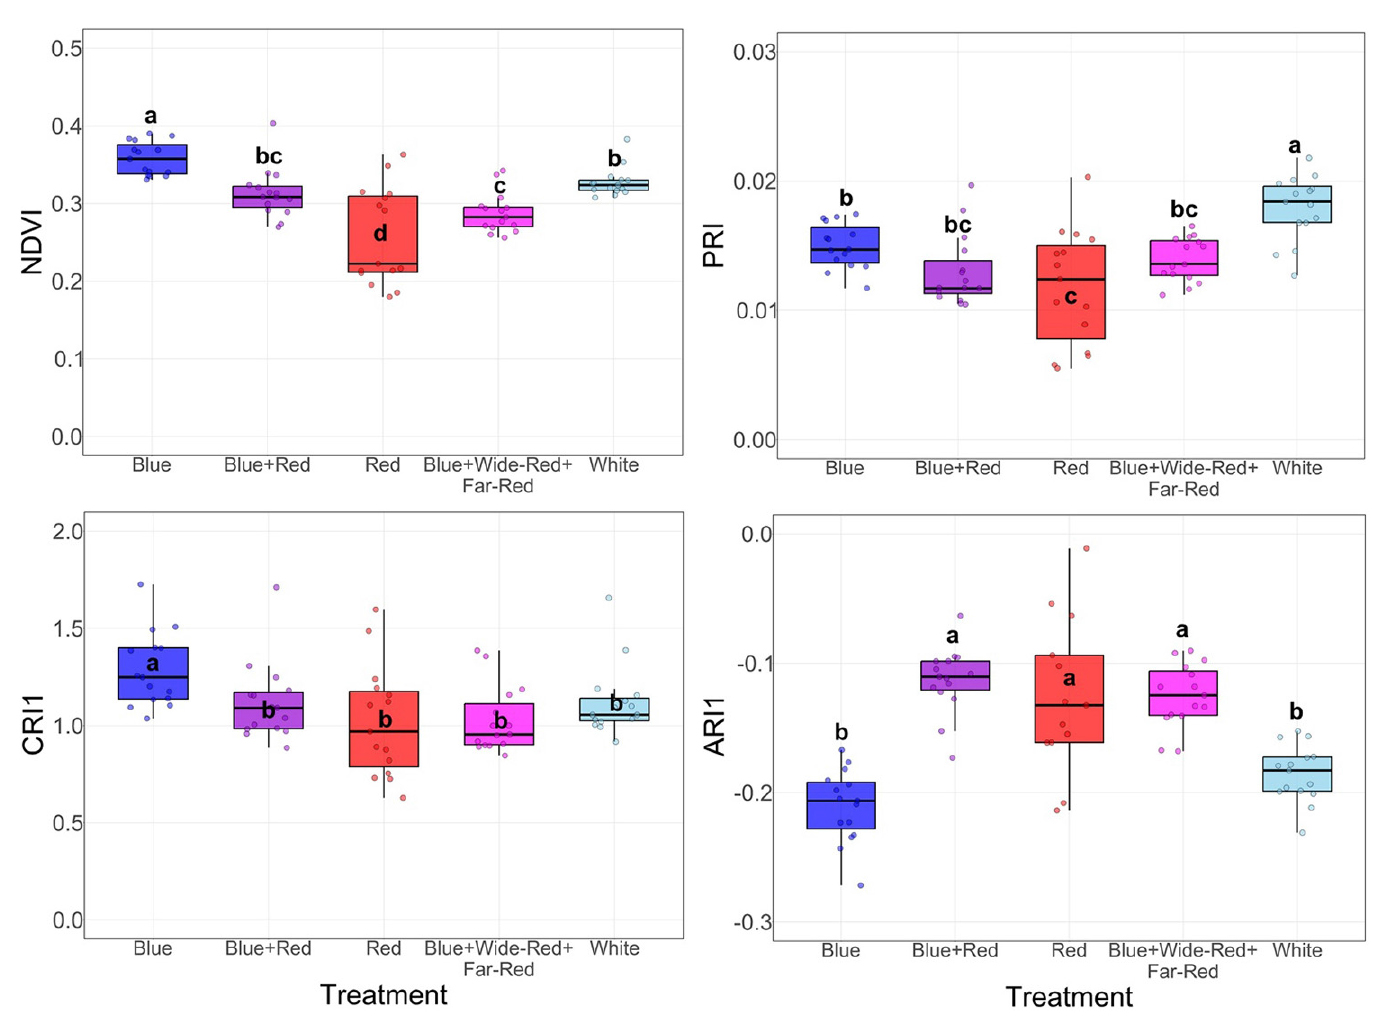
Fig. 4.
Physiological responses of melon seedlings to different LED light qualities assessed by vegetation indices. Parameters including NDVI, PRI, CRI1, and ARI1 were measured at 28 days after treatment to evaluate plant vigor, photosynthetic efficiency, and pigment content. Box plots represent the median (center line), interquartile range (box), and individual data points. Different letters denote significant differences among treatments (Duncan’s test, p < 0.05, n = 15).
Photosystem II (PSII) performance parameters assessed by JIP-test demonstrated significant functional differences among treatments (Fig. 5). Pi_Abs, representing overall photosynthetic performance, was significantly highest under White light, while Blue, Blue+Red, Red, and Blue+Wide-Red+Far-Red treatments formed a lower group without significant differences among them. Analysis of energy flux per reaction center revealed that Red treatment exhibited significantly elevated ABS/RC and TRo/RC compared to all other treatments, indicating higher energy absorption and trapping per active PSII reaction center. However, Red treatment also demonstrated significantly increased DIo/RC, suggesting greater heat dissipation relative to productive photochemical processes. ETo/RC showed that Red and White treatments achieved significantly higher electron transport efficiency than Blue, Blue+Red, and Blue+Wide-Red+Far-Red treatments. These patterns collectively indicate that while Red light promoted high energy throughput per reaction center, it simultaneously induced elevated thermal energy dissipation, whereas White light achieved superior integrated photosynthetic performance through balanced energy allocation.
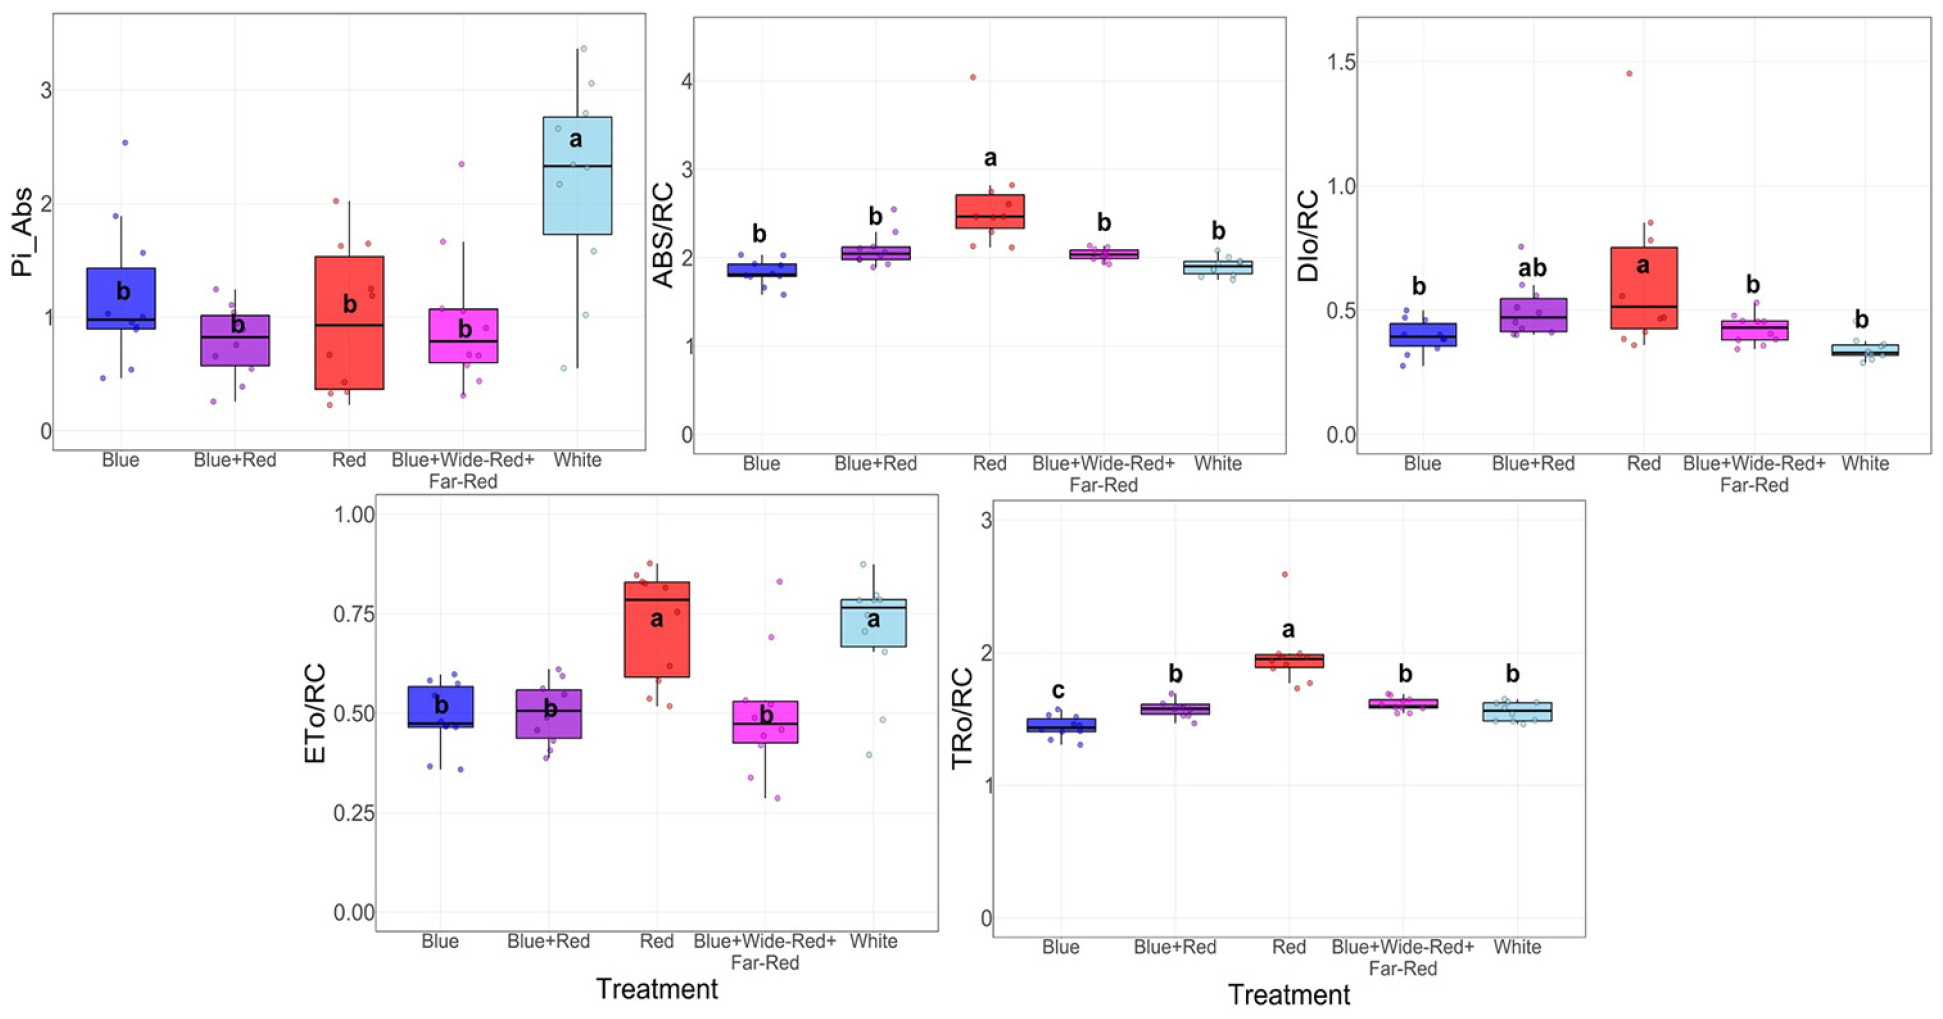
Fig. 5.
Photosystem II performance of melon seedlings under different LED light qualities as assessed by JIP-test. Parameters including Pi_Abs, ABS/RC, TRo/RC, ETo/RC, and DIo/RC were measured at 28 days after treatment to evaluate PSII photosynthetic activity and energy allocation. Box plots represent the median (center line), interquartile range (box), and individual data points. Different letters denote significant differences among treatments (Duncan’s test, p < 0.05, n = 10).
Seedling quality evaluation and integrated analysis
Principal component analysis (PCA) revealed distinct separation patterns among LED light quality treatments based on comprehensive morphological, physiological, and photosynthetic parameters (Fig. 6a). The first two principal components accounted for 85.8% of the total variance (PC1: 67.7%, PC2: 18.1%), indicating effective dimensionality reduction of the multidimensional dataset. PC1 primarily distinguished treatments along a morphological expansion-structural quality axis. Red treatment separated distinctly toward the positive PC1 direction, strongly associated with morphological expansion parameters (leaf area: 0.956, leaf area ratio: 0.957, height: 0.882, leaf number: 0.926), energy flux parameters (ABS/RC and TRo/RC: > 0.99, DIo/RC: 0.917), and biomass allocation indices (T/R ratios: 0.862-0.868). Conversely, Blue, Blue+Red, and Blue+Wide-Red+Far-Red treatments clustered toward negative PC1, correlating with quality-related parameters including NDVI (-0.929), CRI1 (-0.760), SPAD (-0.726), and compactness (-0.618). White treatment exhibited intermediate PC1 positioning, reflecting balanced morphological development. PC2 further differentiated treatments based on photosynthetic performance and efficiency. White treatment separated distinctly along positive PC2, showing strong alignment with integrated photosynthetic functionality (Pi_Abs: 0.902, ETo/RC: 0.812) and light-use efficiency (PRI: 0.660). This orthogonal positioning indicates that White light achieved superior photosynthetic capacity independent of morphological scale, representing a qualitatively different optimization strategy. Blue+Wide-Red+Far-Red treatment also showed negative PC2 values, primarily driven by negative loadings of T/R ratio (DW: -0.416) and ARI1 (-0.464), suggesting enhanced root investment. Other treatments exhibited limited variation along PC2, indicating that photosynthetic performance differences among them were captured primarily by PC1.
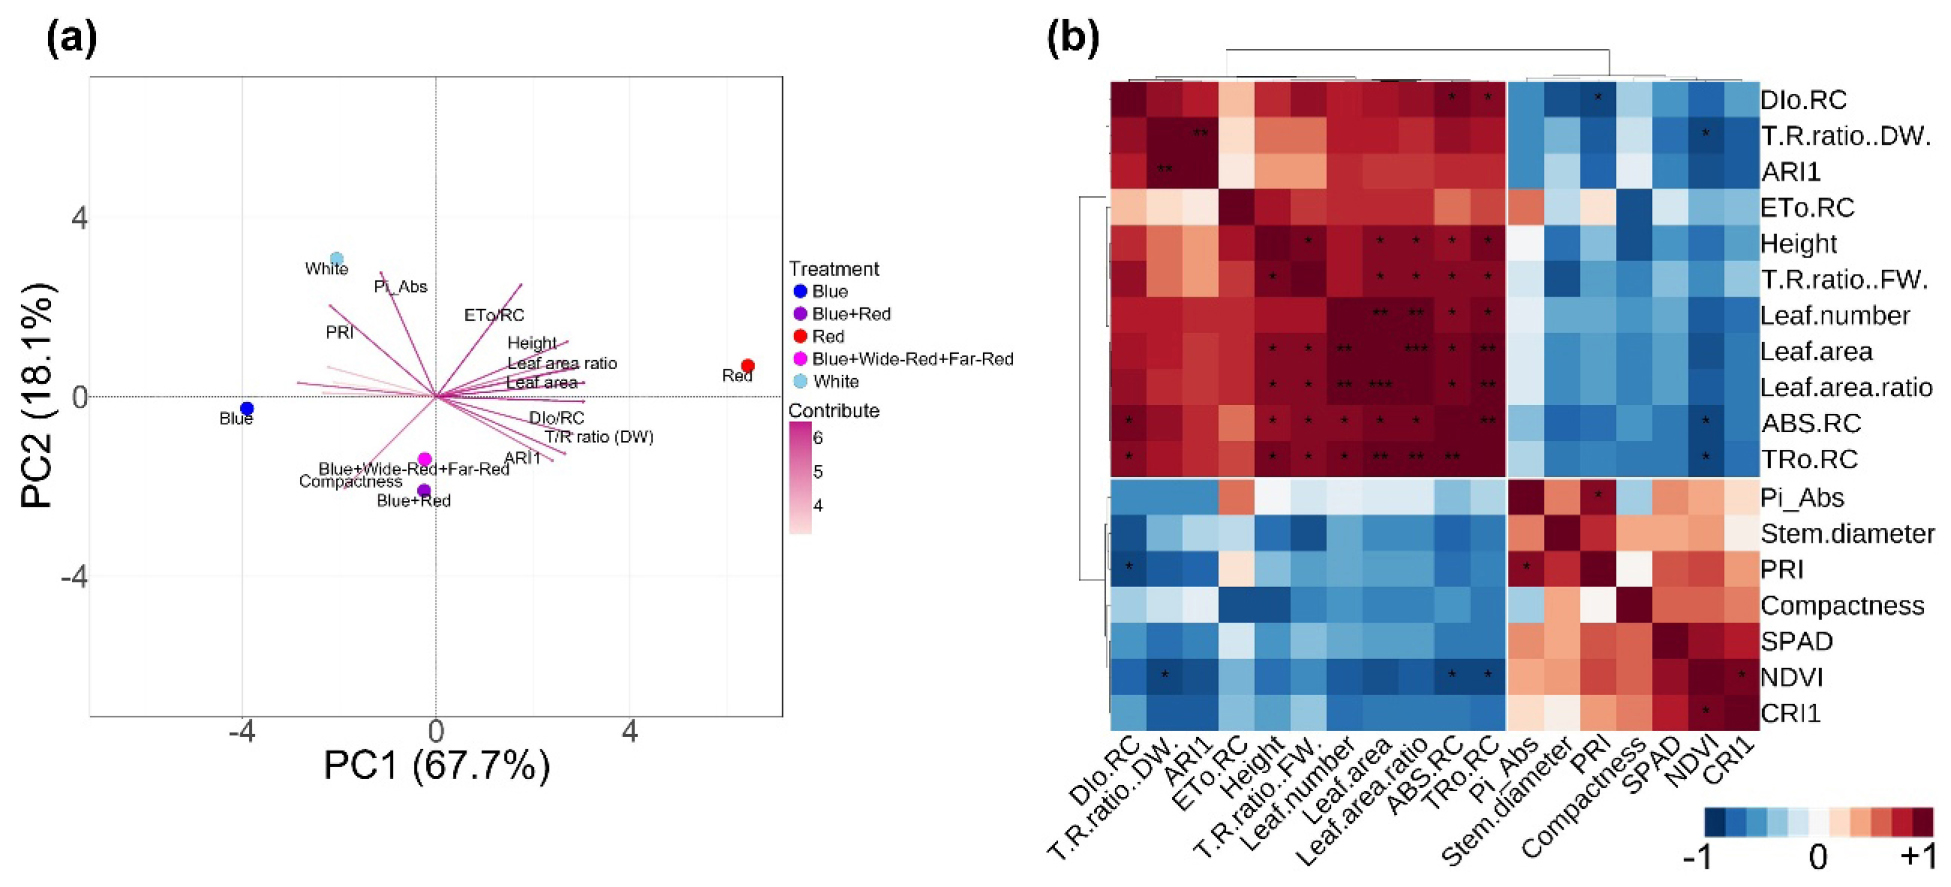
Fig. 6.
Multivariate analysis of melon seedling quality parameters under different LED light quality treatments. (a) Principal component analysis biplot. PC1 and PC2 explained 67.7% and 18.1% of the total variance, respectively. Treatment circles represent Blue, Blue+Red, Red, Blue+Wide-Red+Far-Red, and White LED conditions. Arrows indicate loading vectors of morphological, physiological, and photosynthetic parameters. Arrow length represents the contribution magnitude to the principal components, and arrow direction indicates positive or negative associations with treatments. (b) Pearson correlation matrix with hierarchical clustering. Color intensity represents correlation strength: red indicates positive correlations, blue indicates negative correlations. Asterisks denote statistical significance (*p < 0.05, **p < 0.01, ***p < 0.001). Hierarchical clustering dendrograms identify two major variable clusters showing contrasting physiological characteristics.
Hierarchical clustering analysis of the Pearson correlation matrix identified two major variable clusters exhibiting contrasting physiological characteristics (Fig. 6b). The first cluster encompassed morphological expansion-related parameters (height, leaf number, leaf area, leaf area ratio, T/R ratios) alongside energy flux parameters (ABS/RC, TRo/RC, DIo/RC, ETo/RC) and ARI1, demonstrating strong positive intercorrelations (r > 0.7). The second cluster comprised seedling quality indices (compactness, stem diameter), chlorophyll-related parameters (SPAD, NDVI, CRI1), photosynthetic efficiency (PRI), and integrated performance (Pi_Abs).
Strong negative correlations (r < -0.6) emerged between these two clusters. Compactness negatively correlated with height (r = -0.85), NDVI inversely related to ARI1 (r = -0.78), and PI_Abs showed negative associations with morphological expansion parameters, reflecting fundamental trade-offs between vegetative expansion and structural quality. These correlation patterns indicate that superior photosynthetic performance associated with balanced rather than excessive growth. The multivariate analysis demonstrates that Blue+Red and White treatments achieved optimal integration of morphological development, chlorophyll accumulation, and photosynthetic functionality. In contrast, Red treatment promoted dimensional expansion at the expense of structural integrity and photosynthetic efficiency.
Discussions
Spectral composition differentially regulates morphological and physiological traits
Red light treatment resulted in significantly taller seedlings with reduced stem diameter and the lowest compactness index, indicating excessive stem elongation characteristic of shade avoidance syndrome (Izzo et al., 2020; Li et al., 2023). This morphological response, driven by phytochrome-mediated signaling under monochromatic red light (Wei et al., 2023), led to disproportionately high shoot-to-root ratios significantly exceeding those in blue-enriched treatments. The absence of blue photon input likely compromised normal photomorphogenic regulation, as cryptochromes and phototropins serve as key blue light receptors governing growth processes (Li et al., 2023; Wei et al., 2023), resulting in etiolated morphology unsuitable for commercial seedling production. Additionally, Red treatment exhibited elevated energy dissipation per reaction center (DIo/RC) alongside high absorption and trapping fluxes, suggesting inefficient photosynthetic energy utilization despite high light capture. The compromised structural integrity combined with imbalanced carbon allocation between shoot and root systems would negatively affect transplant establishment and subsequent field performance (Liu et al., 2025; Qin and Leskovar, 2020).
In contrast, Blue and Blue+Red treatments produced significantly more compact seedlings with reduced height and enhanced stem diameter, while maintaining balanced T/R ratios. Blue light exerts inhibitory effects on hypocotyl elongation through cryptochrome activation (Li et al., 2023; Wei et al., 2023), promoting photomorphogenic development characterized by reduced internode length and increased radial stem expansion. Blue-enriched LED spectra decreased shoot and root ratios in seedlings, indicating enhanced carbon allocation to root systems, which subsequently promoted post-transplant growth and improved seedling establishment (Johkan et al., 2010). Furthermore, SPAD values were significantly higher in Blue, Blue+Red treatments compared to Red treatment, while NDVI was highest under Blue treatment, suggesting enhanced chlorophyll accumulation potentially mediated through blue light-responsive transcription factors regulating chloroplast development (Izzo et al., 2020; Lee et al., 2023; Li et al., 2023). These contrasting responses demonstrate that spectral composition fundamentally determines both structural quality and pigment content through distinct photoreceptor-mediated pathways.
White LED integrates structural compactness with enhanced photosynthetic capacity
While White LED treatment produced morphological characteristics statistically similar to blue-enriched treatments regarding compactness and T/R ratio, it exhibited significantly superior photosynthetic functionality. The photochemical reflectance index (PRI) was significantly highest under White LED, indicating enhanced xanthophyll cycle activity and photoprotective capacity (Nakamura et al., 2024). Most critically, the performance index on absorption basis (Pi_Abs)—a comprehensive parameter integrating absorption flux per reaction center, maximum quantum yield of primary photochemistry, and probability of electron transport beyond primary quinone acceptor—was significantly highest in White LED-grown seedlings. This finding indicates that White LED enhanced overall photosystem II functionality with more efficient energy conservation pathways.
The broad spectral composition of White LED provided balanced photon distribution across photosynthetically active wavelengths, including green light penetration to inner leaf tissues (Terashima et al., 2009). This spectral balance enabled optimal coordination between light-harvesting complex efficiency and downstream photochemical processes. Unlike blue-enriched treatments that optimize morphological structure primarily through cryptochrome signaling, White LED simultaneously supported both structural quality and enhanced photosynthetic apparatus development. Principal component analysis revealed this distinction quantitatively: while treatments excluding Red exhibited relatively comparable PC1 scores (67.7% variance, growth-related traits), White LED achieved markedly higher PC2 values (18.1% variance, photosynthetic capacity) compared to Blue and Blue+Red treatments. This orthogonal separation demonstrates that White LED enhanced physiological performance independent of morphological dimensions, representing a qualitatively distinct optimization strategy that balances structural regulation with functional photosynthetic capacity.
Implications for seedling quality assessment in closed-type nursery systems
The functional dissociation between growth metrics (PC1) and photosynthetic capacity (PC2) revealed by principal component analysis emphasizes a critical limitation in conventional seedling quality assessment protocols that rely predominantly on morphological characteristics. Hierarchical clustering based on integrated parameters revealed that morphological expansion-related traits (height, leaf area, T/R ratios) and energy flux parameters (ABS/RC, TRo/RC, DIo/RC) formed a distinct cluster showing strong negative correlations with seedling quality indices (compactness, NDVI) and photosynthetic efficiency parameters (PRI, PI_Abs). This correlation structure indicates that superior photosynthetic performance associates with balanced rather than excessive growth, and that conventional dimensional measurements fail to capture functional photosynthetic capacity critical for transplant establishment. The present findings demonstrate that optimal LED spectrum selection for melon seedling production in closed-type nursery systems requires integration of morphological quality control with physiological capacity enhancement. While blue-enriched spectra effectively regulated stem elongation through cryptochrome-mediated photomorphogenesis, White LED provided additional physiological advantages through enhanced photosynthetic functionality. These physiological attributes influence seedling resilience during transplant shock and adaptation to subsequent variable environmental conditions rather than merely promoting biomass accumulation (Melissas et al., 2022). As climate change increasingly affects transplant production through temperature and humidity stress; (Pugliese et al., 2024; Weng et al., 2022) closed-type nursery systems employing spectrally optimized LED lighting offer a promising approach for producing high-quality seedlings. The comprehensive evaluation framework established in this study, integrating conventional quality indices with advanced photosynthetic parameters, provides a scientific basis for LED spectrum optimization in commercial melon seedling production under climate variability conditions.
Conclusion
This study demonstrated that White LED optimizes melon seedling quality in closed-type nursery systems by balancing morphological compactness with enhanced photosystem II functionality. Principal component analysis revealed that seedling quality comprises two independent dimensions: growth-related traits (PC1, 67.7%) and photosynthetic capacity (PC2, 18.1%), indicating that optimal spectrum selection requires integrating both morphological and physiological performance rather than relying exclusively on conventional dimensional measurements. While blue-enriched spectra effectively regulated stem elongation through cryptochrome-mediated responses, White LED uniquely combined structural quality with superior photosynthetic efficiency, as evidenced by the highest performance index on absorption basis and photochemical reflectance index. These findings establish a comprehensive evaluation framework for LED spectrum optimization in closed-type systems, supporting stable production of high-quality transplants under climate variability. Future research should evaluate long-term effects of spectrum-induced seedling quality differences on post-transplant field performance to develop integrated production protocols for commercial melon cultivation.