

Introduction
Materials and Methods
Description of the Study Area
Experimental Materials
Experimental Treatments and Design
Experimental Procedures and Cultural Practices
Data Collection: Soil Sampling and Analysis
Phenological Parameters
Growth Parameters
Yield Parameters
Crop Stand
Data Statistical Analysis
Results and Discussion
Crop Phenology
Growth parameters
Yield and yield components
Crop Stand
Correlation Analysis
Summary and Conclusion
Introduction
Abelmoschus esculentus L. (Moench) commonly known as okra or ladies’ finger, is an important vegetable crop cultivated across tropical and subtropical regions worldwide. It belongs to the Malvaceae family and serves as a staple food in many countries, including Iraq, Nigeria, India, Cameroon, Pakistan and Ghana (Shubham et al., 2017). Although okra was first domesticated in Ethiopia, it is now extensively cultivated in many parts of the world (Khalid et al., 2005).
Despite its importance, okra production is constrained by several challenges. The availability of high quality, high yielding seed remains limited, although seed is one of the most essential inputs determining final yield. Optimal plant growth and fruit development are equally important for achieving superior seed and pod yield. However, farmers in Ethiopia commonly rely on low-yielding local cultivars and adopt suboptimal agronomic practices. Factors such as inappropriate plant population, improper planting time, poor soil fertility, weed infestation and insect pest pressure significantly reduce productivity (Paththinige et al., 2008). Proper plant spacing and fertilizer management are therefore essential to improving okra yield and quality. Optimal plant density improves vegetative growth and pod yield, whereas excessively high or low densities lead to reduced productivity and poor fruit quality (Paththinige et al., 2008). Okra also requires adequate supplies of essential nutrients such as calcium, potassium, sulfur and phosphorus; deficiencies in these nutrients result in poor crop performance and reduced yield (Shukla and Nalk, 1993).
Although detailed records of okra production zones in Ethiopia are limited, the crop is traditionally grown in the western, southern and northern regions (Mihretu et al., 2014). Reported yields vary widely across locations. Farmers in Assosa typically obtain yields of 8-10 t ha-1 (BGRSBA, 2016), while in Gambella, appropriate spacing and nitrogen fertilization have resulted in yields of 30-40 t ha-1 (Amanga, 2014). Under Jimma conditions, pod yields of up to 15.95 t ha-1 have been achieved with appropriate NPS fertilizer application and plant density. Despite favorable agroecological conditions, national okra production remains low due to the widespread use of traditional practices and limited adoption of improved agronomic management, particularly optimized NPS fertilizer rates and plant spacing.
Given these challenges, there is a clear need to determine appropriate nutrient management and plant density strategies to enhance okra productivity in Ethiopia. Therefore, this study aimed to identify the optimal NPS fertilizer rate and intra-row spacing for improving the growth and yield of okra under Jimma conditions. Specifically, the objectives were to: (i) determine the optimum NPS fertilizer rate for enhanced growth and yield, (ii) identify the best intra-row spacing for maximizing plant performance, and (iii) evaluate the interaction effects of plant density and NPS fertilizer on okra production at Jimma.
Materials and Methods
Description of the Study Area
The experiment was conducted under rainfed conditions during the 2019 main cropping season at the Jimma University College of Agriculture and Veterinary Medicine (JUCAVM), Eladalle Research Station. The site is located approximately 346 km southwest of Addis Ababa and 7 km from Jimma town. Geographically, it lies at an altitude of 1710 meters above sea level, at 7°33’N latitude and 36°57’E longitude. A mean daily maximum temperature of 28.2°C and a mean minimum temperature of 12.7°C characterize the study area. The mean daily maximum relative humidity is 92.1%, with a minimum of 49.4%. The region receives an average annual rainfall of about 1495 mm. The experimental site’s soil composition was clay loam with good drainage, and plants were strategically planted around it to act as wind breakers (Baw et al., 2017; BPEDORS, 2000; Seyou et al., 2016).
Experimental Materials
The okra cultivar used in this study was Amola, obtained from the Gambella Agricultural Research Institute (GARI). Amola is a locally known cultivar characterized by its relatively short growth cycle, reaching maturity within 55-75 days. It is considered a small or dwarf variety and has been reported to produce comparatively higher yields than many traditional cultivars (Amanga, 2014). NPS fertilizer was used as the nutrient source for the experiment, based on the recommendations by Baw et al. (2017).
Experimental Treatments and Design
The experiment consisted of four NPS fertilizer rates (0, 62.5, 125 and 187.5 kg ha-1) and three intra-row spacings (20, 30 and 40 cm) (Table 1). Treatments were arranged in a 3x4 factorial combination using a randomized complete block design (RCBD) with three replications. Each plot measured 3.0 m × 3.0 m (9 m2). Plots were spaced 0.5 m apart, while blocks were separated by 1.5 m. The entire experimental area covered 42 m × 13.5 m (567 m2). Each plot contained six rows spaced 45 cm apart. Depending on intra-row spacing, the number of plants per row was 15, 10 and 7 for the 20, 30 and 40 cm treatments, respectively (Adeniji and Peter, 2005). The central four rows spaced 45 cm apart, served as the net plot for data collection, while the outermost rows were considered border rows. The harvestable plot area was 2.25 m × 2.1 m (4.73 m2).
Table 1
Combination of treatments of the experiment
To establish the baseline NPS fertilizer rate, the general regional recommendation of 100 kg DAP and 100 kg urea ha-1 was used. Since 100 kg DAP contains 46 kg P2O5, the corresponding amount of NPS fertilizer required to supply equivalent P2O5 was calculated. Based on this conversion, 125 kg NPS ha-1 was determined as the baseline application rate for the experiment. The NPS fertilizer used contained 18.9% N, 37.7% P2O5 and 6.95% S.
Experimental Procedures and Cultural Practices
The experimental field was thoroughly prepared to establish uniformly structured seedbeds. A total of 2 kg of Amola okra seed was used for planting. Sowing took place on September 18, 2019, following the assigned treatment combinations of intra-row spacing and NPS fertilizer rate. Two to three seeds were placed per hole at a depth of approximately 3 cm. Seedlings were thinned seven days after emergence, retaining one healthy plant per stand. NPS fertilizer was applied according to the treatment levels in two splits: half of the rate was applied two weeks after seedling emergence, and the remaining half was side-dressed at flowering. The fertilizer treatments included 0, 62.5, 125 and 187.5 kg NPS ha-1, with 0 kg ha-1 serving as the control (Baw et al., 2017).
The experiment relied entirely on rainfall for moisture supply. Weeding was performed manually at weekly intervals during the early growth stages to minimize competition. Other recommended agronomic practices were applied uniformly across all plots. Harvesting began when the young pods reached marketable maturity, typically 8-9 cm in length. Okra pods were harvested every other day, starting from the appearance of the first harvestable pod. Under normal conditions, okra fruits reach harvestable size within five to ten days after flowering (Adeniji and Peter, 2005; Adetuyi et al., 2008; Baw et al., 2017).
Data Collection: Soil Sampling and Analysis
Prior to fertilizer application, soil samples were collected from the entire experimental field to determine key physical and chemical properties. Composite soil sampling was carried out using an auger in a zigzag pattern across the site at a depth of 0-30 cm. The samples were thoroughly mixed to obtain a 1 kg composite sample representing the experimental area. The composite sample was air-dried, ground, and passed through a 2 mm sieve before laboratory analysis. The physical properties analyzed included soil texture and structure, while chemical analyses covered soil pH, total nitrogen (N), organic carbon (OC), available phosphorus (AP), and cation exchange capacity (CEC), following standard procedures (Kahn et al., 2003; Firoz, 2009).
The soil analysis revealed a pH of 5.28, indicating moderately acidic conditions. Organic carbon content was 1.24%, which falls into the low category based on OC rating classes: very low (& 1.0%), low (1.0-1.71%), medium (1.72-3.0%), high (3.1-4.29%), and very high (> 4.3%). Total nitrogen content was 0.108%, classified as low according to standard nitrogen rating criteria: very high (>1.0%), high (0.5-1.0%), medium (0.2-0.5%), low (0.1-0.2%), and very low (& 0.1%). The soil had a cation exchange capacity (CEC) of 15.75 meq 100 g-1, which is rated as medium. Available phosphorus was measured at 7.436 mg kg-1, categorized as low. As shown in Table 2, the soil texture consisted of 32% silt, 23% clay, and 45% sand, classifying it as clay loam (Kahn et al., 2003; Firoz, 2009).
Table 2
Pre-sowing soil physicochemical properties of the experimental site
Phenological Parameters
Crop emergence percentage
Emergence percentage was determined by counting the number of plants that successfully emerged and expressing this as a percentage of the total number of seeds sown.
Days to 50% flowering
This parameter represents the number of days from seedling emergence until 50% of the plants in a plot produced their first flowers (Baw et al., 2017).
Days to 50% pod setting
Days to 50% pod set were recorded as the number of days from seedling emergence until half of the plants in a plot produced at least one pod (Baw et al., 2017).
Growth Parameters
Plant height (cm)
Plant height was measured at harvest from ten randomly selected plants in the central rows. Height was measured from the soil surface to the tip of the plant using a measuring tape (Baw et al., 2017; Zibelo et al., 2016).
Length of the pod-bearing zone (cm)
This refers to the distance along the stem from the first pod to the last pod on ten randomly selected plants, measured in centimeters (Baw et al., 2017; Zibelo et al., 2016).
Number of branches per plant
At final harvest, the total number of branches on ten randomly selected plants from the central rows was counted and averaged (Baw et al., 2017; Zibelo et al., 2016).
Number of leaves per plant
The total number of leaves was counted on the same ten plants used for measuring plant height, and the mean number of leaves per plant was recorded (Baw et al., 2017; Zibelo et al., 2016).
Yield Parameters
Number of green pods per plant
On each picking date, ten randomly selected and tagged plants per plot were used to count the total number of green pods. The mean number of pods per plant was calculated (Baw et al., 2017; Zibelo et al., 2016).
Green pod length (cm)
Ten marketable green pods collected from the selected plants were measured for length using a ruler and averaged (Baw et al., 2017).
Green pod yield per plant (kg)
The total weight of pods harvested from the ten selected plants at each picking was summed and averaged to determine green pod yield per plant (Baw et al., 2017; Zibelo et al., 2016).
Green pod yield in tons per hectare (t ha-1)
Green pod yield per hectare was obtained by summing the total pod weight harvested from the net plot area during all pickings and converting the value to a hectare basis (Zibelo et al., 2016).
Fresh Pod Weight per Plant (g)
Fresh pod weight was determined using a digital balance. Ten randomly selected fresh pods from each net plot were weighed, and the average fresh pod weight per plant was recorded (Baw et al., 2017).
Dry Pod Weight per Plant (g)
For dry pod weight, ten pods from the net plot were randomly selected and sun-dried for two days. The dried pods were then weighed using a digital scale, and the mean dry pod weight per plant was calculated (Baw et al., 2017).
Crop Stand
Crop stand was assessed by counting the total number of plants remaining in the net plot area at harvest (Baw et al., 2017; Zibelo et al., 2016).
Data Statistical Analysis
All collected data were subjected to analysis of variance (ANOVA) using SAS software version 9.3 (SAS Institute Inc., 2014), following the randomized complete block design (RCBD) model. Correlation analysis was performed to examine the linear relationships between yield and other agronomic parameters. When significant treatment effects were detected, mean separation was conducted using the Least Significant Difference (LSD) test at the 5% probability level (Baw et al., 2017).
Results and Discussion
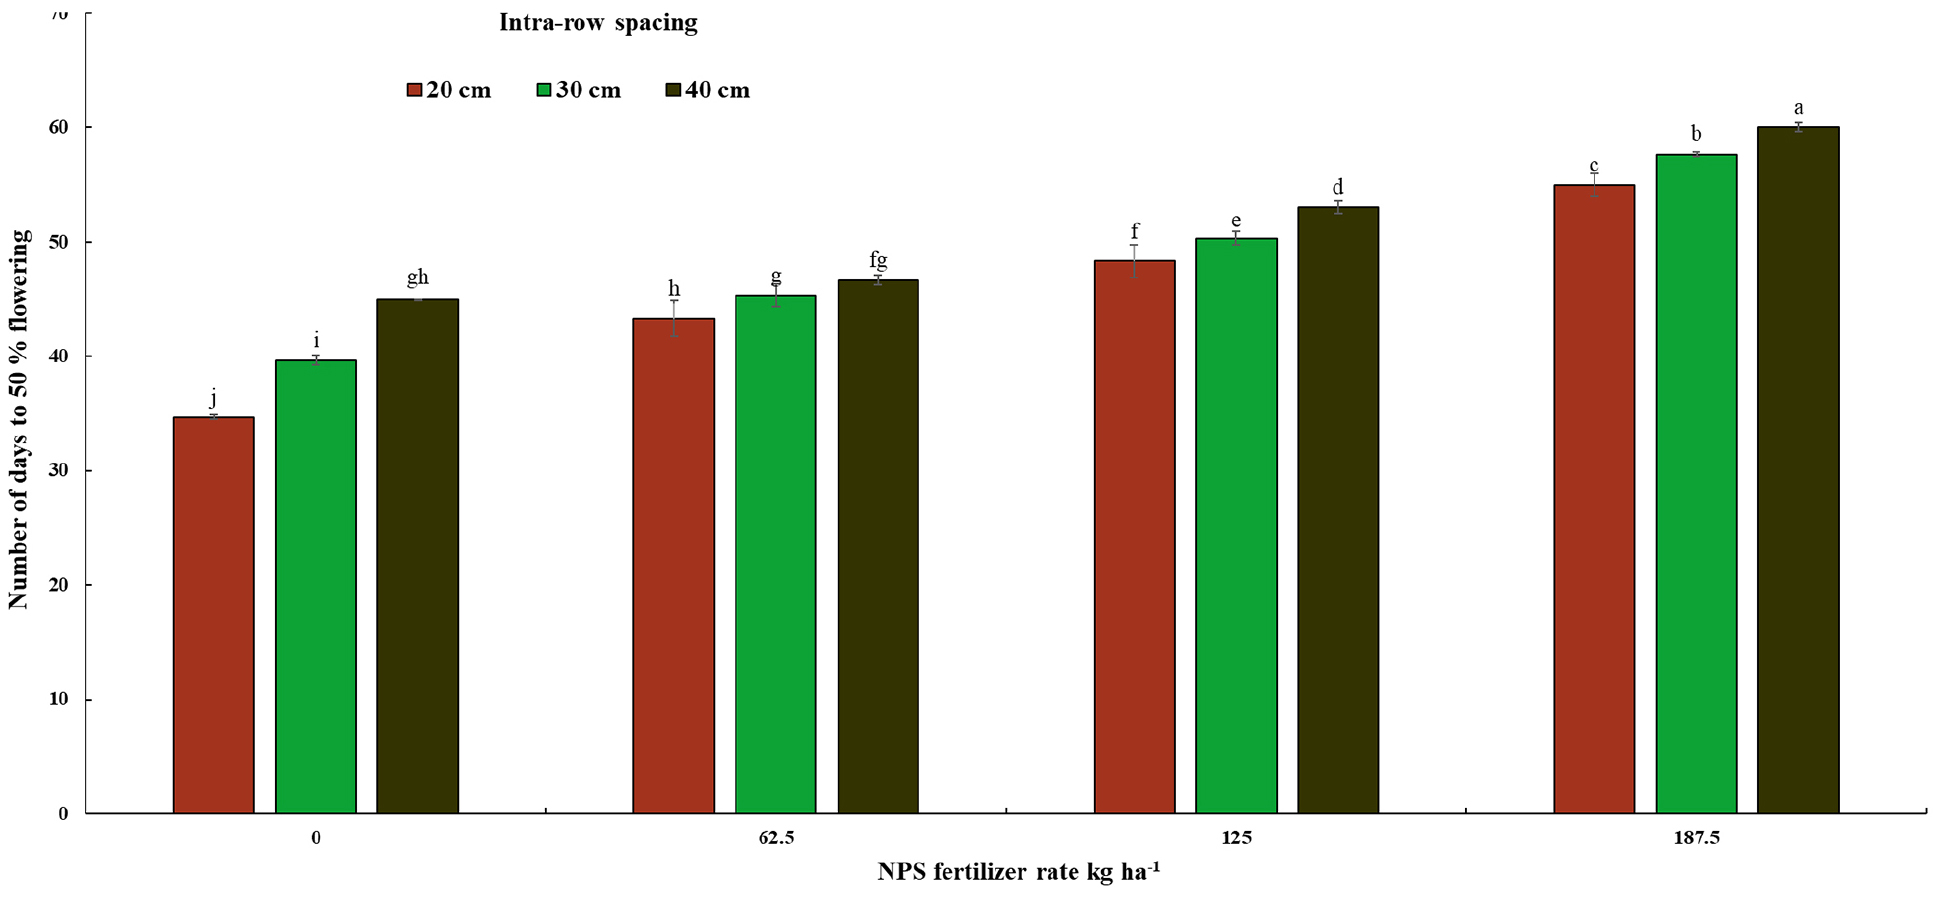
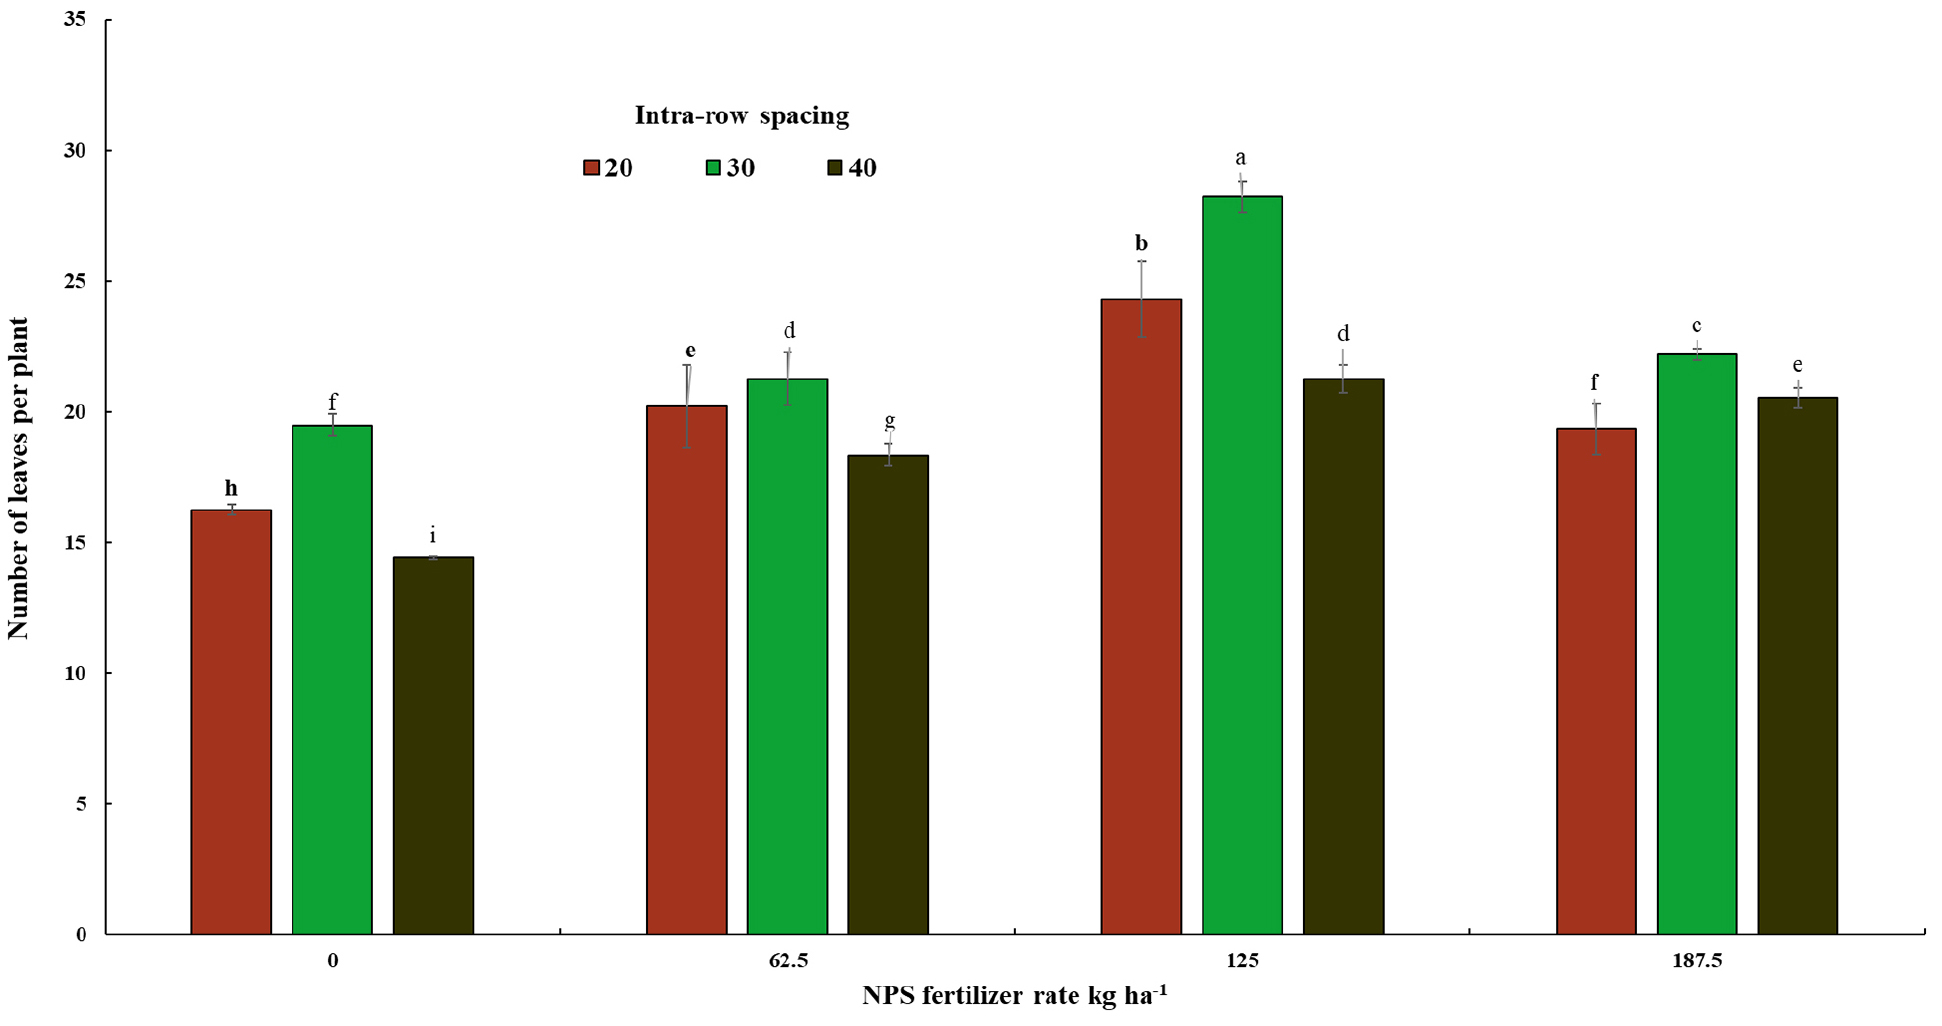
According to standard ANOVA interpretation, when the interaction effect (A×B) is not significant, the main effects of factors A and B can be interpreted independently, averaged across the levels of the other factor. Conversely, when the interaction is significant, interpretation must be based on the interaction means. In this study, Fig. 1 and 2 present variables (days to 50% flowering and number of leaves per plant) for which the interaction between plant density and NPS fertilizer rate was significant.
Crop Phenology
Crop Emergence Percentage
The results in Table 3 showed that the main effects of plant density or NPS fertilizer rate did not significantly influence crop emergence percentage. Similarly, their interaction did not have a significant effect. These findings agree with the results of Sajid et al. (2012), who reported that different levels of nitrogen and phosphorus, as well as their interaction, did not significantly affect germination percentage in okra.
Table 3
Main effect of NPS fertilizer rates and plant density on crop emergency and number of days to 50% pods setting of okra
Number of Days to 50% Flowering
Days to 50% flowering were significantly affected by both the main effects of plant density and NPS fertilizer rate, as well as by their interaction (Fig. 1). This indicates that the timing of flowering in okra is influenced by both spacing and nutrient availability, and that their combined effects play an important role in regulating phenological development. The longest duration to reach 50% flowering (60 days) was recorded from plants grown at the widest intra-row spacing of 40 cm and treated with the highest NPS fertilizer rate of 187.5 kg ha-1. In contrast, the earliest flowering (34.66 days) occurred in plots with the closest spacing (20 cm) and without NPS fertilizer application (0 kg ha-1). This suggests that under low nutrient availability and high plant competition for limited resources such as light, moisture, and nutrients, okra plants may accelerate their reproductive development as an escape strategy. These findings are consistent with the observations of Kahn et al. (2003), who noted that higher nitrogen levels tend to delay flowering and pod initiation. The delay observed in the current study under higher NPS fertilization may be attributed to the enhanced vegetative growth promoted by nitrogen, which prolongs the vegetative phase and consequently postpones the transition to flowering.
Number of Days to 50% Pod Set
The number of days to 50% pod set was significantly influenced by the main effects of NPS fertilizer rate and plant density. However, their interaction had no significant effect (Table 3). An increase in NPS fertilizer rate consistently delayed pod setting. When the fertilizer rate was raised from 0 to 125 kg ha-1 and from 0 to 187.5 kg ha-1, the days required to reach 50% pod set increased to 53.5 and 61.11 days, respectively. Early pod establishment observed under the 0 kg ha-1 NPS treatment may be attributed to nutrient, moisture, and light stress, which can trigger a stress-induced acceleration of reproductive development. Under such conditions, plants often shift from vegetative growth to earlier pod formation as a survival mechanism (Table 3). Plant population density also had a significant effect on this parameter. Increasing intra-row spacing from 20 cm to 40 cm resulted in a progressive delay in days to 50% pod set. The widest spacing (40 cm) recorded the longest duration (53.75 days), while the closest spacing (20 cm) produced the shortest time to pod set (48.6 days). The earlier pod setting at narrower spacing may be explained by intensified competition for essential resources such as nutrients and water, prompting plants to initiate reproduction sooner. In contrast, plants grown at wider spacing experience less competition and tend to remain longer in the vegetative phase (Table 3).
Growth parameters
Plant Height (cm)
Plant height was significantly influenced by the main effects of NPS fertilizer rate and plant density, while their interaction did not show a significant effect (Table 4). A clear trend was observed in relation to plant spacing: plant height increased as intra-row spacing decreased. In other words, plants grown at closer spacing were taller than those grown at wider spacing (Table 4). This result is consistent with the findings of Haile et al. (2016), who reported that reducing both intra-row and inter-row spacing led to increased plant height. The increased height under narrower spacing likely results from competition for sunlight, prompting plants to elongate in order to capture available light more efficiently.
Table 4
Main effect of NPS fertilizer rates and plant density on okra growth parameters
Length of the Pod-bearing Zone
The length of the pod-bearing zone was significantly influenced by the main effects of plant density and NPS fertilizer rate. However, their interaction did not produce a statistically significant effect. (Table 4). This indicates that spacing and nutrient supply independently contributed to variations in pod-bearing zone length, but their combined influence was not synergistic.
Number of Branches per Plant
The number of branches per plant was significantly affected by the main effects of NPS fertilizer rate and plant density, while the interaction effect was not significant (Table 4). The highest number of branches (2.90) was obtained from plants receiving 125 kg NPS ha-1, whereas the control treatment (0 kg ha-1) produced the fewest branches (2.28). The increased number of branches under higher NPS rates may be attributed to improved nutrient availability. The combined nutrients in NPS fertilizer promote protein and carbohydrate synthesis, enhancing cell division and tissue development. Sulfur, a component of NPS, plays a vital role in amino acid formation, chlorophyll synthesis, and enzymatic activity, which collectively support vigorous vegetative growth. This may explain the greater branching observed under higher NPS levels. These findings align with Ambare et al. (2005), who reported significant increases in plant height and branch number with increasing nitrogen levels.
Number of Leaves per Plant
The number of leaves per plant was significantly affected by the main effects of plant density and NPS fertilizer rate as well as their interaction (Fig. 2). The lowest leaf number was recorded under the 0 kg NPS ha-1 treatment combined with the widest spacing (40 cm), showing that both nutrient deficiency and low plant population reduced leaf production (Fig. 2). These results agree with Shiban (2009), who observed a substantial increase in leaf number with higher nitrogen application and a significant reduction in leaf number at wider plant spacing. Additional evidence from Dehigaspitiya et al. (2016) demonstrated that sulfur application significantly improved leaf length and width in okra compared with untreated plants. Similarly, Haile et al. (2016) reported increases in leaf size as sulfur concentration increased. Together, these findings confirm that both nitrogen and sulfur, key components of NPS fertilizer, play crucial roles in promoting leaf development.
Yield and yield components
Number of Green Pods per Plant
The number of green pods per plant was significantly affected by the main effects of NPS fertilizer rate and plant density. However, the interaction between these factors was not significant (Table 5). The highest number of green pods per plant was recorded under the 125 kg NPS ha-1 treatment, consistent with the findings of Ambare et al. (2005), who reported that moderate nitrogen levels optimized pod production in okra. In contrast, the highest NPS rate (187.5 kg ha-1) produced the lowest number of pods (12.45), suggesting that excessive nutrient supply may promote luxuriant vegetative growth at the expense of reproductive performance (Table 5).
Length of Green Pods (cm)
Green pod length was significantly influenced by the main effects of NPS fertilizer rate and plant density, while their interaction showed no significant effect (Table 5). The application of 125 kg NPS ha-1 resulted in the longest pod length, indicating that this rate supplied the optimal level of combined nutrients required for pod elongation. This finding is in agreement with Gayathri and Reddy (2013) and Mal et al. (2013), who noted that integrated nitrogen, phosphorus, and sulfur fertilization improved pod length in okra. Plant density also influenced pod length, with 30 cm intra-row spacing producing the longest pods, while the widest spacing (40 cm) resulted in the shortest pods (Table 5). This aligns with the observations of Amanga (2014), who reported that appropriate spacing enhances plant growth and resource utilization, thereby improving pod morphology.
Yield of Green Pods per Plant (kg)
The main effects of NPS fertilizer rate and plant density significantly affected green pod yield per plant, while their interaction remained non-significant (Table 5). The highest yield per plant (0.46 kg) was obtained under the 125 kg NPS ha-1 treatment, which was significantly greater than the yield under the 62.5 kg ha-1 treatment. The control plot (0 kg NPS ha-1) produced the lowest yield (0.27 kg per plant). The superior performance under the 125 kg ha-1 rate indicates that this nutrient level optimizes vegetative and reproductive growth balance, thereby enhancing pod formation and overall productivity.
The highest yield potential in okra can be achieved when an optimal and well-balanced nutrient supply is provided to the productive structures of the crop. Adequate levels of sunlight, moisture, and nutrients promote vigorous growth and efficient partitioning of assimilates, which ultimately enhances pod production. In this study, the 125 kg NPS ha-1 treatment appeared to provide the most balanced nutrient availability for pod formation (Table 5). These results agree with Sajid et al. (2012), who reported that nitrogen and phosphorus significantly increased pod number per plant. Similarly, Parmar et al. (2016) and Paththinige et al. (2008) demonstrated that appropriate wider spacing improves okra pod production by reducing competition and improving resource allocation.
Green Pod Yield (t ha-1)
The main effects of NPS fertilizer rate and plant density significantly influenced green pod yield (t ha-1), while the interaction effect was not significant (Table 5). The highest yield (15.95 t ha-1) was obtained from the 125 kg NPS ha-1 treatment, which was significantly superior to the 62.5 kg and 187.5 kg NPS ha-1 treatments as well as the control. Conversely, the 187.5 kg NPS ha-1 treatment resulted in the lowest yield (7.20 t ha-1). The decline in yield at the highest fertilizer rate suggests that excessive NPS may promote vegetative growth at the expense of reproductive development, thereby suppressing pod production. The 125 kg NPS ha-1 rate appears to provide the optimal nutrient balance for maximizing okra pod yield. These findings are consistent with Firoz (2009), who reported that nitrogen and phosphorus application enhanced okra productivity. Similar observations were made by Amanga (2014) and Sharma and Prasad (1973), who noted that nitrogen application up to an optimal level increased fresh pod yield and crude protein content.
Okra required multiple harvests due to its continuous fruiting habit. In the present study, the first harvest produced higher yields than the second. When 125 kg NPS ha-1 was applied, green pod yields of 9.13 t ha-1 and 6.82 t ha-1 were obtained in the first and second harvests, respectively. These results are comparable to those of Zibelo et al. (2016), who reported green pod yields of 6.09 t ha-1 and 4.65 t ha-1 at 30 cm intra-row spacing during sequential harvests.
Fresh Weight of Pods per Plant (g)
Fresh pod weight per plant was significantly affected by the main effects of NPS fertilizer rate and plant density, while their interaction was not significant (Table 5). The highest fresh pod weight (463.46 g) was recorded under the 125 kg NPS ha-1 treatment, whereas the lowest (271.91 g) was recorded under the 187.5 kg NPS ha-1 treatment. This further supports the conclusion that 125 kg NPS ha-1 provides the optimal nutrient supply for pod development. The results corroborate the findings of Anwar et al. (2016), who reported significant improvement in tender pod weight with nitrogen fertilization. Plant density also had a notable effect. The heaviest pod fresh weight per plant (393.78 g) obtained at 30 cm spacing, which was significantly higher than the weights recorded at 20 cm (345.65 g) and 40 cm (313.78 g). The increased fresh weight at 30 cm spacing is likely associated with improved balance between resource availability and competition. Conversely, the wider 40 cm spacing produced fewer pods per plant, resulting in lower total pod weight. These findings are consistent with Ekwu and Nwokwu (2012), who observed that narrow spacing produced heavier pod weights, while wider spacing resulted in lighter pods.
Dry Weight of Pods per Plant (g)
Dry pod weight per plant was significantly influenced by the main effects of plant density and NPS fertilizer rate, while their interaction effect was not significant (Table 5). The highest dry pod weights were obtained from the 125 kg NPS ha-1 and 62.5 kg NPS ha-1 treatments, which produced 309.00 g and 264.47 g per plant, respectively. In contrast, the lowest dry pod weight (181.48 g) was recorded under the highest fertilizer rate of 187.5 kg NPS ha-1. This reduction may be attributed to excessive nitrogen and sulfur promoting vegetative growth over reproductive development, ultimately reducing pod development and total dry matter. The superior dry pod weight observed at 125 kg NPS ha-1 indicates that this rate supplied the optimal nutrient balance for pod formation and dry matter accumulation. The results align with findings of Anwar et al. (2016), who reported that nitrogen application significantly increases pod weight, particularly when supplied at optimal levels. Plant density also had a clear effect. The highest dry pod weight (262.53 g per plant) occurred at 30 cm intra-row spacing, whereas the lowest (209.34 g) was recorded at the widest spacing of 40 cm (Table 5). Lower pod dry weights at wider spacing could be due to reduced plant competition, leading to fewer pods and thus lower cumulative dry matter. These findings concur with Ekwu and Nwokwu (2012), who reported that pod weight decreased as spacing increased, with the closest spacing producing the heaviest pods.
Table 5
Main effect of NPS fertilizer rates and plant density on yield and yield components of okra
Data are presented as a mean of ten replicates ± standard error. Different letters on the bars indicate significant differences between treatments with LSD test at p & 0.05. NGPPP = Number of green pods per plant, LGP = Length of green pod, GPYPP = Green pod yield per plant in kilograms, GPY (t ha-1) = Green pod yield in tons per hectare, PFWP = Fresh weight of the pod per harvest plant in grams, PDWP Dry weight of the pod per plant in grams.
Crop Stand
Crop stand at final harvest was significantly affected by the main effects of NPS fertilizer rate and plant density, while their interaction was not significant (Table 6). The highest crop stand was recorded under the 125 kg NPS ha-1 treatment, while the lowest was observed at the highest fertilizer rate of 187.5 kg ha-1. Notably, the crop stand under 187.5 kg NPS ha-1 was statistically similar to the control (0 kg ha-1), suggesting that excessive fertilization may adversely influence plant survival or vigor. Plant density had an even more pronounced effect. The highest crop stand (45.50 plants) was obtained at the narrowest spacing (20 cm), whereas significantly fewer plants remained at 30 cm (28.08 plants) and 40 cm (16.67 plants) intra-row spacing. This pattern reflects the direct relationship between initial planting density and final plant count. The minimal crop stand at 40 cm spacing corresponds to fewer plants being established initially, consistent with observations by Zibelo et al. (2016).
Table 6
Main effect of NPS fertilizer rates and plant density on okra crop stand
| Treatment | Crop stand |
| NPS fertilizer rate (kg ha-1) | |
| 0 | 29.00c |
| 62.5 | 30.67b |
| 125 | 33.11a |
| 187.5 | 27.56c |
| LSD (0.05) | 1.75 |
| Intra-row spacing (cm) | |
| 20 | 45.50a |
| 30 | 28.08b |
| 40 | 16.67c |
| LSD (0.05) | 1.51 |
Correlation Analysis
To assess the relationships among phenological traits, growth parameters, and yield components of okra, a correlation analysis was conducted based on the response to NPS fertilizer rate and plant density (Fig. 3). The results revealed that most traits exhibited strong and significant associations with okra yield. A highly significant positive correlation was observed between the length of the pod-bearing zone and plant height, as well as with days to 50% flowering and days to 50% pod set. This indicates that plants exhibiting taller growth and extended pod-bearing zones tended to flower and set pods later, reflecting coordinated vegetative and reproductive development. The number of branches per plant, number of leaves per plant, and number of pods per plant also showed strong positive correlations with green pod yield per plant (r = 0.66). This implies that increases in vegetative growth, manifested as more branches and leaves, directly contribute to improve reproductive performance and pod production. Similarly, green pod length displayed a strong positive association with number of leaves (r = 0.51), number of branches (r = 0.60), and number of pods per plant (r = 0.77). These results suggest that vigorous vegetative growth promotes better pod development.
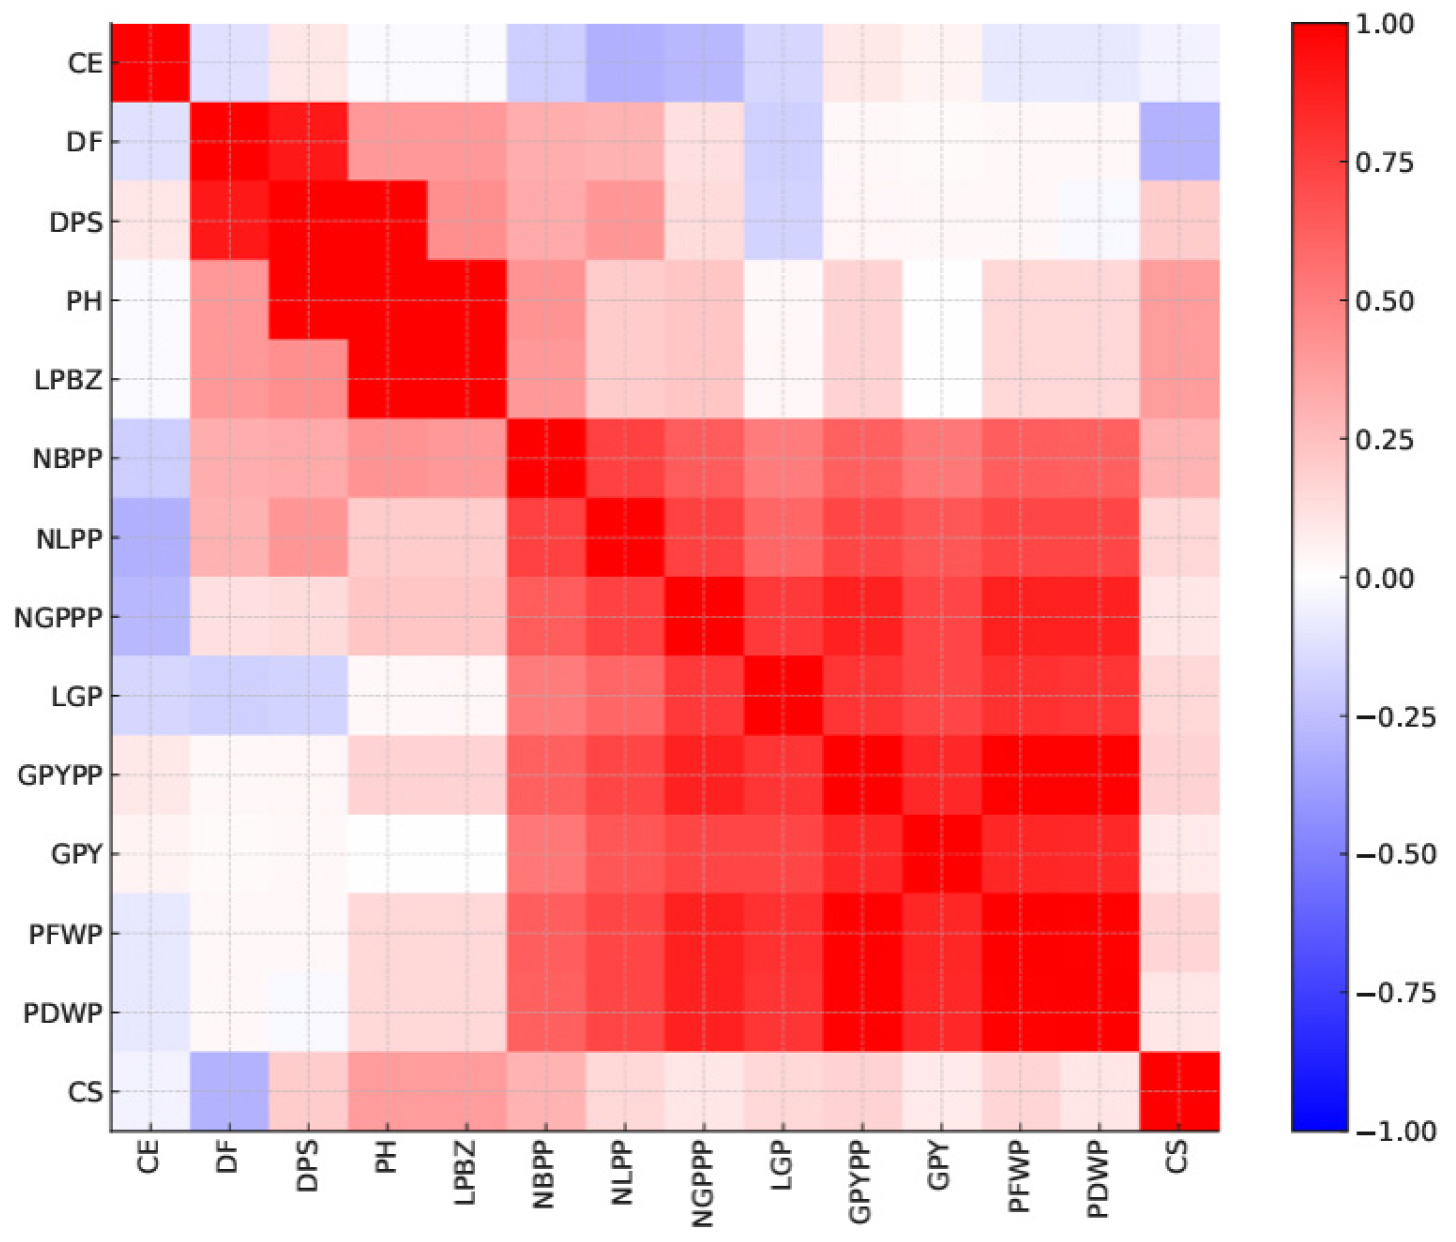
Fig. 3.
Correlation heat map among different phenology, growth and yield parameters of okra. CE = Crop emergence percentage, DF = Number of days to 50% flowering, DPS = Number of days to 50% pod set, PH = Plant height, LPBZ = Length of pod-bearing zone, NBPP = Number of branches per plant, NLPP = Number of leaves per plant, NGPPP = Number of green pods per plant, LGP = Length of green pod, GPYPP = Green pod yield per plant in kilogram, GPY (t ha-1) = Green pod yield in ton per hectare, PFWP = Pod fresh weight per plant in grams, PDWP = Pod dry weight per plant in grams. CS = Crop stand.
Overall, green pod yield per plant demonstrated significant positive correlations with key yield components (number of branches, number of leaves, pod length, and number of pods per plant) while green pod yield (t ha-1), fresh pod weight per plant, and dry pod weight per plant were all strongly correlated with these variables. A particularly strong positive correlation (r = 0.99) was found between fresh pod weight and dry pod weight per plant, indicating that an increase in fresh pod mass leads to a proportional increase in dry matter accumulation. This relationship reinforces the importance of pod biomass accumulation in determining final green pod yield.
Summary and Conclusion
This study showed that both NPS fertilizer rate and plant density significantly affected the growth, phenology, and yield of okra. Phenological data revealed that the longest time to 50% flowering (60 days) occurred at 40 cm spacing with 187.5 kg NPS ha-1, while the shortest duration (34.66 days) was recorded at 20 cm spacing with no fertilizer. Days to 50% pod setting followed a similar trend, with the greatest delay (53.75 days) at the widest spacing (40 cm). Growth traits responded strongly to fertilizer and spacing. The tallest plants (62.44 cm) were obtained with 187.5 kg NPS ha-1, whereas the control produced the shortest (49.33 cm). Higher plant density also promoted height, with 20 cm spacing producing the tallest plants. Branch and leaf production increased with nutrient supply and moderate spacing, peaking at 125 kg NPS ha-1 and 30 cm spacing.
Yield components varied accordingly. The longest pods (19.03 cm) were produced under 125 kg NPS ha-1, while the shortest (15.72 cm) occurred at 187.5 kg NPS ha-1. The lowest pods per plant (13.32) were recorded at 40 cm spacing. Crop stand was highest at 125 kg NPS ha-1 and under the narrowest spacing (20 cm), and lowest at 187.5 kg NPS ha-1 and 40 cm spacing. Overall, the combination of 125 kg NPS ha-1 and 30 cm intra-row spacing consistently supported better vegetative growth and the highest pod yield of the Amola okra variety under Jimma conditions. This regime appears optimal for maximizing productivity, though multi-location and multi-season research is needed to further validate these recommendations.
