


Introduction
Materials and Methods
Factors for determining the tolerable soil loss limit
Estimation of Ks and KUSLE
Results and Discussion
Estimation results of Ks and KUSLE
TSLL determination results
Conclusion
Introduction
Soil erosion generally occurs in the topsoil layer, corresponding to approximately 30 cm from the surface (Oh et al., 2017). Topsoil contains abundant organic matter and plays an important role in ecosystem maintenance. When eroded soil flows into water bodies, the risk of turbidity and eutrophication increases, necessitating management from both resource conservation and environmental perspectives. South Korea’s steep terrain and the seasonal concentration of rainfall during summer make soil erosion management particularly critical (Jung et al., 2015).
In response, the Ministry of Environment enacted the Public Notice on Current Status of Topsoil Erosion (hereafter “the Notice”) in 2012 based on the Soil Environment Conservation Act (ME, 2012). The Notice employs the Universal Soil Loss Equation (USLE) (Wischmeier and Smith, 1965, 1978) and consists of a preliminary survey (modeling) and a field survey (monitoring).
The preliminary survey estimates annual soil loss (Mg/ha/yr) across the entire country using precipitation data and geographic information within the USLE framework. Sites where the estimated losses exceed 50 Mg/ha/yr are selected for field investigation. This overall framework is systematic (Woo et al., 2024).
However, Woo et al. (2024) indicated that reapplying the USLE in field surveys is unnecessary because actual soil loss is directly measured. They also identified a key limitation: although the preliminary survey has a clear site-selection threshold, no evaluation standard exists for interpreting field survey results. They proposed using a watershed-scale suspended solids criterion (25 mg/L; WAMIS, 2018) as a reference; however, applying a water quality concentration standard to soil mass loss quantities is problematic. Furthermore, the parcel-level preliminary survey is inconsistent with a watershed-level field assessment.
These findings suggest that a criterion is needed to evaluate the severity of soil loss measured at the parcel-level, as in the current field survey. Such a criterion must be applicable to a wide range of soil types to enable reliable severity assessment at any location across South Korea. Therefore, this study evaluates the applicability of a method that determines the Tolerable Soil Loss Limit (TSLL) using only general soil attributes.
Materials and Methods
Factors for determining the tolerable soil loss limit
USDA (1999) proposed TSLLs for three soil groups: Group 1 consists of soils that permanently restrict crop root growth; Group 2 includes soils that affect roots but do not cause permanent productivity loss; and Group 3 comprises soils where limitations can be overcome through natural processes or management practices.
Mandal and Sharda (2011) proposed a method to classify soils into these groups based on five attributes: infiltration rate (cm/hr), bulk density (BD) (Mg/m3), USLE soil erodibility factor (ton・acre・hr/hundreds of ft・tonf・in) (KUSLE), pH, and soil organic carbon (SOC) (%). Abebe et al. (2025) refined the method by substituting saturated hydraulic conductivity (Ks, cm/hr) for infiltration rate. In both approaches, each attribute is assigned a score (Table 1), and the weighted sum Q defines the soil group. The weights for Ks, KUSLE, pH, SOC, and BD are 0.35, 0.25, 0.15, 0.15, and 0.10, respectively (Abebe et al., 2025; Mandal and Sharda, 2011). Although the minimum Ks range in the original method is 0.5-1.0 cm/hr, this study applied a single category of less than 1.0 cm/hr.
Table 1.
Scoring criteria for five soil attributes used in TSLL determination (adapted from Abebe et al., 2025; Mandal and Sharda, 2011)
| Attribute (unit) | Score 1.0 | Score 0.8 | Score 0.5 | Score 0.3 | Score 0.2 |
| Bulk density (Mg/m3) | < 1.4 | 1.40-1.47 | 1.48-1.55 | 1.56-1.63 | ≥ 1.63 |
| Ks (cm/hr)* | ≥ 5.0 | 3.5-5.0 | 2.0-3.5 | 1.0-2.0 | < 1.0 |
| KUSLE** | < 0.10 | 0.10-0.29 | 0.30-0.49 | 0.50-0.69 | ≥ 0.70 |
| pH |
6.5-7.5 |
6.0-6.5 7.5-8.0 |
5.5-6.0 8.0-8.5 |
5.0-5.5 8.5-9.0 |
< 5.0 > 9.0 |
| SOC (%) | ≥ 1.50 | 1.00-1.50 | 0.75-1.00 | 0.50-0.75 | < 0.50 |
| Weight | BD: 0.10; Ks: 0.35; KUSLE: 0.25; pH: 0.15; SOC: 0.15 | ||||
*Original minimum Ks range is 0.5-1.0 cm/hr (Abebe et al., 2025); this study combined both lowest categories into < 1.0 cm/hr.
The Q score was used to classify soils into three groups, and the TSLL was determined by Q group and effective soil depth (Table 2). In this study, topsoil depth was used as a proxy for effective soil depth.
Heuktoram provided the particle size distribution, pH, and SOC for 405 soil series, but the measured BD was available for only 252. While KUSLE can be estimated from the Heuktoram data, neither the infiltration rate nor Ks are directly provided. Saxton and Rawls (2006) proposed a pedotransfer function to estimate Ks from sand, clay, organic matter, and BD. Therefore, in this study, the TSLL method was applied to 252 soil series for which measured BD was available.
Table 2.
Tolerable soil loss limits (Mg/ha/yr) by Q group and topsoil depth (adapted from Abebe et al., 2025; Mandal and Sharda, 2011)
| Topsoil depth (cm) | Group I (Q < 0.33) | Group II (0.33 ≤ Q < 0.66) | Group III (Q ≥ 0.66) |
| 0-25 | 2.5 | 2.5 | 7.5 |
| 25-50 | 2.5 | 5.0 | 7.5 |
| 50-100 | 5.0 | 7.5 | 10.0 |
| 100-150 | 7.5 | 10.0 | 12.5 |
| > 150 | 12.5 | 12.5 | 12.5 |
Estimation of Ks and KUSLE
The Ks estimation method of Saxton and Rawls (2006) consists of five steps using decimal fractions of sand (S), clay (C), organic matter (OM = SOC × 1.724), and BD (g/cm3). Step 1 estimates water content at 1500 kPa (θ1500t, θ1500; Eqs. (1), (2)). Step 2 estimates water content at 33 kPa (θ33t, θ33; Eqs. (3), (4)). Step 3 covers the saturation-33 kPa range (θ(S-33)t, θS−33; Eqs. (5), (6)). Step 4 corrects for the saturated water content and BD (Eqs. (7), (8)). Step 5 defines the B coefficient and Ks (Eqs. (9), (10)):
KUSLE was calculated using the equation of Williams and Renard (1983) (Eq. (11)), as applied by Abebe et al. (2025). The equation uses Sa (sand, %), Si (silt, %), Cl (clay, %), SOC (%), and SN = 1 − Sa/100:
Results and Discussion
Estimation results of Ks and KUSLE
Ks was estimated for all 252 soil series. The majority (181 series, 71.9%) had Ks values below 1.0 cm/hr (Table 3), receiving a score of 0.2 and a weighted score of 0.070 (0.2 × 0.35). Twenty-one series had Ks values of 1.0-2.0 cm/hr, receiving a score of 0.3 and a weighted score of 0.105.
Table 3.
Distribution of Ks scores among 252 soil series
| Ks range (cm/hr) | Score | Soil series (n) | Proportion (%) |
| < 1.0 | 0.2 | 181 | 71.9 |
| 1.0-2.0 | 0.3 | 21 | 8.3 |
| 2.0-3.0 | 0.5 | 18 | 7.1 |
| 3.0-5.0 | 0.8 | 12 | 4.8 |
| ≥ 5.0 | 1.0 | 20 | 7.9 |
| Total | — | 252 | 100.0 |
Although KUSLE has five scoring categories, the 252 series fell into only three of these categories. Three series exhibited KUSLE values below 0.10, while the remaining series were distributed nearly equally between the 0.10-0.29 and 0.30-0.49 ranges (Table 4). The three highest-scoring series (score of 1.0) received a weighted KUSLE score of 0.250, whereas scores of 0.8 and 0.5 yielded weighted scores of 0.200 and 0.125, respectively.
Table 4.
Distribution of KUSLE scores among 252 soil series
| KUSLE range* | Score | Soil series (n) | Proportion (%) |
| < 0.10 | 1.0 | 3 | 1.2 |
| 0.10-0.29 | 0.8 | 130 | 51.6 |
| 0.30-0.49 | 0.5 | 119 | 47.2 |
| 0.50-0.69 | 0.3 | 0 | 0.0 |
| ≥ 0.70 | 0.2 | 0 | 0.0 |
| Total | — | 252 | 100.0 |
TSLL determination results
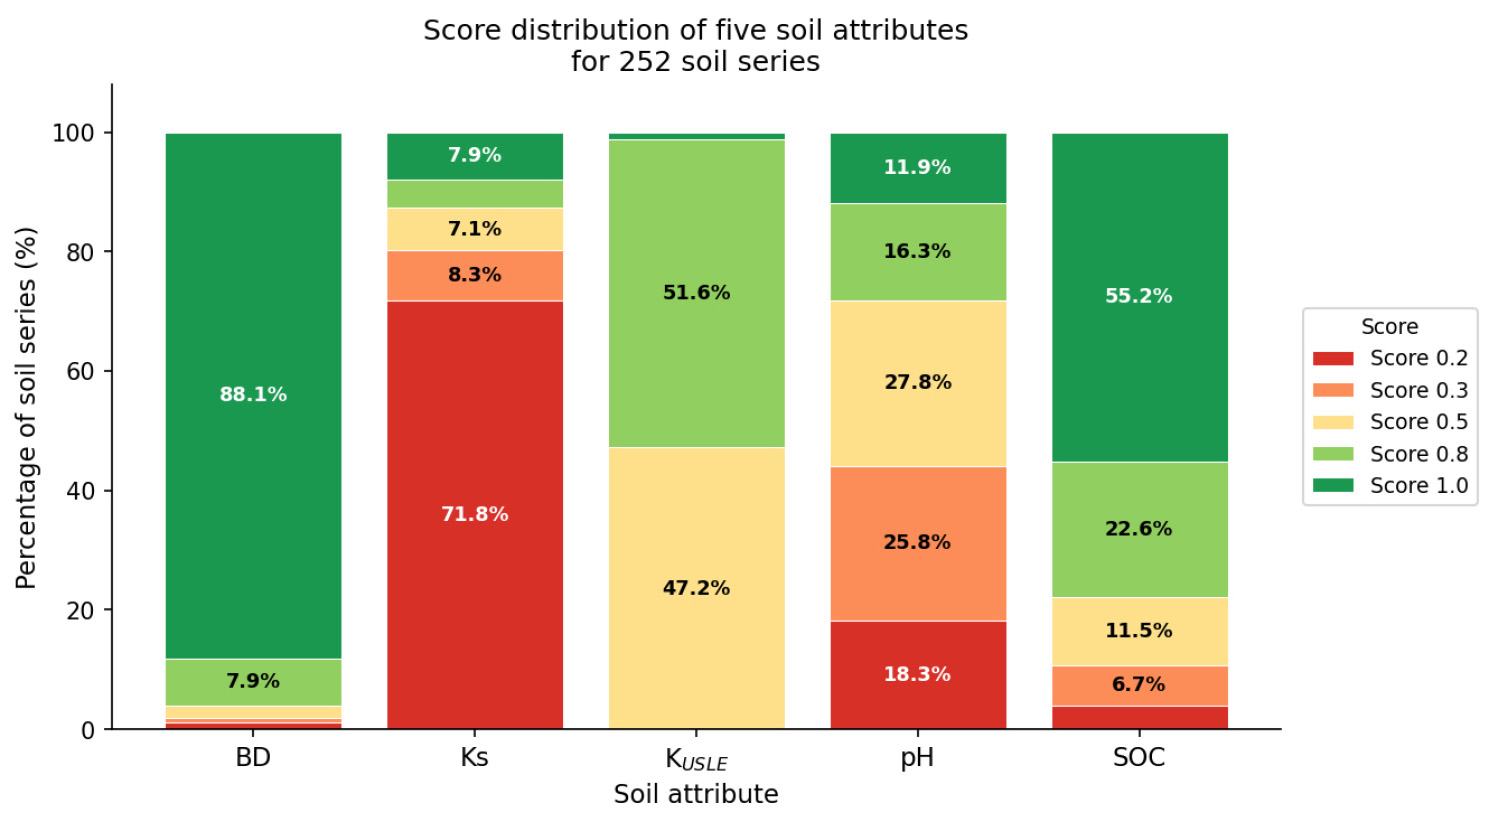
In addition to Ks and KUSLE, scores for BD, pH, and SOC were assigned by directly applying the measured Heuktoram values to the criteria listed in Table 1. A score of 1.0 was assigned to 222 series (88.1%) for BD and to 139 series (55.2%) for SOC. pH scores were distributed evenly across all five categories (Table 5).
Examining the score distributions for all five attributes (Fig. 1), BD and SOC were predominantly assigned the highest score of 1.0, whereas Ks showed the opposite pattern, with most series receiving 0.2. For KUSLE, scores of 0.5 and 0.8 each accounted for nearly half of all series, while pH showed the most uniform distribution across all five categories.
Table 5.
Score distribution for five soil attributes among 252 soil series
TSLL calculations were performed using the Ora soil series. The scores for BD (0.66 Mg/m3), Ks (0.22 cm/hr), KUSLE (0.337), pH (5.6), and SOC (5.32%) were 1.0, 0.2, 0.5, 0.5, and 1.0, respectively. The corresponding weighted scores were 0.100, 0.070, 0.125, 0.075, and 0.150, respectively, yielding Q = 0.52 (Group II). At a topsoil depth of 20 cm, the TSLL was 2.5 Mg/ha/yr (Table 6).
Table 6.
TSLL calculation for four representative South Korean soil series
This method yielded series-specific TSLL values. Ora and Teuggog both exhibited Q = 0.52 (Group II) but differed in topsoil depths, resulting in TSLL values of 2.5 and 5.0 Mg/ha/yr, respectively. Compared with Ora, Chuncheon, which shares the same topsoil depth (20 cm), received higher scores for Ks, KUSLE, and pH, yielding Q = 0.745 (Group III) and a TSLL of 7.5 Mg/ha/yr. Wolryeong had a low Ks score but high scores for pH, SOC, and KUSLE; combined with a deep topsoil (93 cm), it exhibited a TSLL of 10.0 Mg/ha/yr (Table 6).
Among the 252 series, only 2 (Yonggang and Yuha) were classified as Group I (Q < 0.33); 201 series (79.8%) were classified as Group II, and 49 series (19.4%) as Group III (Table 7).
Table 7.
Distribution of 252 soil series by Q group
| Q group | Soil series (n) | Proportion (%) |
| Group I (Q < 0.33) | 2 | 0.8 |
| Group II (0.33 ≤ Q < 0.66) | 201 | 79.8 |
| Group III (Q ≥ 0.66) | 49 | 19.4 |
| Total | 252 | 100.0 |
Regarding TSLL distribution, 168 series (66.7%) with topsoil depths of 0-25 cm in Groups I and II were assigned 2.5 Mg/ha/yr. Twenty-nine series (11.5%) with depths of 25-50 cm in Group II received 5.0 Mg/ha/yr. Fifty-four series (21.4%), comprising Group III series with depths of 0-50 cm and Group II series with depths of 50-100 cm, were assigned 7.5 Mg/ha/yr. Only Wolryeong was assigned the maximum of 10.0 Mg/ha/yr (Table 8).
Conclusion
The Notice governing soil erosion surveys in South Korea consists of a preliminary survey (modeling) and a field survey (monitoring). The preliminary survey employs a rational prediction method with clearly defined threshold criteria, whereas the field survey requires revision of both its procedures and evaluation standards.
The field survey aims to measure actual soil loss, and the results must represent normal-year conditions. The methods of Bora et al. (2008) and Singh et al. (2014), as recommended by Woo et al. (2024), might be used to verify this. Once a representative measurement is obtained, a severity criterion is needed. Mandal and Sharda (2011) and Abebe et al. (2025) argued that because soil is a nonrenewable resource, the TSLL must be established before soil conservation strategies can be developed. The Notice, which is grounded in the Soil Environment Conservation Act, aligns with this rationale.
The TSLL determination method uses BD (Mg/m3), Ks (cm/hr), KUSLE, pH, SOC (%), and topsoil depth (cm). Although applied here using the Heuktoram data, it can also be implemented through onsite soil analysis during field surveys. By integrating the five attributes and topsoil depth, the TSLL is not biased toward any single soil condition. In the 252 series analyzed, the TSLL varied according to topsoil depth, Ks, KUSLE, and pH.
Based on the findings of Woo et al. (2024) and the present study, the following revisions are proposed for the field survey component of the Notice:
∙ The USLE modeling process is not required in field surveys.
∙ It is necessary to assess whether the survey period represents a normal year to ensure the reliability of results.
∙ On-site soil analysis should determine the TSLL, which is then compared with the measured soil loss to evaluate the severity of erosion.
The field survey procedure proposed in this study is as follows:
1. Measure bulk density (Mg/m3), infiltration rate (or saturated hydraulic conductivity) (cm/hr), pH, soil organic carbon (%), and topsoil depth (cm) at the survey site.
2. Measure sand content (%), silt content (%), and clay content (%), and calculate KUSLE.
3. Calculate the Q score and determine the TSLL.
4. Survey annual soil loss.
5. Determine whether the survey period represents a normal year using precipitation data from the survey site or a nearby station of the Korea Meteorological Administration.
6. Decide on survey continuation:
6-1. If the survey period does not represent a normal year, continue the field survey.
6-2. If the survey period represents a normal year and the measured soil loss does not exceed the TSLL, conclude the field survey for the site.
6-3. If the survey period represents a normal year and the measured soil loss exceeds the TSLL, designate the site as a severe soil erosion area.
However, this study has limitations in addressing the effects of climate change and land use change on soil erosion assessment. Shifts in rainfall patterns due to climate change may alter the baseline for normal-year determination, potentially affecting the reliability of Step 5 in the proposed procedure. Furthermore, rapid land use changes can intensify soil loss rates, which may require more frequent reassessment of survey sites. Future studies should incorporate these dynamic factors to further develop the soil erosion evaluation framework under the Notice.