


Introduction
Materials and Methods
Plant Materials and High-Temperature Treatment during Fruit Development
RNA Extraction and Quality Assessment
Selection of Candidate Reference and Target Genes
Primer Design and In Silico Specificity Assessment
One-Step qRT-PCR Conditions
Evaluation of Amplification Efficiency and Melting Specificity
Expression Stability Evaluation of Candidate Reference Genes
Agreement Analysis between Reference-Gene Normalization Strategies
Results and Discussion
In Silico and Experimental Reassessment of Literature-Derived Primers
Selection of RNA-seq-Based Candidates and Final qRT-PCR Assays
Expression Characteristics and Stability of Candidate Reference Genes
Determination of the Optimal Number and Combination of Reference Genes
Agreement between Two- and Three-Reference-Gene Normalization Strategies
Introduction
The frequency and intensity of high-temperature extremes have increased with climate change and are projected to intensify with global warming (IPCC, 2021). In apples (Malus × domestica Borkh.), growing-season temperature conditions can affect vegetative growth and fruit quality in the current season and reproductive development in the following season. In particular, high temperatures can inhibit anthocyanin accumulation and consequently reduce red coloration in apples. Moreover, summer temperature conditions can alter the timing and extent of shoot growth and flower bud formation, thereby affecting flowering in the subsequent year (Bu et al., 2022; Heide et al., 2020; Zhu et al., 1997). In addition to transcriptome analysis, reliable quantification of key gene expression is required to elucidate the molecular responses of apple trees to high-temperature conditions during fruit development.
Quantitative reverse transcription-polymerase chain reaction (qRT-PCR) is a powerful tool for validating transcriptomic results and quantifying the expression of specific genes. Reliable qRT-PCR assays require adequate target specificity and amplification efficiency, a single dominant melting peak, and no detectable amplification of NTCs; therefore, the performance of individual primer pairs should be experimentally validated before use (Bustin et al., 2025). This requirement is particularly important for apples, which contain numerous duplicated genes and paralogs, as previously reported primers may amplify multiple RefSeq transcripts or loci when evaluated against updated genome annotations (Daccord et al., 2017; Velasco et al., 2010). Thus, both in silico reassessment and experimental validation of the previously reported primers are necessary before their application.
Reference genes were used in the qRT-PCR analyses to normalize the variation in RNA input and among individual reactions; however, no reference gene was universally stable across all tissues and experimental conditions. Conventional housekeeping genes such as actin, tubulin, and glyceraldehyde-3-phosphate dehydrogenase may also exhibit variable expression depending on the tissue type, developmental stage, and stress conditions (Bowen et al., 2014; Perini et al., 2014; Yoon et al., 2020; Zhou et al., 2017). Therefore, reference genes appropriate for specific biological systems and experimental conditions should be validated in advance, and normalization using the geometric mean of multiple reference genes is recommended whenever possible (Zhou et al., 2017; Zhu et al., 2019). Although transcriptomic and gene expression studies on high-temperature responses in apples have been reported, condition-specific validation of reference genes for qRT-PCR normalization under high-temperature conditions during fruit development remains limited (Ahn et al., 2024; Bu et al., 2022).
In this study, we aimed to identify suitable reference genes and validate primer pairs for qRT-PCR analysis of ‘Fuji’ apple leaves subjected to high-temperature treatment during fruit development and to determine an optimal normalization strategy. Previously published primer pairs were reassessed using the current apple genome, and additional candidate genes showing stable expression were identified from the RNA-seq data. The amplification efficiency, melting specificity, and NTC amplification were evaluated for the final candidate primer pairs, and expression stability was compared using geNorm, NormFinder, and BestKeeper. In addition, the agreement of target gene quantification obtained using the two- and three-reference gene normalization strategies was evaluated.
Materials and Methods
Plant Materials and High-Temperature Treatment during Fruit Development
Three-year-old ‘Fuji’ apple trees grown in 75-L pots were used in this study. The experiment was conducted in natural-light greenhouses at the National Institute of Horticultural and Herbal Science, Wanju-gun, Jeonbuk-do, Republic of Korea. Temperature treatments were applied from June 10 to September 30, 2025, approximately 40 days after full bloom.
For the control treatment, the 10-day mean daily maximum and minimum temperatures were derived from the 30-year climatological norms for Jeonju. Based on these values, greenhouse temperature setpoints were updated at 2-h intervals to reproduce the diurnal temperature cycle. The two high-temperature treatments were controlled to maintain target temperature offsets of +3°C and +6°C relative to the control. Although greenhouse temperatures fluctuated throughout the day in response to natural solar radiation and outdoor environmental conditions, the mean daily temperature differences relative to the control during the treatment period were 3.386 ± 0.280°C for the +3°C treatment and 6.046 ± 0.340°C for the +6°C treatment.
Leaf samples were collected 10, 13, and 15 weeks after treatment (WAT). To minimize the effects of diurnal environmental variations and circadian changes on gene expression, all samples were collected using the same procedure at approximately 16:00 on each sampling date. Fully expanded mature leaves, 8-11 cm in length, with most surface trichomes absent, were used. Each biological replicate comprised three leaves collected from an individual tree. Three biological replicates were collected for each treatment and sampling time, resulting in 27 samples. All 27 samples were used for RNA-seq-based candidate reference gene screening, whereas 18 samples from the control and +6°C treatments were used for qRT-PCR-based expression stability analysis. Samples were immediately frozen in liquid nitrogen after collection and stored at -80°C until RNA extraction.
RNA Extraction and Quality Assessment
Total RNA was extracted from apple leaves using the RNeasy Plant Mini Kit (QIAGEN, Hilden, Germany), and on-column DNase digestion was performed using the RNase-Free DNase Set (QIAGEN) according to the manufacturer’s instructions. RNA concentration and purity were assessed using a Multiskan SkyHigh Microplate Spectrophotometer (Thermo Fisher Scientific, Waltham, MA, USA), and purity was evaluated based on the A260/A280 and A260/A230 ratios.
For qRT-PCR analysis, RNA from individual samples was normalized to 25 ng/µL using nuclease-free water.
Selection of Candidate Reference and Target Genes
Candidate reference genes comprised conventional housekeeping genes previously used for gene expression analysis in apples and genes showing relatively stable expression in the RNA-seq dataset generated in this study. Literature-derived candidate genes were selected from previous studies that have evaluated reference genes across different apple tissues, developmental stages, and stress conditions (Bowen et al., 2014; Espley et al., 2007; Kumar and Singh, 2015; Perini et al., 2014; Zhu et al., 2019).
RNA-seq-based candidates were screened using the 27 samples described above. RNA sequencing and primary bioinformatic analyses were performed using JSlink (Seoul, Republic of Korea). Raw reads generated by RNA-seq were deposited in the NCBI Sequence Read Archive under the BioProject accession number PRJNA1498522. The results of kallisto-based expression quantification, an expression matrix containing TMM-normalized counts, and edgeR-based differential expression analysis were used to select candidate reference genes.
To exclude genes with low expression, genes with TMM-normalized expression values ≥ 10 in all 27 samples were initially retained. Expression values were then summarized as means for nine groups defined by combinations of the three temperature treatments and three sampling times, and the coefficient of variation (CV) among the group means was calculated. Genes were selected as candidate reference genes when they met all of the following criteria: CV < 0.033, an absolute log2 fold change ≤ 0.1 between the +6°C treatment and the control at each sampling time (|log2FC| ≤ 0.1), and no significant differential expression based on edgeR analysis (FDR ≥ 0.05).
Cytosolic L-ascorbate peroxidase 2 (MdAPX2) and CONSTANS-like 6 (MdCOL6) were selected as target genes to evaluate the applicability of reference gene combinations for the quantification of genes associated with responses to high temperature during fruit development.
Primer Design and In Silico Specificity Assessment
Previously reported primer pairs were reassessed using NCBI Primer-BLAST against the current M. × domestica RefSeq RNA database (Ye et al., 2012). For each primer pair, the predicted RefSeq accession number, LOC identifier, amplicon size, and number of predicted amplification products were examined. Primer pairs predicted to amplify more than one LOC or amplicon were considered to have potential target-specificity problems.
Additional primer pairs, including redesigned assays, were generated using NCBI Primer-BLAST (Ye et al., 2012) and the PrimerQuest Tool (IDT, 2026b). The potential for the formation of self-dimers, heterodimers, and hairpins was evaluated using the OligoAnalyzer Tool (IDT, 2026a). Primer design criteria included primer lengths of 18-24 nt, predicted amplicon sizes of 90-160 bp, melting temperatures of 59-64°C, and GC contents of 34-60%. Primers were synthesized by Macrogen (Seoul, Republic of Korea).
The sequences, predicted targets, and screening outcomes of all primer pairs evaluated during the initial screening and redesign processes are presented in Table S1.
One-Step qRT-PCR Conditions
One-step qRT-PCR was performed on a LightCycler 480 Real-Time PCR System (Roche, Basel, Switzerland) using EzAmp HS One-Step RT-qPCR 2X Master Mix (ELPIS-BIOTECH, Daejeon, Republic of Korea). The final reaction volume was 10 µL and comprised 5 µL of 2X reaction buffer, forward and reverse primers, 1 µL of total RNA, and nuclease-free water.
Forward and reverse primers were each used at 0.4 µM for the cysteinyl-tRNA synthetase 2 (MdCARS2) assay. Primer concentrations of 0.3 µM each were used for polymerase-associated factor 1 (MdPAF1) and nuclear cap-binding protein subunit 2-like (MdNCBP2L), whereas 0.2 µM each was used for actin (MdACT), casein kinase II subunit beta-4 (MdCKB4), MdAPX2, and MdCOL6.
Reverse transcription was performed at 50°C for 5 min, followed by an initial denaturation step at 95°C for 3 min. The cycling parameters were 40 cycles of 95°C for 15 s and 62°C for 20 s, with fluorescence acquisition at the 62°C step. Each biological sample was analyzed using three technical replicates, and an NTC was included in each assay.
Evaluation of Amplification Efficiency and Melting Specificity
Pooled RNA was prepared by combining 300 ng of RNA from each of the 18 samples, representing three sampling times and three biological replicates from the control and +6°C treatments, yielding 5.4 µg RNA at a concentration of 57.8 ng/µL. A five-fold serial dilution series was prepared with relative concentrations of 625, 125, 25, 5, and 1.
Standard curves were generated by the linear regression of Cp values against log10-transformed relative standard concentrations. The slope, coefficient of determination (R2), and amplification efficiency of each standard curve were obtained using the Abs Quant module of LightCycler 480 software version 1.5.1.62 SP3. The amplification efficiency was calculated as follows Eq. (1):
After amplification, melting curve analysis was performed by incubation at 95°C for 5 s followed by incubation at 65°C for 1 min. Fluorescence signals were then continuously acquired as the temperature increased from 65°C to 95°C at 0.11°C/s, followed by cooling at 40°C for 30 s. Numerical melting temperature (Tm) values were obtained from the Tm Calling results generated by the LightCycler 480 Software. For visualization of melting curves, a seven-point centered moving average was applied to the raw fluorescence data, followed by calculation of -dF/dT to generate melting-peak profiles.
The final primer pairs were selected based on an integrated evaluation of amplification efficiency, linearity of the standard curve, presence of a single melting peak, and absence of NTC amplification (Bustin et al., 2025). When the standard deviation among technical replicates exceeded 0.30 Cp, the amplification and melting curves were inspected manually. When two of three technical replicates were consistent, and the remaining replicate differed from them by ≥0.5 Cp, the discrepant well was considered a technical outlier and excluded from calculation of the mean Cp value. Dilution points were excluded from standard curve calculations when Cp exceeded 35 or when fewer than two of the three technical replicates produced valid measurements. Genes were excluded, or primer pairs were redesigned when repeated NTC amplification, secondary melting peaks, unstable amplification at low template concentrations, inappropriate amplification efficiency, or multi-locus detection were observed.
Expression Stability Evaluation of Candidate Reference Genes
The expression stability of each candidate reference gene was evaluated using geNorm, NormFinder, and BestKeeper software.
For geNorm analysis, Clarida Reference Gene Finder (Clarida, 2026) was used, and Cp values for each sample were converted to relative quantities using primer-specific amplification factors (Vandesompele et al., 2002). Relative quantities (RQ) were calculated using the following Eq. (2):
where, E is the primer-specific amplification factor, Cpmin is the minimum Cp value observed for a given assay, and Cpsample is the Cp value of the corresponding sample. M values and pairwise variations Vn/Vn+1 were determined for each candidate gene. Lower M values were considered indicative of greater expression stability. The number of reference genes required for normalization was assessed using the threshold of Vn/Vn+1 < 0.15.
NormFinder analysis was performed in R version 4.6.0 using the NormFinder R script r.NormOldStab5.txt, released on January 5, 2015 (Andersen et al., 2004). Six groups were defined according to the combination of treatment and sampling time: control-10 WAT, control-13 WAT, control-15 WAT, +6°C-10 WAT, +6°C-13 WAT, and +6°C-15 WAT. Lower stability values were considered indicative of greater stability. For additional sensitivity analyses, NormFinder was performed either using two groups defined solely by temperature treatment or without predefined groups.
BestKeeper analysis was performed using BestKeeper v1 (Pfaffl et al., 2004). The mean Cp values for each biological sample were used as input, and the standard deviation (SD), coefficient of variation (CV) of the Cp values, and Pearson correlation coefficient with the BestKeeper index were calculated for each candidate gene. Genes with lower SD and CV values and higher correlation coefficients were considered more stable.
The ranks obtained from the three algorithms were summed, and genes with lower rank sums were considered to have greater overall expression stability.
Agreement Analysis between Reference-Gene Normalization Strategies
To evaluate the applicability of the final reference gene combinations, the normalized RQ values for MdAPX2 and MdCOL6 were calculated using two normalization strategies. The two-gene normalization factor (NF2) was calculated as the geometric mean of the RQ values for MdCKB4 and MdCARS2, and the three-gene normalization factor (NF3) was calculated as the geometric mean of the RQ values for MdCKB4, MdCARS2, and MdPAF1. The normalized RQ value of each target gene was obtained by dividing the relative quantity by that of NF2 or NF3 (Hellemans et al., 2007; Vandesompele et al., 2002). Normalized RQ values from the 18 individual biological samples were log2- transformed and compared directly without applying an additional calibrator.
The agreement between target gene quantities obtained using the two normalization strategies was evaluated using Pearson’s correlation coefficient and Lin’s concordance correlation coefficient (CCC) (Lin, 1989). The systematic bias between NF2 and NF3 was assessed using the Bland-Altman analysis (Bland and Altman, 1986). Differences between paired values were plotted against their means, and the mean bias and mean bias ± 1.96 standard deviations were calculated as the 95% limits of agreement. Lin’s CCC and Bland-Altman statistics were calculated in R version 4.6.0 using custom scripts.
Results and Discussion
In Silico and Experimental Reassessment of Literature-Derived Primers
Fifteen reference gene primer pairs previously reported for apple studies were reassessed against the current M. × domestica RefSeq RNA database. Primer-BLAST analysis predicted multiple RefSeq transcripts or LOCs for several primer pairs, and some assays exhibited secondary melting peaks, persistent NTC amplification, or unstable amplification curves during experimental qRT-PCR evaluation (Table S1). Among the literature-derived primer pairs, the MdACT primer pair was retained as a conventional comparator for the newly identified candidate genes. However, its predicted amplification of multiple LOCs indicated relatively low specificity for a single gene. The remaining literature-derived primer pairs were excluded from the subsequent expression stability analysis because they did not satisfy the specificity or assay quality criteria. These results demonstrate that the predicted targets of previously published primers may change as apple genome annotations are updated and additional paralogs are recognized. The observed specificity issues underscore the need to verify both predicted locus specificity and empirical amplification behavior before reusing published primer pairs for apples (Bustin et al., 2025; Daccord et al., 2017; Velasco et al., 2010; Ye et al., 2012).
Selection of RNA-seq-Based Candidates and Final qRT-PCR Assays
A total of 21 new or redesigned primer pairs, including candidates selected from the RNA-seq data and redesigned primer pairs for literature-derived genes, were evaluated. Following repeated in silico and experimental screening, the newly designed primer pairs for MdCKB4, MdCARS2, MdPAF1, and MdNCBP2L were retained as candidate reference genes (Table 1). The literature-derived MdACT primer pair was included as a conventional comparator, and MdAPX2 and MdCOL6 were used to evaluate the performance of the reference gene normalization strategies (Table 1 and Table S1).
Table 1.
Primer information for candidate reference and target genes
| Gene symbol | Gene description | In silico RefSeq / LOC | Primer sequence (5’-3’) |
Predicted amplicon size (bp)2) |
| MdCKB4 | Casein kinase II subunit beta-4 |
XM_008350667.4 / LOC103412066 |
F: CTGCGACAAGTGAGGTAAGA R: GCTCTGCAAATAGGCCAAC | 96 |
| MdCARS2 | Cysteinyl-tRNA synthetase 2 |
XM_008391047.4 / LOC103451633 |
F: GAACTGCGAATCGAATTGGAAA R: GCTCAATGCTCTCTGTAAAGAC | 95 |
| MdPAF1 | Polymerase-associated factor 1 |
XM_008350271.4 / LOC103411642 |
F: CGGCAGTTCTAACTCATGACTATT R: GAACAAGCAGGCACACAATTTA | 111 |
| MdACT | Actin |
Multiple RefSeq/ LOC hits (N = 9)1) |
F: TGACCGAATGAGCAAGGAAATTACT R: TACTCAGCTTTGGCAATCCACATC | 156 |
| MdNCBP2L |
nuclear cap-binding protein subunit 2-like |
XM_008383354.4 / LOC103444430 |
F: GAAAGAGAAGGGAGTAAACCTCAT R: AAATCTGGAACAGGAAGACGAA | 107 |
| MdAPX2 |
cytosolic L-ascorbate peroxidase 2 |
XM_008352175.4 / LOC103413735 |
F: CTGTGAGTGAGGAATACCAGAAG R: AGGACTATCGGAGCACAGT | 91 |
| MdCOL6 | CONSTANS-like 6 |
XM_008380956.4 / LOC103442188 |
F: GGGTCGATTCGTGAAGAGAAA R: CATGCCTATCTCCATCCTCTTG | 97 |
1)MdACT primer pair showed multiple RefSeq/LOC hits in NCBI Primer-BLAST; detailed predicted targets are provided in Table S1.
2)Amplicon sizes and RefSeq/LOC hits were predicted using NCBI Primer-BLAST (Ye et al., 2012).
The coefficients of determination for the standard curves of the seven final primer pairs ranged from 0.992 to 0.999, and the amplification efficiencies ranged from 85.1 to 115.6% (Table 2 and Fig. 1). Although amplification efficiencies differed among the primer pairs, high linearity was observed for all standard curves (Fig. 1A). The amplification efficiency of MdCKB4 was somewhat higher than the range commonly considered optimal; however, this assay showed high standard curve linearity and a single melting peak, and was therefore retained for subsequent analyses (Table 2 and Fig. 1). Such deviations may arise from errors introduced during serial dilution, presence of reaction inhibitors in the sample, or differences in the effective concentration range suitable for regression analysis. To account for differences in amplification efficiency among primer pairs, primer-specific amplification factors, based on the measured efficiency of each assay, were used for relative quantification.
Table 2.
Amplification characteristics of selected qRT-PCR assays
| Gene symbol |
Final primer concentration (µM) |
Amplification efficiency (%) | R2 |
Melting temperature, Tm (°C)1) | E2) |
| MdCKB4 | 0.2 | 115.6 | 0.995 | 85.93 ± 0.13 | 2.156 |
| MdCARS2 | 0.4 | 89.1 | 0.994 | 85.44 ± 0.18 | 1.891 |
| MdPAF1 | 0.3 | 94.6 | 0.999 | 80.38 ± 0.14 | 1.946 |
| MdACT | 0.2 | 85.1 | 0.992 | 81.59 ± 0.16 | 1.851 |
| MdNCBP2L | 0.3 | 99.6 | 0.999 | 80.55 ± 0.15 | 1.996 |
| MdAPX2 | 0.2 | 95.9 | 0.999 | 84.07 ± 0.17 | 1.959 |
| MdCOL6 | 0.2 | 108.6 | 0.998 | 82.47 ± 0.05 | 2.086 |
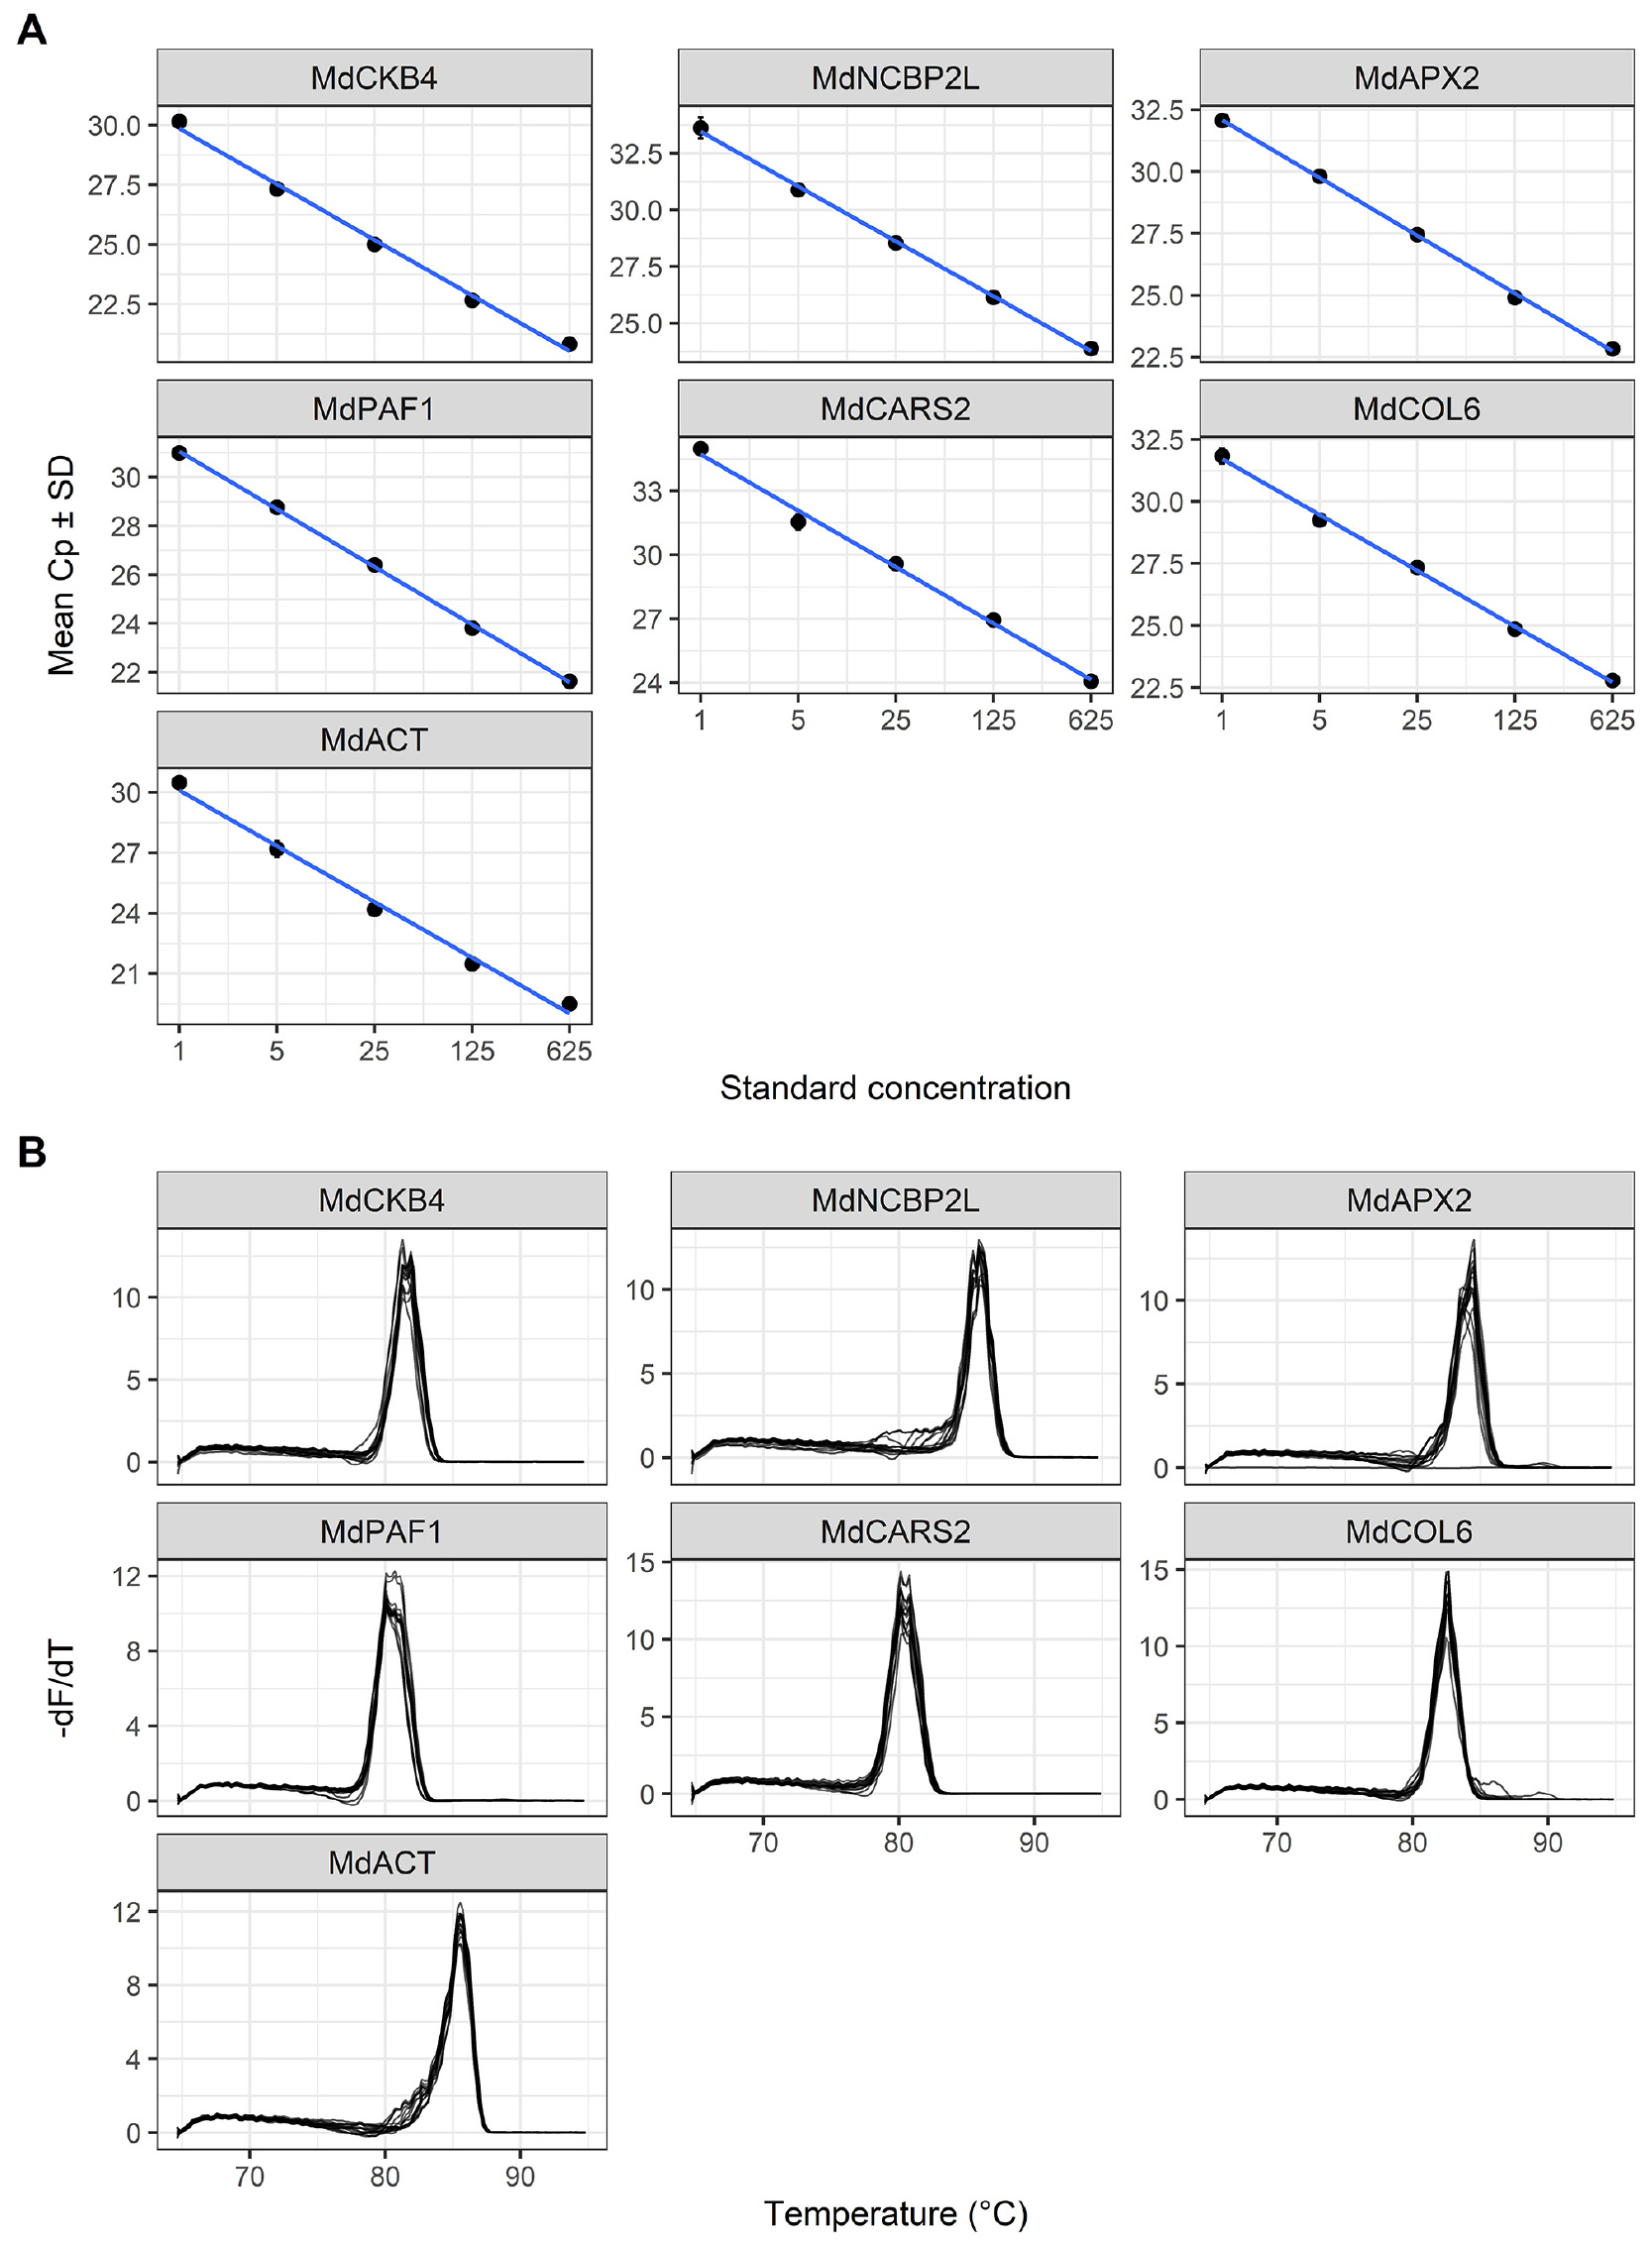
Fig. 1.
Amplification characteristics and melting specificity of the selected qRT-PCR assays. (A) Standard curves generated from fivefold serial dilutions of pooled RNA for the candidate reference genes MdCKB4, MdCARS2, MdPAF1, MdACT, and MdNCBP2L and the target genes MdAPX2 and MdCOL6. Cp values were plotted against the log10-transformed relative standard RNA concentration, and the fitted linear regression lines are shown. (B) Melting-peak profiles derived from fluorescence data collected during the melting stage after application of a seven-point centered moving average and -dF/dT transformation. Curves represent reactions across the pooled-RNA dilution series. A single dominant melting peak was observed for each selected assay. The slope, amplification efficiency, and coefficient of determination for each assay are presented in Table 2.
Expression Characteristics and Stability of Candidate Reference Genes
Cp distributions differed among the candidate reference genes across the 18 apple leaf samples (Fig. 2A). MdNCBP2L exhibited a relatively broad Cp distribution, whereas MdCKB4 and MdCARS2 exhibited comparatively limited variation across temperature treatments and sampling times (Fig. 2A). In the geNorm analysis, MdCKB4 and MdCARS2 showed the lowest M values of 0.240 and 0.255, respectively, followed by MdPAF1, MdACT, and MdNCBP2L (Table 3). In the six-group NormFinder analysis, MdCARS2 and MdCKB4 showed the lowest stability values, at 0.11 and 0.16, respectively (Table 3). In BestKeeper analysis, MdCARS2 showed the strongest correlation with the BestKeeper index (r = 0.978), followed by MdCKB4 and MdPAF1 (Table 3). When the rankings based on geNorm M values, six-group NormFinder stability values, and BestKeeper correlation coefficients were combined, MdCARS2 and MdCKB4 ranked first and second, respectively, whereas MdPAF1 ranked third (Table 3). Additional stability parameters obtained from NormFinder and BestKeeper analyses are presented in Table S2. Differences among the rankings were expected because the three algorithms used distinct statistical criteria (Andersen et al., 2004; Pfaffl et al., 2004; Vandesompele et al., 2002). Therefore, their combined ranking was used to reduce method-specific bias in reference gene selection.
MdACT showed a relatively high expression and low BestKeeper SD among the candidates; however, its correlation with the BestKeeper index and its overall stability ranking were lower than those of MdCARS2 and MdCKB4 (Table 3 and Fig. 2A). In addition, in silico analysis indicated that the MdACT primer pair could amplify multiple transcripts or loci (Tables 1 and S1). These findings indicate that reference gene suitability cannot be determined solely by high expression levels or by limited absolute variation in Cp values. Although the actin family genes have been widely used as reference genes in plant qRT-PCR studies, their expression stability and primer specificity should be individually validated under specific stress conditions, including high-temperature treatments.
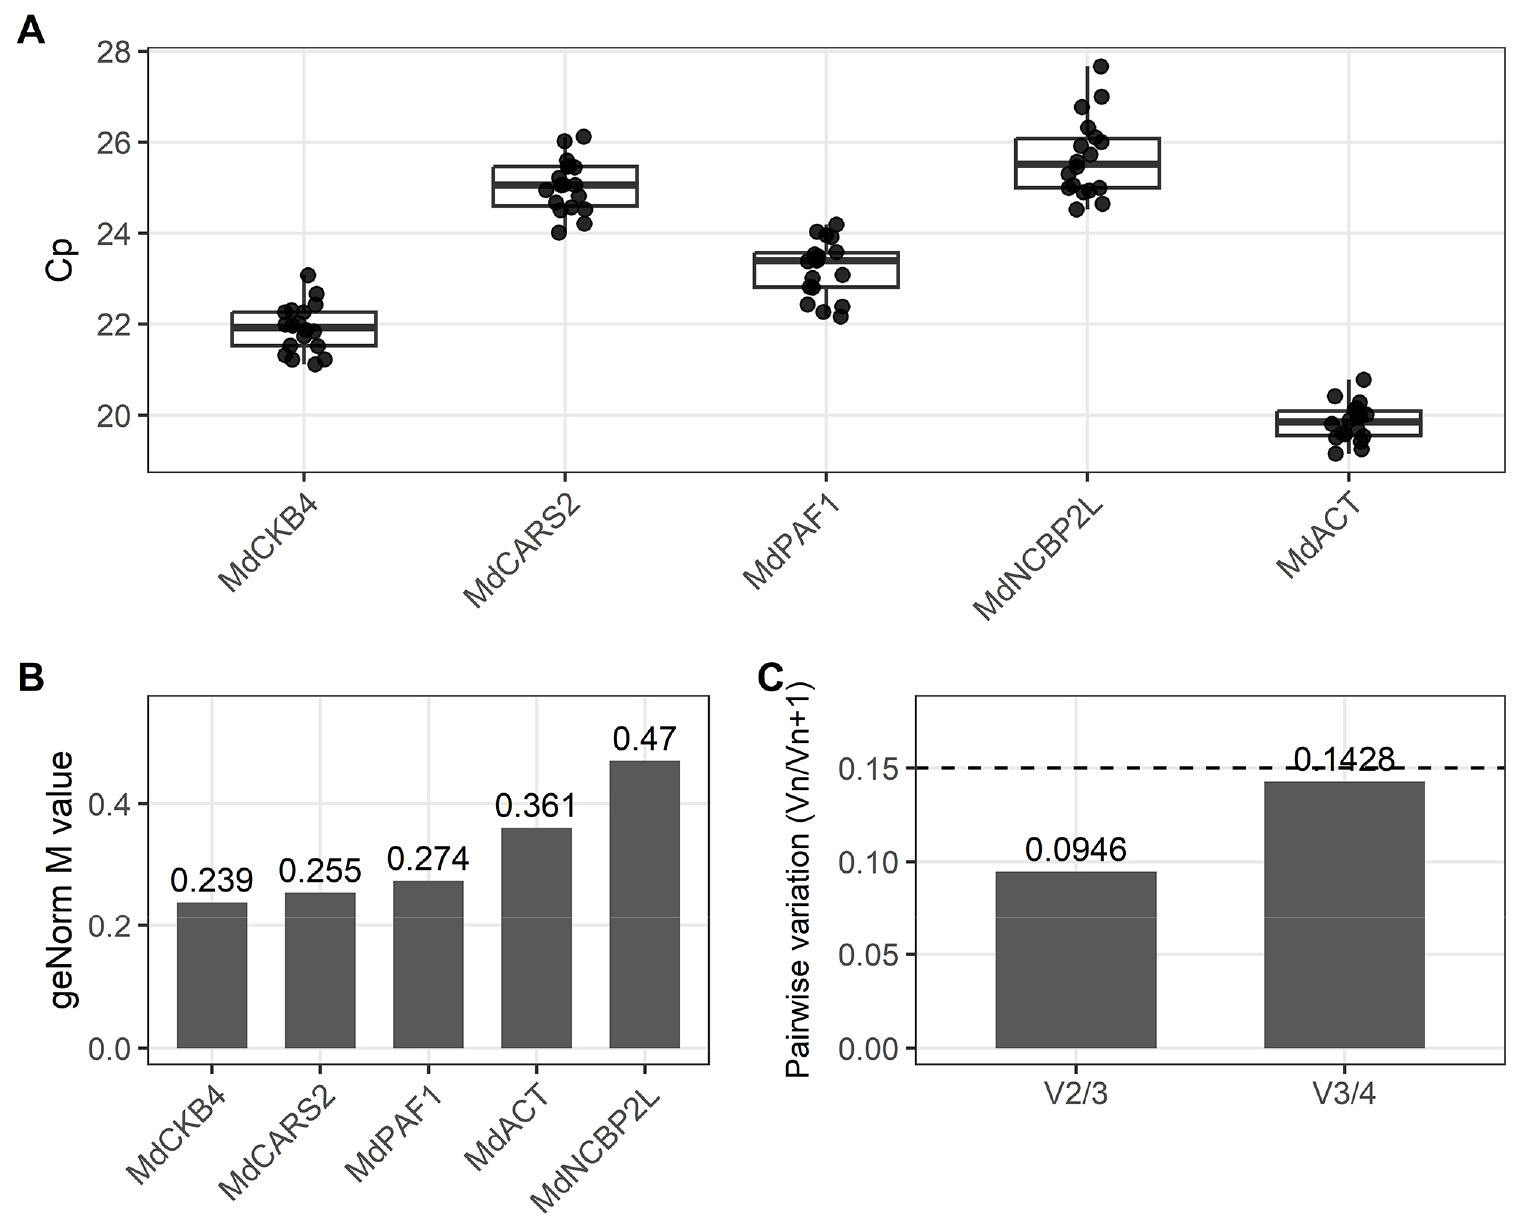
Fig. 2.
Expression stability analysis of candidate reference genes in apple leaves subjected to high-temperature treatment during fruit development. (A) Distribution of Cp values for five candidate reference genes across 18 biological samples. Each point represents an individual biological sample; boxes indicate the interquartile range with the median, and whiskers extend to 1.5 times the interquartile range. (B) geNorm M values of the candidate reference genes. Lower M values indicate greater expression stability. (C) Pairwise variation values for determining the optimal number of reference genes. The dashed horizontal line indicates the proposed cut-off value of 0.15.
Table 3.
Expression stability ranking of candidate reference genes
| Gene symbol | geNorm M value1) |
NormFinder stability1,2) |
BestKeeper SD (Cp)1) | BestKeeper r3) | Overall rank |
| MdCARS2 | 0.255 | 0.11 | 0.45 | 0.978 | 1 |
| MdCKB4 | 0.240 | 0.16 | 0.42 | 0.939 | 2 |
| MdPAF1 | 0.274 | 0.25 | 0.53 | 0.903 | 3 |
| MdACT | 0.363 | 0.35 | 0.34 | 0.735 | 4 |
| MdNCBP2L | 0.470 | 0.42 | 0.69 | 0.856 | 5 |
Determination of the Optimal Number and Combination of Reference Genes
In the geNorm pairwise variation analysis, the V2/3 value was 0.0946, which was below the recommended threshold of 0.15, indicating that adding a third reference gene to the MdCKB4-MdCARS2 combination provided limited improvement in normalization factor stability (Fig. 2C). The V3/4 value (0.1428) was also below the threshold. Therefore, under the cultivar, tissue, high-temperature treatment, and sampling-time conditions evaluated in this study, the geometric mean of MdCKB4 and MdCARS2 can be used as the primary normalization factor. MdPAF1 may serve as an additional reference gene when the range of samples or experimental conditions is extended.
Agreement between Two- and Three-Reference-Gene Normalization Strategies
To further evaluate the two-reference-gene combination identified by geNorm at the target gene quantification level, NF2 and NF3 were independently applied to the same 18 biological samples. The sample-level normalized RQ values for MdAPX2 showed strong correlation and agreement between the two normalization strategies, with Pearson’s r = 0.981 and Lin’s CCC = 0.974 (Fig. 3A). Similar patterns were observed for MdCOL6, with a Pearson’s r of 0.940 and a CCC of 0.920 (Fig. 3B). In the Bland-Altman analysis comparing NF2 and NF3, the mean bias was -0.032 log2 units, and the 95% limits of agreement ranged from -0.218 to 0.153. In total, 17 of the 18 samples were within the 95% limits of agreement (Fig. 3C). These findings indicated that adding MdPAF1 as a third reference gene led to only limited changes in the normalization factor and target gene quantities for most samples. Thus, the agreement analysis of target gene quantification supports the pairwise variation results shown in Fig. 2 and further demonstrates that the MdCKB4-MdCARS2 combination is applicable for normalization under the experimental conditions examined in this study.
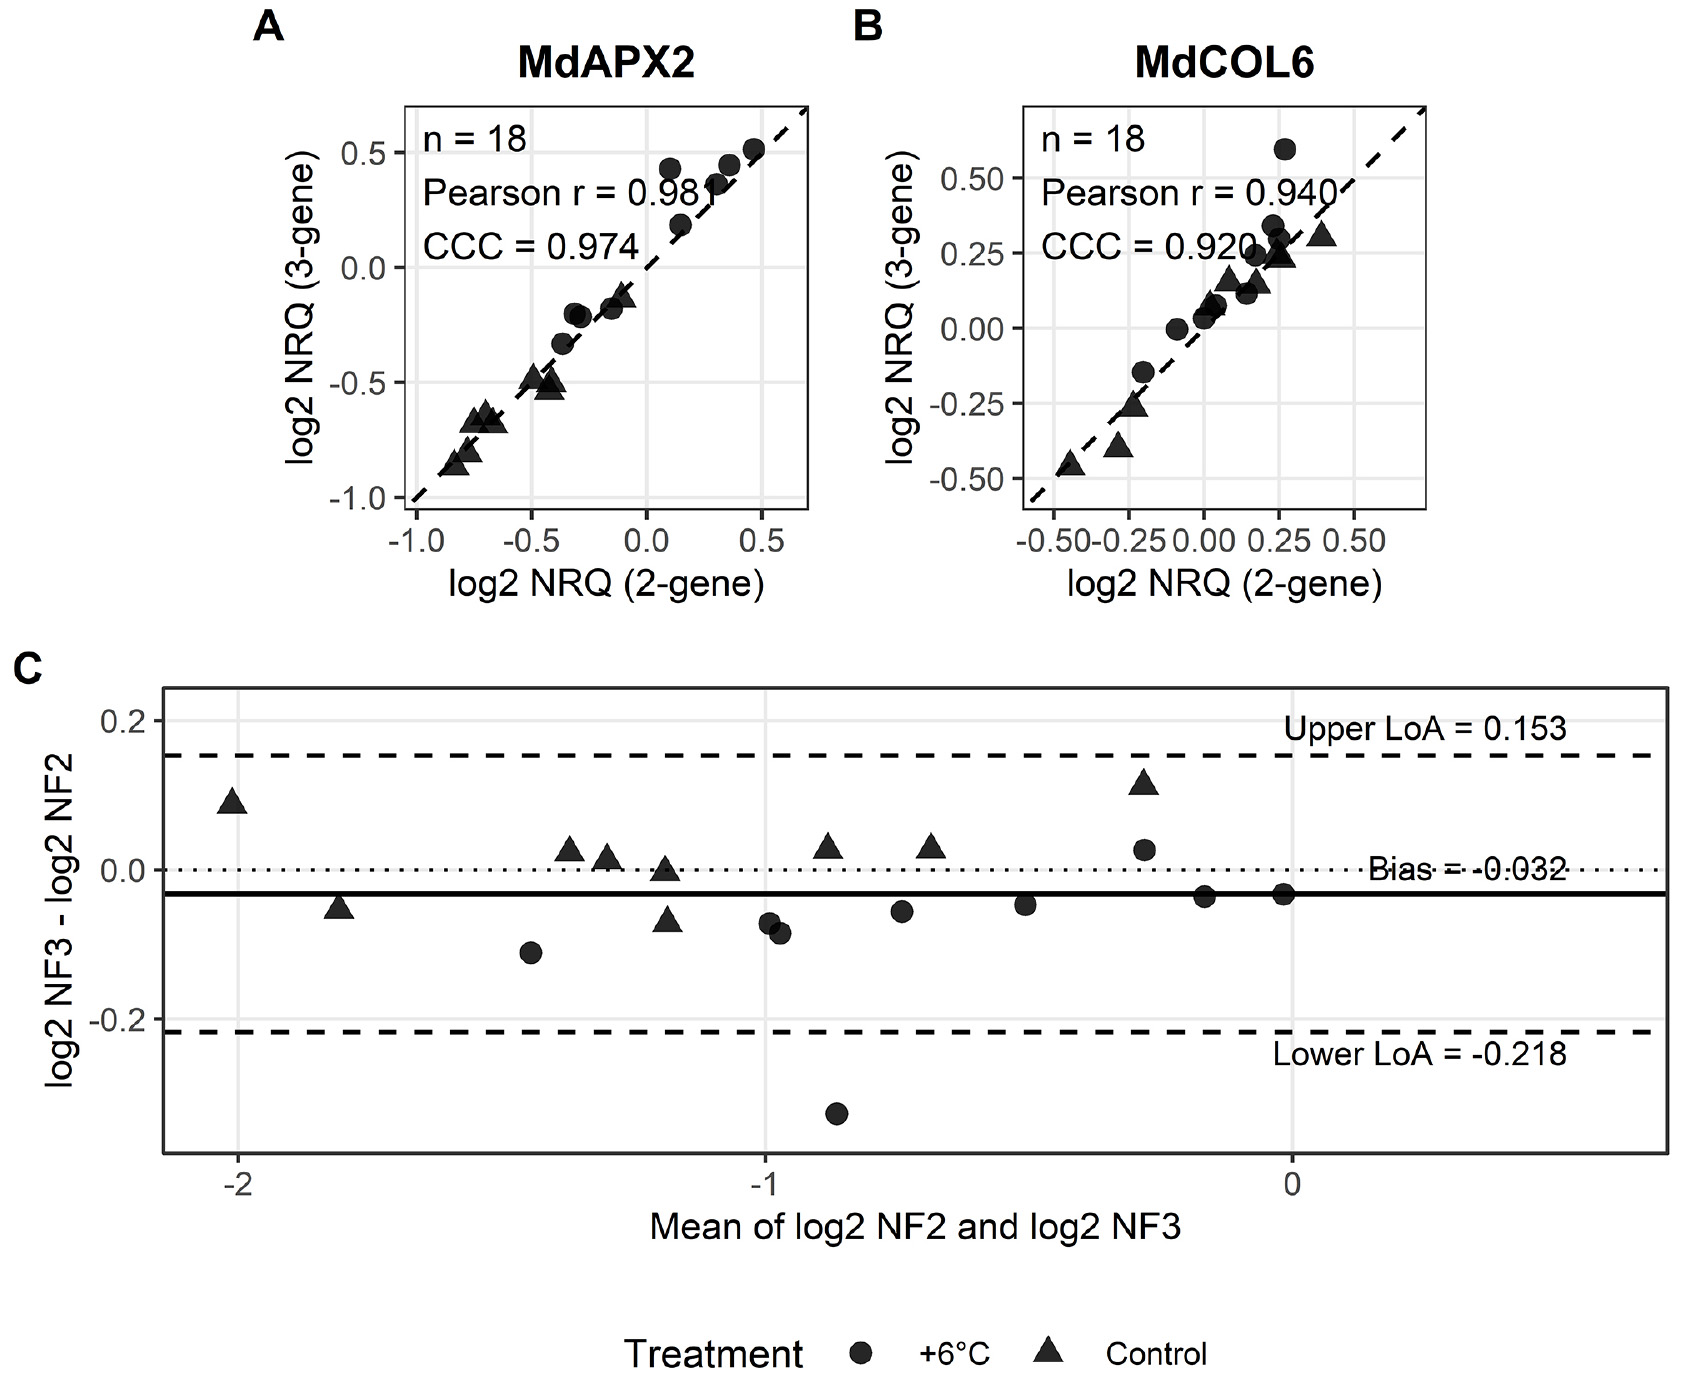
Fig. 3.
Agreement of target-gene quantification between two- and three-reference-gene normalization strategies. Log2-transformed normalized relative quantities of MdAPX2 (A) and MdCOL6 (B) were calculated using either the geometric mean of MdCKB4 and MdCARS2 (NF2) or that of MdCKB4, MdCARS2, and MdPAF1 (NF3). Each point represents one of 18 biological samples, and the diagonal dashed line indicates perfect agreement. Pearson’s correlation coefficient (r) and Lin’s concordance correlation coefficient are shown in each panel. (C) Bland-Altman comparison of NF2 and NF3. The solid horizontal line represents the mean bias, the dotted line indicates zero difference, and the dashed lines indicate the 95% limits of agreement. Circles and triangles represent samples from the +6°C treatment and control, respectively.
The high stability of MdCARS2 and MdCKB4 may also be considered in relation to their cellular functions and previous reference-gene studies in apple. MdCARS2 encodes cysteinyl-tRNA synthetase 2, which participates in aminoacyl-tRNA formation as part of the basal protein translation machinery, whereas MdCKB4 encodes casein kinase II subunit beta-4, a regulatory component of the CK2 protein kinase complex. Maintenance of these fundamental cellular processes may be consistent with the relatively buffered transcript abundance observed in mature leaves during prolonged high-temperature treatment. Nevertheless, functional annotation alone does not imply constitutive transcription, and their suitability as reference genes should primarily be attributed to their low expression variation identified by RNA-seq screening and subsequently confirmed by qRT-PCR. Transcriptome- guided selection of low-variance genes has previously been successfully applied to apple reference-gene identification (Bowen et al., 2014; Zhou et al., 2017). Notably, Bowen et al. (2014) identified CKB4 among the recommended low-variance reference-gene candidates in apple, and Zhou et al. (2017) also identified a casein kinase II subunit beta-4 candidate among the highly stable reference genes in apple roots. The present results extend these observations to mature ‘Fuji’ leaves exposed to long-term high-temperature conditions and suggest that MdCKB4, together with MdCARS2, is a promising candidate for normalization under these specific experimental conditions.
In contrast, MdACT showed lower overall stability than MdCARS2 and MdCKB4, despite its relatively high expression and low BestKeeper SD. This result highlights the condition-dependent nature of conventional housekeeping genes. Previous studies in apple have reported contrasting performance of ACT depending on the biological material and treatment. Zhu et al. (2019) identified ACT among the relatively stable reference genes in apple peel during fruit development, whereas Yoon et al. (2020) reported ACT among the least stable genes under temperature treatments. Similarly, Storch et al. (2015) found MdACT to be unstable under several organ, postharvest, and storage-related conditions. Because actin is a major component of the cytoskeleton, variation associated with tissue development and environmental responses may contribute to condition-dependent transcription of members of the actin gene family. Furthermore, the MdACT primer pair evaluated here was predicted to amplify multiple RefSeq transcripts or loci, whereas the newly designed MdCARS2 and MdCKB4 assays showed locus-specific amplification. Together, these observations demonstrate that widespread use of a conventional housekeeping gene does not guarantee its suitability for a particular experimental system and reinforce the need to evaluate both transcriptional stability and primer specificity under the conditions of interest.
The applicability of the reference genes identified in this study is limited to mature leaves of ‘Fuji’ apple subjected to high-temperature treatment during fruit development. qRT-PCR-based expression stability was evaluated using samples collected from the control and +6°C treatment groups at 10-15 WAT. Therefore, the same expression stability cannot be assumed under acute heat stress, at other developmental stages, in tissues such as flower buds or fruits, or in other apple cultivars. Expression stability should be revalidated before application under different experimental conditions.
Overall, MdCARS2 and MdCKB4 showed the most consistent expression stability across the evaluated algorithms, and their geometric mean provided a normalization factor comparable to that obtained by including MdPAF1. Thus, the MdCARS2-MdCKB4 combination provides a practical normalization strategy for one-step qRT-PCR analysis of mature ‘Fuji’ apple leaves exposed to high-temperature conditions during fruit development. Application to other cultivars, tissues, developmental stages, or heat stress regimes should be preceded by condition-specific validation.