

Introduction
Materials and Methods
Data
Descriptive statistics
ARIMA with outliers
Results
Stationarity test
Outlier identification
Parameter estimates
Discussions
Introduction
The pork market is an important sector in the Philippines which greatly contributed to the agricultural economy. For the last years, pork production was the top grosser among the whole livestock including a poultry sector in terms of volume and value of production. The average volume of production in 2022 was recorded at 1.74 million metric tons, with an annual increase of 2.40 percent. In the same year, the total pork production has amassed a total gross value of 302.66 billion pesos (1 Philippine Peso (PHP) is 0.018 US dollars (USD) at the current time), which is 17% of the total value of the agriculture, fishery and aquatic sector. In terms of the average prices of pork meat in 2022, the average price of hogs at farmgate level was reported at 176.06 pesos per kilogram (liveweight) and retail prices for fresh pork was reported at 311.87 pesos per kilogram. Both farmgate and retail prices have posted growth rates of 13% and 8.1%, respectively (PSA, 2022c). Although pork prices have continually increased, there are uncertain situations such as policy changes and unusual weather conditions, animal or infectious diseases affecting price fluctuations.
Over the years, pork prices had experienced the unexpected shocks brought by Foot and Mouth Disease (FMD) in 1995, African Swine Fever (ASF) in 2019 and the recent COVID-19 outbreak in 2020. Such erratic events can lead price variations (Abao et al., 2014). After FMD in the earlier months of 1995, an average price had decreased by 11.8% for farmgate prices and 15.7% for wholesale prices. Another challenge came to the industry, the ASF disease started to affect pork production in July 2019, where seven provinces were directly affected and it has caused a significant drop in pork demand in the last quarter of 2019 (Cooper et al., 2022). In addition to the ongoing ASF occurrence, there was another dilemma faced by the pork sector in 2020, which is the COVID-19 pandemic. Such epidemic has disrupted all economic activities and impacted the pork meat prices due to delay of transportation of raw materials (for meat processing) and increases in cargo ship fees (Ijaz et al., 2021). All these events have negatively affected the fluctuations of farmgate and retail prices for pork and this can cause unstable pork market. With the unexpected shocks, analyzing the existence of outliers in individual pork price is relevant to pinpoint specific observations that were discordant from the overall data set. This study can provide useful information for decision-making of major agricultural stakeholders (farmers, retailers, consumers, government, etc.) to mitigate negative impacts on the pork industry.
Outliers refer to data value that is far from the characteristic of the overall data set (Ahmar et al., 2018). The existence of unusual occurrences in the price series is prone to misinterpretation of results in time series analysis. The impact of outliers in conventional time-series models can be ignored. Several studies have suggested different estimation methodologies to detect, estimate and treat outliers. Some of studies utilized residual corresponding to a white noise process using a likelihood ratio test. The additive and innovative outliers in time series were described by Fox (1972). He utilized the maximum likelihood ratio tests for outlier detection. To extend Fox’s (1972) findings, Chang and Tiao (1983) and Chang et al. (1988) applied to an autoregressive integrated moving average (ARIMA) model and suggested an iterative approach for a data series into trend and residual for outlier detection and parameter estimation. Tsay (1988) suggested the unified methods in identifying and managing multiple outliers and structural changes in a univariate time series analysis. The methodology suggested by Tsay (1986, 1988) has an advantage. It is easily accessed because least squares method and residual variance ratios were employed to an ARIMA model. Several studies referred to his method in analyzing time series fluctuations in oil prices (Nasir et al., 2017), financial prices (Wheatley et al., 2019), commodity price futures (Byers et al., 2021) and electricity prices (Gupta and Bhat, 2023). This study attempts to identify and detect unexpected shocks in pork prices to understand a pork market, using autoregressive integrated moving average with outlier models.
The foremost objective of this study is to analyze the price fluctuations in the Philippine pork meat market. Specifically, this study examined the presence of outliers in farmgate and retail pork prices using an ARIMA with outliers model. The study followed a general process of a time-series analysis. Based on the stationarity test and model specification, we conduct outliers’ detection and identification. The results will contribute to the limited literatures of using outlier models in agricultural price series analysis and provides information for policy measures in countering price shocks, risks and uncertainties in pork prices in the Philippines.
Materials and Methods
Data
Three monthly prices are used in this study; 1) farmgate hogs upgraded for slaughter price (hogs); 2) retail price for pork lean meat (plm) and 3) retail price for pork meat with bones (pmb). According to the Philippine Statistics Authority (PSA), farmgate price is the value paid to the hog raisers for the products sold based on their farm location. Retail price is the selling price of pork lean meat and meat bones to buyers in the market. All monthly prices are nominal values in Philippine peso (PHP).
The monthly pork prices of farmgate and retail were retrieved from the Philippine Statistics Authority (https://openstat.psa.gov.ph) of the crops division under the Agriculture, Forestry and Fisheries (Economics Statistics) database. The farmgate price ranges from January 2014 to December 2020, and retail prices start from January 1990 to January 2021. The data retrieved have different lengths due to unavailability of monthly farm gate prices from January 1990 to December 2013.
Descriptive statistics
Table 1 presents the summary statistics. There are a total of 373 observations for both plm and pmb, while hogs have 84 observations. In the farmgate level, hogs have a minimum value of PHP 91.53 and maximum value of PHP 163.04. On the other hand, retail price values for plm and pmb ranges from PHP 52.27 to PHP 292.66, and PHP 45.26 to PHP 262.55, respectively. The average price values are PHP 116.70 (hogs), PHP 136.75 (plm) and PHP 122.37 (pmb). Among the price series, values of plm have a greater distance away from the mean, as reflected by its standard deviation of 51.43. Consistently, plm series are more spread out from its mean value as seen by its variance of 2645.44. In terms of symmetry of the distribution, plm and pmb are nearly symmetrical with skewness of 0.1575 and 0.187, respectively. Meanwhile, there is positive skewness for the hogs. Lastly, observing the fatness of the tails in their probability distributions, the hogs price has a leptokurtic distribution, which means that its skinniness is a result of long tails (outliers).
Table 1.
Summary of statistics
| Prices | Obs. | Mean | Std.Dev | Min. | Max. | Skewness | Kurtosis |
| Hogs | 84 | 116.70 | 12.05 | 91.53 | 163.04 | 1.07 | 5.99 |
| Plm | 373 | 136.57 | 51.43 | 52.27 | 292.66 | 0.19 | 1.94 |
| Pmb | 373 | 122.37 | 46.96 | 45.26 | 262.55 | 0.16 | 1.84 |
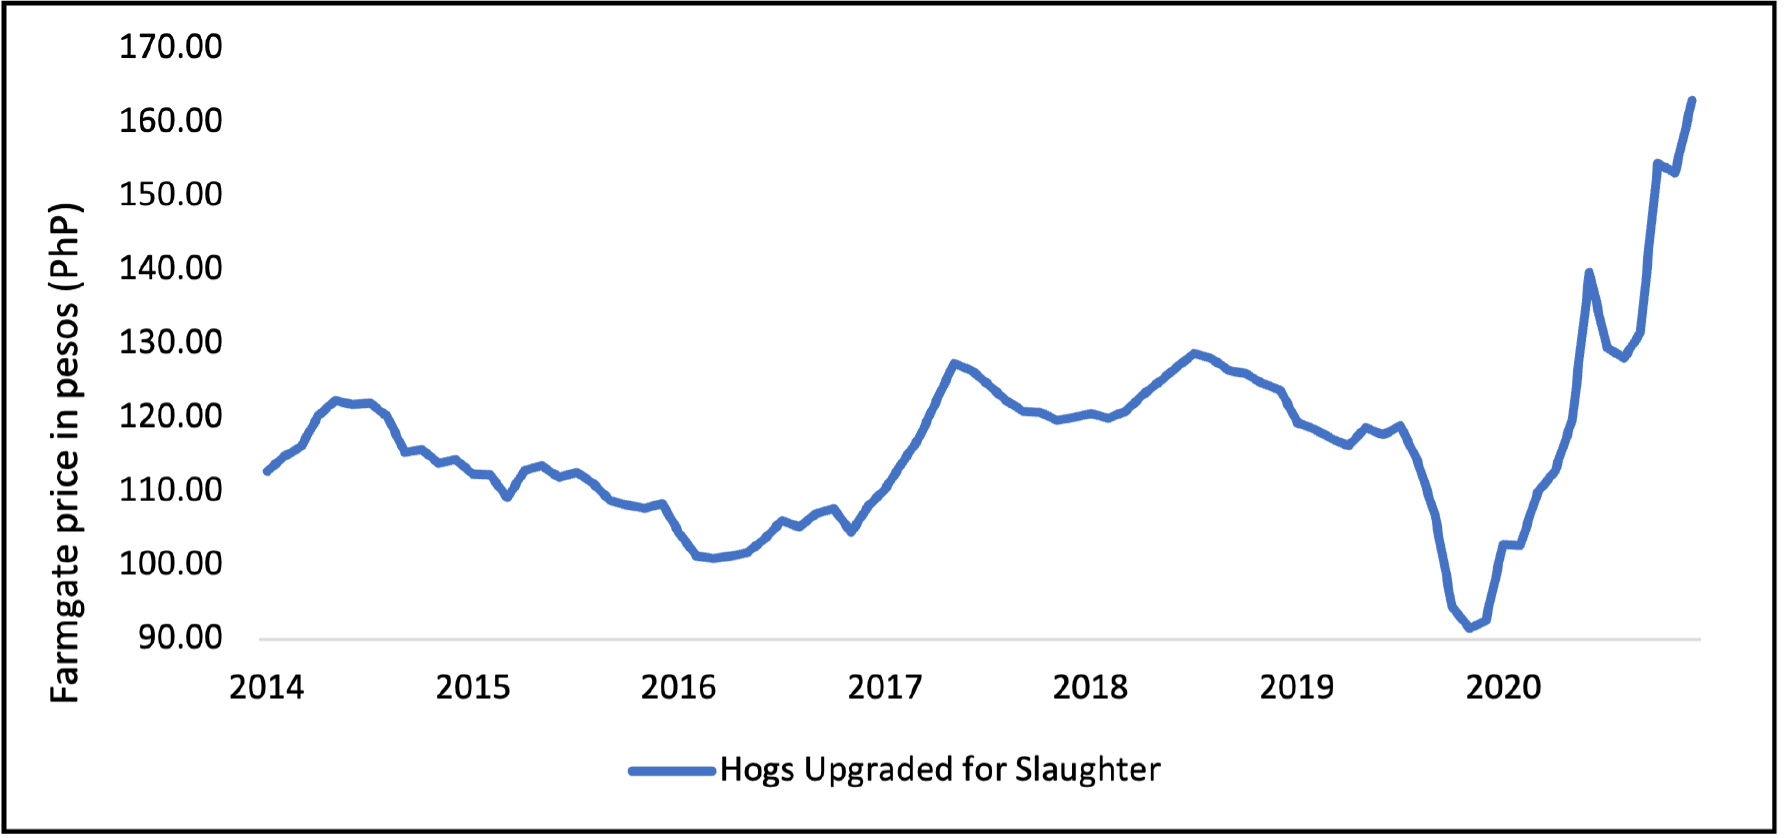
Fig. 1 and 2 shows the price fluctuations of hogs, plm and pmb, respectively. In the farmgate prices, there are sudden changes. For example, there was a sudden decrease in the farmgate price where it fell from PHP 106.79 to PHP 94.39, starting from October 2019. In the last quarter of 2019, the farmgate prices were affected by the first outbreak of ASF in the third quarter of that year and this has resulted to a decline in demand for pork and sudden drop prices (Cooper et al., 2022). The prices after that period were maintained at that average level until there was a sudden price spike in June 2020, where farmgate price increased by PHP 20.00 (from PHP 119.71 to PHP 139.71). This abrupt change was attributed to increase transportation costs due to challenges of lockdowns at the onset of the pandemic (Ijaz et al., 2021). Moreover, there is a change in the price level in October 2020 by PHP 22.89 (from PHP 131.57 to PHP 154.46). This enormous change can be explained by the spread of the ASF in 31 provinces across 8 regions in the Philippines (Cooper et al., 2022).
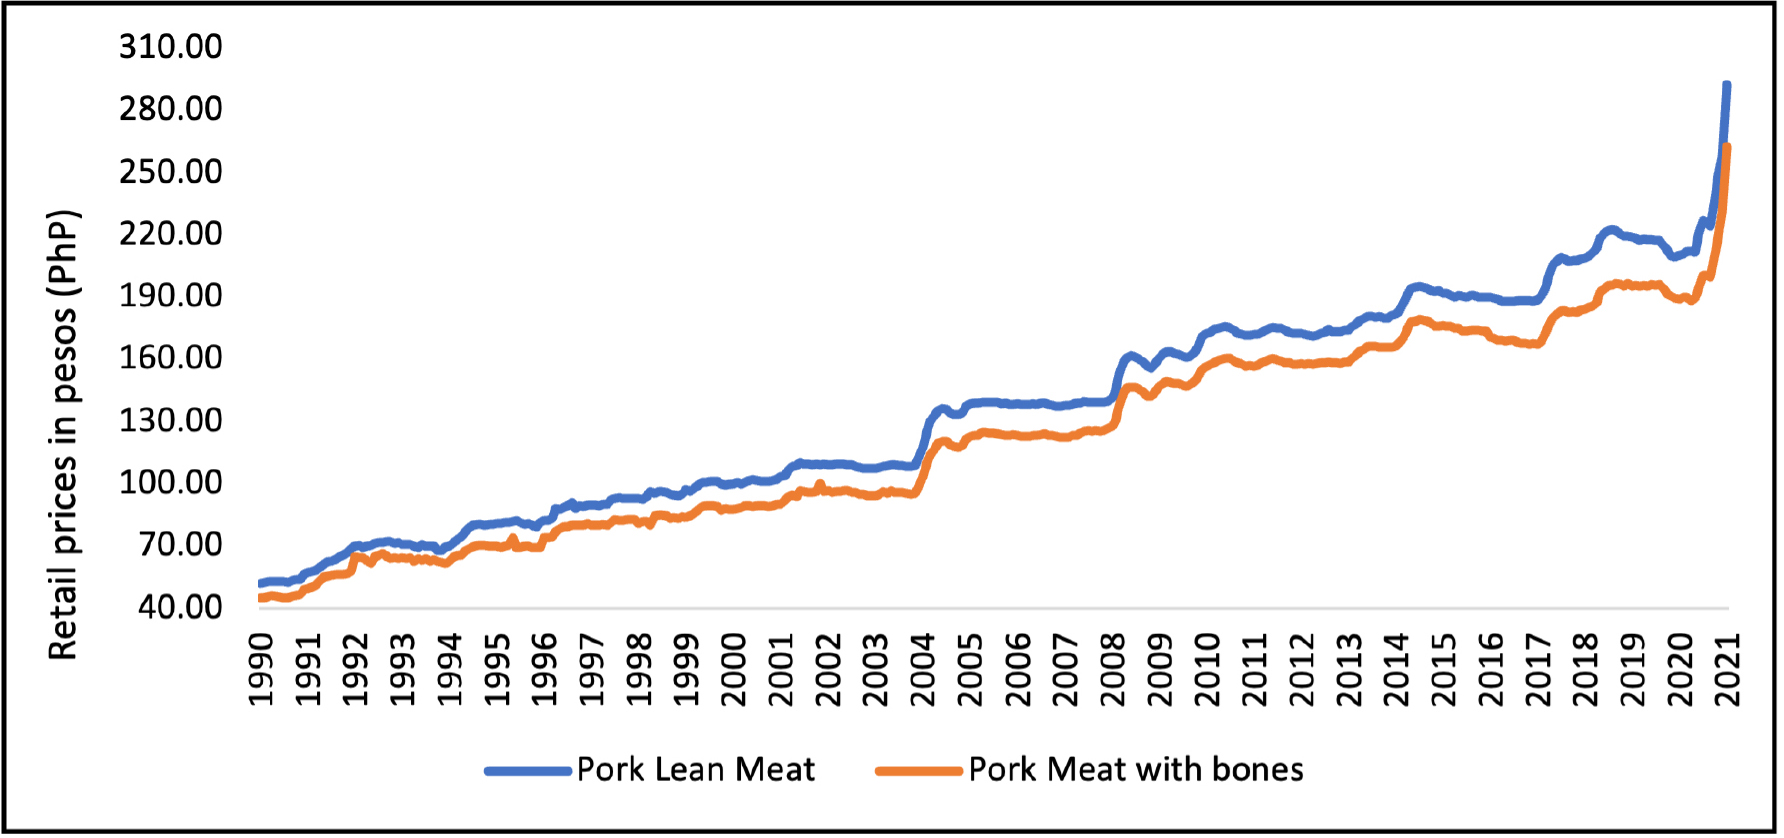
The retail prices for both pork lean meat and pork meat with bones are shown in Fig. 2. Generally, these price series have an increasing trend having the last observation at its peak and it is expected to continually increase. For pmb, there was a change in the price level in June 1995, having an unexpected price decrease of PHP 4.95 (from PHP 74.43 down to PHP 69.39). This change can be ascribed to the FMD outbreak which happened in pig-producing regions, starting from the first quarter of 1995 (Abao et al., 2014). In August 2020, there was a PHP 1.00 decrease in plm. In addition, both pmb and plm have the same movement of prices in September 2020, with price decreases ranging from PHP 1.10 to PHP 1.74. Consistently, at the last period in the price series, which is January 2021, retail prices for plm and pmb jumped massively by PHP 34.28 and PHP 31.64, respectively (which is the highest peak of both time series). These enormous increase in the retail prices, is a result of the combined effect of the ASF outbreak and the COVID-19 pandemic in the last quarter of 2020.
ARIMA with outliers
This paper followed a general estimation procedure in time series analysis setting. First, the test for stationarity in the pork price series is conducted by Augmented Dickey-Fuller (ADF) test in an individual data. If non-stationary, it proceeded to the differencing process. After first differencing, series are stationary. The optimal length of lag is determined by the Akaike Information Criterion (AIC). With optimal lags, the ARIMA is estimated. Next, the process of iterative procedure for outlier detection (by likelihood ratio test) and parameter estimation is executed in the ARIMA model.
After selecting the model with respect to the level of difference and lag length, the presence of outliers can be described in an ARIMA model or state-space model (Peña et al., 2001). In order to identify outliers in farmgate and retail pork prices, this study adopted the estimation procedure for a univariate time series proposed by Tsay (1986, 1988). The model is modified to the ARIMA model in equation (1):
where is an unobserved variable, is a sequence of white noise of iid series, B is a backshift operator, ∇ is the difference operator 1-B, is a stationary price series at d level of difference, is equivalent to with autoregressive polynomials of degree p, and is equal to with moving-average polynomials of degree q.
Considering the existence of outliers and structure changes, pork price series () is presented by this model (Tsay, 1988):
where is unobservable and follows white noise process, is a parametric function describing the external shocks of such as outliers and structural changes. is defined as follows;
where becomes a deterministic model if = 1, while is a stochastic model if = 0. The study utilized a deterministic estimation process, where is an indicator variable if , is a constant denoting autonomous impact of the disturbance, with polynomials of degree s, and , with polynomials of degree r.
Box and Jenkins (1976) expressed as an intervention model and it is a generic form which can be fitted to depict various dynamical disruptions of a time series. From this equation, special cases are derived for different types of outliers. Outliers are classified into the additive outliers, innovative outliers, level shift (level change and transient change) and variance changes (Chang et al., 1988; Peña et al., 2001; Tsay, 1986, 1988).
Additive outlier (AO) is estimated when . It represents an outside disturbance or exogenous increment of the price series in a specific period. AO can appear when measurement errors occur.
Innovative outliers (IO) is a result of a variation inside the model or brought by endogeneity effects on the noise of the process and this is developed by putting impulse effects to the noise of the first process. IO is estimated when .
Level shift (LS) resembles an alteration of the homegrown mean price or process level beginning from a particular observation and ongoing till the last observed period. When the series is stationary, a LS indicates an adjustment in the average level of the price series after a particular observation, and the process is transformed into a nonstationary series. The LS model is divided by a permanent level change (LC) and transient change (TC). LC is estimated when . However, TC is estimated when (where 0<𝛿<1). TC affects for all but the effect deteriorates exponentially having a proportion 𝛿. Given that 0<𝛿<1, the effects gradually fade, calling it a transient change.
Variance changes (VC) refers to adjustment of the price series away from the mean or described a shift of the variance. VC is also called the variance shift model in outlier analysis (Babadi et al., 2014). In developing the VC model, a stochastic case of is required.
The presence of various outliers in the ARIMA model is tested by hypothesis testing. The likelihood ratio (LR) is utilized to test statistics in Table 2. If the null hypothesis is rejected, there exist an outlier at a specific period d (Tsay, 1988). The 𝜌 and 𝜎 represents the ratio of the unknown parameter and its standard error, respectively.
Results
Stationarity test
All the price series are non-stationary at levels and the first-differenced transformation of the data set made the process stationary. Table 3 presents the results of the ADF test. The price series data (hogs, plm, pmb) at the level are nonstationary. After the first differencing, the price series are stationary. The optimal lag is determined by minimum criterion information (BIC). The models specified are ARIMA (0,1,0) for hogs, ARIMA (3,1,2) for plm and ARIMA (0,1,3) for pmb.
Table 3.
ADF test for price series at levels and first difference
| Variables | Zero Mean | Single Mean | Trend | ADF Test | |
| Level | Hogs | 0.7880 | 0.9906 | 0.9882 | Non-stationary |
| Plm | 0.9861 | 0.9996 | 0.9999 | Non-stationary | |
| Pmb | 0.9859 | 0.9994 | 0.9999 | Non-stationary | |
| First difference | 0.0001*** | 0.0008*** | 0.0003*** | Stationary | |
| 0.0001*** | 0.0016*** | 0.0007*** | Stationary | ||
| 0.0001*** | 0.0001*** | 0.0001*** | Stationary |
Outlier identification
Table 4 presents the detected outliers in each price series. Additive outliers and level shifts were identified in each series. The impact of an additive outlier appears in a specific time and the impact of level shift stays until the next shock. All estimated coefficients are significant at 1% level.
Table 4.
Identification of outliers
| Type of outliers | Time | Coefficients | ||
| Hogs (PHP) | Plm (PHP) | Pmb (PHP) | ||
| Level shift | June 1995 | - | - |
-7.64*** (73.52) |
| Level shift | October 2019 |
-13.02*** (25.60) | - | - |
| Additive outlier | June 2020 |
15.07*** (68.54) | - | - |
| Additive outlier | October 2020 |
22.28*** (68.54) | - | - |
| Level shift | August 2020 | - |
-6.93*** (79.24) | - |
| Additive outlier | September 2020 | - |
-6.50*** (187.97) |
-5.53*** (95.76) |
| Additive outlier | January 2021 | - |
25.21*** (706.73) |
21.57*** (408.43) |
Level shift was evident in June 1995 for the retail price for pork meat with bones. With this shift to a new price level, it has impacted the retail price for pork meat with a price decrease of PHP 7.64. This is the period where the FMD outbreak affected many pig-producing regions in the country (Abao et al., 2014).
In October 2019, the farmgate price of hogs (hogs) was also starting to shift its price level. Specifically, the level shift in October 2019 significantly reduced the price by PHP 13.02. During this period, the ASF outbreak already started in the third quarter of 2019 which directly affected the fourth quarter prices at the farm level (Ijaz et al., 2021). The additive outliers in June 2020 and October 2020 contributed to the rise in hog prices by PHP 15.07 and PHP 22.28, respectively.
The period of September 2020 and January 2021 are additive outliers detected for both retail prices (plm and pmb) and it is evident that both series are moving in the same direction and were affected by the same external shocks. As a result, in September 2020 outlier, the retail prices for lean meat and with bones were reduced to PHP 6.50 and 5.53, respectively. Moreover, the additive outlier in January 2021 has increased the prices of plm and pmb by PHP 25.21 and PHP 21.75, respectively.
During the third and last quarter of 2020, ASF cases coupled with the COVID-19 pandemic, greatly affected the pork market. In August 2020, there is an evident level shift in the retail price for pork lean meat and the retail price for lean meat was reduced by PHP 6.93. It is because during this time the highest level of ASF cases were recorded at around 1,773 cases (Department of Agriculture, 2021). However, in January 2021, the retail prices for lean meat and bone meat were increased. It is because the effect of the pandemic also pushed the increased production prices of pork meat at its peak due to the disruption of global supply chain led to supply shortages and to increases in high transportation costs (Ijaz et al., 2021).
Parameter estimates
Table 5, 6, 7, presents the estimated coefficients of the ARIMA model for the hogs, plm and pmb price series. All estimated coefficients of the ARIMA (0,1,3) model for pmb are significant at 1% level. Meanwhile, only AR(1,3) of the ARIMA (3,1,2) model for plm was found to be non-significant including its constant value. For hogs price, there are no has no significant lags for both AR and MA estimates, after finding the impacts of level shift on June 1995, October 2019, and the impacts of additive outlier on June 2020 and October 2020. On the other hand, the plm ARIMA model shows that the past three months of prices and past 2 months of disturbances, significantly affect the current prices even though we found level shift and additive outliers. Meanwhile, the ARIMA model for pmb presents that the past 3 months of disturbances affect the present prices after finding additive outliers.
Table 5.
Estimates of ARIMA (0,1,0) model for hogs
| Parameters | Estimates | Standard Error | t-value |
| Constant | 0.6065 | 0.5253 | 1.15 |
Discussions
It can lead the biased estimates and inaccurate forecasting if the presence of outliers in pork price is ignored. Infectious diseases from animals such as FMD and ASF cause significant economic loss in livestock industries and meat markets. In addition, the COVID-19 pandemic has changed people’s livelihoods and food system. Impacts of unexpected shocks such as FMD, ASF and COVID-19 in the Philippine pork market can permanently stay in prices or the impacts can disappear in a specific period. The study attempted to detect and identify such shocks in farmgate and retail pork prices. The ARIMA model with outliers is utilized to detect and identify types of shocks in the Philippine pork market.
Given the results and the outliers detected in relevant period, it is evident that the farmgate and retail prices of pork are highly sensitive to shocks. With this, it is important that the government should mitigate these risks and uncertainties by developing a mechanism to counter the effect of shocks. This can be done by having regular buffer stocks and importation of pork to stabilize the pork prices for the benefit of consumers. However, they also need to consider the producers side, who are affected by importation and price policies. Moreover, agricultural extension programs for pork farmers should be sustained for their lifelong learning in new technologies for pig farming and disease control in their farm sites. Furthermore, the Philippine Hog Industry Roadmap 2022-2026 (Department of Agriculture, 2020) should be implemented, and its progress should be highly monitored, to ensure that targeted outcomes will benefit both producers and consumers in the long run.
The study was challenged by the limitations of the data sets, since not all price series have the same length of time periods. The detection of outliers is sensitive to the length of lags and thus it is important to find the optimal lags. For further studies, forecasting would be considered when there exist various shocks in a price. In addition, vertical integration studies must be evaluated in order to understand a pork industry in the Philippines. This study can also be extended to study price fluctuations on different goods and commodities in the Philippines and other developing countries.
