

Introduction
Materials and Methods
Study Area
Sampling Techniques and Data Collection
Analytical Techniques
Conceptual Framework and Estimation Approach
Propensity Score Matching (PSM)
The Endogenous Switching Regression (ESR) Model
Results and Discussions
Descriptive Statistics
Econometric Results
Propensity score Matching Average Treatment Effect
Endogenous Switching Regression Results
Endogenous Switching Regression (ESR) on crop income
ESR-based Average Treatment Effect on the Treated and Non-treated
Conclusion
Recommendations
Introduction
The adoption of different agricultural technologies accounts for the global increase in food production most especially in the rice and wheat sectors (Aryal et al., 2018; IFAD, 2019). Rice is an important food crop and the second most consumed cereal after maize in Cameroon by many households. While the gap between local demand and production continues to widen, commercial imports have effectively been used to close these gaps (Business Report, 2021). With a huge potential capacity that can produce enough for every consumer, the country’s rich soil profile hasn’t been guided and equipped by relevant policies to ensure its maximum productivity. This trend has seen low productivity in the sector over the past years (FAO, 2022). Rice yield has hardly reached 5 tons per hectare. After the 2008 global crisis that saw many countries protest with Cameroon not left out, the government undertook several measures to promote and encourage local production of some crops among which was rice (Goufo, 2008; Malaa et al., 2016). The national rice strategy document was launched to reduce poverty by improving food security among rural communities while promoting the production and competitiveness of local rice (NRDS, 2009). Several projects were funded by the government and development partners among which were projects that sought to introduce new technologies in the sector. This saw rapid development and the introduction of several agricultural technologies accompanied by several policies aimed at boosting local rice production. One such major technology was the introduction of new rice varieties. Many new rice varieties were introduced among which were the NERICA (New Rice for Africa) varieties, developed by the Africa Rice Centre and disseminated across different countries. These varieties were introduced across the country according to genetic traits and climatic adaptability either as rain-fed upland rice or lowland irrigated rice varieties (Malaa et al., 2016). As a result of these multiple technologies introduced to boost rice productivity and farm income, agricultural technology adoption in the rice sector has seen a growing importance accorded to it by researchers (Anki, 2016; Gaston et al., 2022). The real contribution of several of such technologies and policy reforms in boosting rice production has been questioned by these scholars most of whom have observed slow growth in the sector. While some scholars have identified the positive impacts of such technologies in the sectors, many questions are still left unanswered as local production is still far from satisfying consumption (Malaa and Nzodjo, 2011). This suggests that when a new variety of a crop is introduced or an existing variety is cleaned or re-selected and re-introduced; researchers will need to know not just the extent to which it’s being used (intensity of adoption) but also the advantages and perceived drawbacks of the improved varieties. Several technologies have been introduced to farmers in the study area, however as highlighted by some previous studies (Gaston et al., 2022) rice farmers have adopted just 8 of the about 32 different farm technologies introduced in the area. Their study found a low rate of adoption by rice farmers and even among the adopted technologies, improved rice varieties had a very low rate. This justifies the need to investigate the reason or factors influencing adoption as well as the impact of improved variety adoption. The main improved technology chosen for this study was the improved rice varieties introduced in the area in 2016 through the Project for the development of rain fed and irrigated rice (PRODERIP). These varieties are the low-land irrigated Tox 3145 and Tainan 5, and since their re-introduction in the area, no study has detailed the impact of the improved varieties on the productivity and income of the crop. Therefore given the importance of such a study on the promotion of the technology, this study seeks to evaluate the effects of improved rice varieties adoption on the crop productivity and income of farmers. The findings of this study will be vital to make recommendations on what areas to reinforce to encourage adoption while identifying the effects of adoption as an incentive to boost adoption.
Materials and Methods
Study Area
This study was carried out in the western highlands agroecological zone of Cameroon. This zone covers the North West region and the West region of the country. The zone is home to the second-largest rice production basin in the country and constitutes what is called the “Upper Nun Valley Area”. These production zones cuts across both regions with a bigger production area in the North West Region. The highland covers 5 Divisions within the 2 regions namely, the Ngoketunjia, Mezam, and Bui (North West Region) and the Noun and Bamboutous Divisions (West Region). This study, therefore, covers 8 rice growing areas across 8 villages within 4 production zones namely; Upper Bamunka, Lower Bamunka, Babungo, and Bangolan zone. These areas are presented in the table below. These areas and samples are presented in ‘Table 1’ below.
Table 1.
Study areas and sampling sites in the North West and West regions
Source: Proderip, 2021
Sampling Techniques and Data Collection
A multistage sampling technique was used to identify rice farmers from across the 8 villages surveyed. The first stage of the selection was the identification of 8 villages in which improved rice seeds had been introduced to some farmers. Within these villages, major rice farming areas were selected and farmers cultivating improved rice varieties especially the improved Tox 3145 and Tainan 5 varieties introduced by the Upper Nun Valley Development Authority (UNVDA), were randomly selected. This sampling process of course isn’t completely randomized and questions of selection bias could quickly come to mind. This was however addressed by the econometric models used later in the study. In total, the Upper Nun Valley Area has about 16685 registered rice farmers. However, target areas across the 8 villages considered in this study have about 3000 rice farmers (PRODERIP, 2021). These specific farming areas represent the areas in which the improved varieties had been introduced. In a cross sectional approach, 421 farmers were surveyed across these chosen sites between January and February 2022. Primary data was collected through the administration of questionnaires, a face-to-face- interview using paper and pen, and focused group discussions. The questionnaires were made of three sections and sampled variables related to rice farmers’ household characteristics, varietal characteristics, institutional factors, and impact-related characteristics of the technology. Secondary data used in the study was collected from FAOSTAT, the National Institute of Statistics, and several other sources.
Analytical Techniques
Many studies on the impact of agricultural technologies adoption have used a single econometric approach which may not account for unobservable differences between adopters and non-adopters. Some studies (Awotide et al., 2013; Mendola, 2007), used the propensity score matching approach to evaluate the impact of agricultural technology adoption. The use of a single econometric approach like propensity score matching could be appropriate if the groups investigated are just based on observable characteristics. Where there exist unobservable characteristics that could influence adoption decisions and the impact of the technology, using a single econometric approach will produce a biased result (Musa et al., 2017). Therefore to address the existing analytical gap in such studies, this study used two econometric models. These models used are the propensity score matching method (PSM) and the endogenous switching regression (ESR) model to ensure an unbiased estimation and consistency of the results. Descriptive and inferential statistics were used to present the details of the summary statistics of quantitative data related to the socio-demographic characteristics of the sampled farm households. Inferential statistics tests were also used while the econometric models were used to evaluate the impact of the technology on rice productivity and income between the two farming groups.
Conceptual Framework and Estimation Approach
The study used a concept of evaluating the impact of agricultural technology adoption as modeled by a good number of previous research (Bekele et al., 2014; Khonje et al., 2015; Million et al., 2019). The concept is modeled on the fact that farmers decide to adopt a technology based on personal decisions guided by several factors. A rice farmer will decide to adopt an improved rice variety (IRV) based on his /her assessment of the utility or advantages that will be derived from cultivating the variety. A rational farmer will choose to adopt if the expected utility from the variety (V1) is greater than that from the old variety (V0). The utility gained from this adoption (V* = V1 - V0) is expressed as a function of an observable vector of covariates (Z) in a latent model;
Vi denotes a binary dependent variable with 1 if the farmer adopted and 0 if the farmer didn’t adopt the variety.
α, represents a vector of parameters to be estimated
Zi represents a vector of explanatory variables comprising farmers’ characteristics, characteristics of the variety, and institutional factors.
ƞi denotes a normally distributed random error term.
Crop productivity and farm income are considered the outcome variables to be influencing the farmers’ decision to adopt the technology. This outcome variable is assumed to have a linear function with a vector of exogenous variables Xi with endogenous adoption decisions of the technology. This relationship is represented as follows;
Where in;
Yi, represents the crop productivity and farm income
Vi, represents the treatment variable with a binary function of 1 if the farmer adopted and 0 if the farmer didn’t adopt
β and δ stands for parameters to be estimated by the model
εi, represents the random error term
As earlier stated, the choice of whom to introduce new technology to is usually not completely randomized, as such using Ordinary least squares (OLS) to estimate equation (2) will produce estimation bias. This model ensures selection bias is controlled through observable confounding factors in the sampled data. However, the PSM model has been criticized for its inability to control for unobservable characteristics within a sampled unit hence giving room for some biases. Therefore for reasons of complementing the PSM model used in this study to ensure an unbiased estimation of the impact of adopting improved rice varieties in the study area, the Endogenous Switching Regression (ESR) was also used. The model addresses any problems of endogeneity in technology adoption that may arise hence controlling for both observed and unobserved bias in the sampled units (Lokshin and Sajaia, 2004). The use of these two models in the study ensures the reliability and consistency of the results to be obtained.
Propensity Score Matching (PSM)
Farmers are selected to be introduced to any given technology in the study area. This, therefore, means this study can’t use a randomized complete trial (RCT) approach since the treatment and control groups are not completely randomized. This accounts for the choice of propensity score matching technique considered in this study. Propensity score matching method is a quasi-experimental approach introduced in 1983 (Rosenbaum and Rubin, 1983) and often used in observational causal studies. The approach seeks to answer the counterfactual question as earlier stated by using empirical methods to create a comparable control group of non-participants in the program under evaluation (Khandker et al., 2010). PSM makes use of observable characteristics in a sampled unit to generate a control group that is comparable to the treated group following exogenous characteristics. This model is constructed following two main assumptions. The first assumption is that of un-confoundedness (conditional independence) and the second assumption is that for matching to be satisfactory, a common support condition needs to be satisfied. This implies that there has to be an overlap in the distribution of observable characteristics between adopters and non-adopters of the technology (Jelliffe et al., 2018).
Empirically, improved variety adoption is regressed on a vector of observable Z as was stated in equation 1. Propensity scores are generated (ranging from 0 to 1) from the regression by a Probit estimation (Hirano et al., 2003).
The generated propensity scores follow,
The equation represents the probability of a rice farmer adopting the improved technology. These scores are used to match farmers based on their adoption to non-adopters in the sampled data set. There exist different algorithms used in PSM for matching samples. Each of these matching methods is specific and unique in its way and is used to match adopters to non-adopters (Caliendo and Kopeinig, 2008; Imbens, 2004). The matching methods considered in this study are; Nearest Neighbor matching (NNM), Kernel matching (KM), and Radius matching (RM).
After generating the propensity scores, the covariates balancing property and the overlap over the determined common support are investigated. The overlap assumption enables comparable treatments between the adopters and non-adopters. However, to handle the issue of dimensionality, Rosenbaum and Rubin (1985) showed that if the potential outcome of the treated (Y1) and the control (Y0) are independent of the treatment variables conditioned on the covariates (X), this implies that they are also independent of the treatment conditional on the generated propensity score as shown on equation 4 below;
Several different techniques can be used to check the quality of covariates in the match (Harder et al., 2010). The method used in checking the balancing quality of the covariates in this study is the standardized bias of each of the covariates used in the matching. The absolute difference in sample means between the treatment and the comparison groups are observed in percentages to ensure that there is no significant difference and that they are close to 0 and 1 before and after matching respectively (Rosenbaum and Rubin, 1985).The last step of PSM consists of calculating the average treatment effect (ATT), the calculated mean between the matched groups (adopters and non-adopters) is done following previous studies (Hirano et al., 2003; Imbens, 2004), presented as follows;
Where Y1 is the outcome variable for adopters
Y0 is the outcome indicator for non-adopters
V is an adoption decision for the improved variety
The Endogenous Switching Regression (ESR) Model
The ESR model has been identified as a model that can correct for selection bias that could arise from both observed and unobserved variables within a dataset. This model is recommended by the works such as (Bekele et al., 2014; Maddala, 1983). In the context of this study, the impact of improved variety adoption is estimated in two stages. While the first stage of the impact estimation dwells on the decision by farmers to adopt or not to adopt the improved variety as was seen in equation (1), the second stage estimates two outcome equations from two regimes, representing both adopters and non-adopters of the technology. These two regimes are estimated as below;
Where in;
Y1 and Y2 are the farmer’s outcomes for regime 1 (adopters) and regime 2 (non-adopters) respectively.
Xi represents the vector of the covariates to be a farmer i,
β1 and β2 are parameters to be estimated
ε1i and ε2i are the error terms associated with the outcome variables
The error terms are assumed to have a tri-variate normal distribution with the following covariance having a zero mean;
Where in;
is the variance of the error term in the selection equation (1)
, and represent the variance of the error terms in the outcome equations (6 and 7)
, and are covariance of ƞ, ε1i and ε2i. The covariance between ε1i and ε2i is not defined since Y1 and Y2 are not observed simultaneously (Maddala et al., 1983). The respective values of the error terms are non-zero since there is a correlation between the error term of equation 1 and the outcome equations (6 and 7).
Where in,
𝜙(.) Represents the standard normal probability density function, (.) is the standard normal cumulative density function.
λ1i and λ2i represent Inverse Mills Ratios (IMR) calculated from equation (1) with equations 9 and 10 and included in the outcome 6 and 7 to correct selection bias from unobservable factors. This can be written as follows;
Where in;
δ1i and δ2i are error terms with conditional zero means
To ensure that the estimated results have good consistency, the endogenous regression applied in this study made use of the Full Information Maximum Likelihood (FIML) approach (Lokshin and Sajaia, 2004). The ESR model requires at least a variable in Z that is not among the X variables. Such a variable is used as the exclusion restriction. Therefore the initial selection equation (1) earlier stated included among its variables, two potential instruments which can have an influence on farmers’ adoption decisions but not have a direct influence on their crop productivity or farm income. The first instrument used was the variable ‘need for extension’. Farmers were asked if they needed extension services and their responses were coded as dummy responses with 1 for those who needed them and 0 for those who didn’t need extension services. This instrument could influence farmers adopting new varieties given that adopting farmers have better chances of being attended to by extension agents for follow-up of the introduced technology. The second instrument used was “availability of warehouse” to store paddy rice before marketing. It had a dummy response for a ‘yes or no’ response. The availability of a warehouse by a farming household could influence adoption decisions as improved varieties sell at a better price if they are stored and well-dried to the required moisture content before being sold.
To check for the validity of these two instruments on the adoption decision and outcome variables, a Probit regression is applied on the selection equation 1 while an OLS regression is applied on the outcome equations 6 and 7. The significance of the variables is checked on the equations to observe which is significant. The results showed a significant influence on the adoption decision by both instruments(extension need and warehouse availability) however, there is a significant influence on adopters and an insignificant influence on non–adopters’ rice productivity (F = 0.072(2), P-value = 0.813) and income (F = 0.076(2), P = 0.384).
From the equation on the distribution of the error terms, the log-likelihood function can be expressed as follows;
Where in;
θji = , with j = 1,2 and ρj (ρ1= and ρ2 = ) represents the correlation coefficients of the error term of the selection equation (1) and the error term of the outcome equations (6 and 7). During the estimation, if any of the correlation coefficients of ρ1 or ρ2 are statistically significant, it confirms the issue of a selectivity bias resulting from un-observed variables (Gbodja et al., 2020), and this further justifies the appropriateness of the Endogenous switching regression model.
If ρ1 > 0 indicating negative selection bias implies that farmers with below-average outcomes will most likely choose to adopt the IRV.
when ρ1 or ρ2 shows alternative signs, it indicates that farmers choose to adopt the IRV based on the comparative advantage they observed in which adopters have above–average outcomes from adopting and non-adopters have below-average from not adopting the IRV.
The estimated coefficients from the ESR analysis enable the calculation of the average treatment effect on the treated (ATT). As such, the observed and un-observed adoption counterfactual outcomes can be derived as follows;
The observed outcome (a), for adopters of the technology, is computed from equation 14 while Equation 15 computes the observed outcome (b) for non-adopters of the technology. The expected outcome (c) from equation 15 represents the counterfactual of the observed outcome (a) earlier computed from equation 14. This expected outcome expresses what would have happened if the farmers had decided not to adopt the IRV. On the other hand, equation 17 is the counterfactual outcome (d) for the observed outcome of equation 15, representing the scenario under which the farmers decided to adopt the IRV. Un-bias treatment effects can be computed from these outcomes in equations 14, 15, 16, 17. The ATT (average treatment effect on the treated) is calculated as the difference observed between equations 14 and 16 (a–c) while the average treatment effect on the untreated (ATU), represents the difference observed between equations 16 and 14 (d-b),
ATT and ATU are calculated as follows;
Results and Discussions
Descriptive Statistics
The descriptive statistics of the data analyzed show that 156 farmers adopted the improved varieties while 265 farmers did not adopt them. Female farmers presented 58% of the total number while male farmers 42 % of them were male. ‘Table 2’ presents the mean characteristics difference between both groups of farmers surveyed.
Table 2.
Descriptive differences between adopters and non-adopters
| Variables | Description |
Combined (421) Mean |
Adopters (156) Mean |
Mean Difference |
Non-adopters (265) Mean | t-value |
| Gender | Sex of farmer, 1 for male and 0 for female | .58 | .56 | .031 | .59 | .614 |
| Age | Age of farmers (Number of years) | 37.8 | 39.7 | -2.96 | 36.7 | -2.89** |
| Education | Level of formal education achieved | 1.96 | 2.08 | -.179 | 1.90 | -1.47 |
| Household labor | Active number of farming laborers | 3.29 | 3.55 | -.423 | 3.13 | -2.16* |
| Non-farm income | Range of other sources of monthly income | 1.96 | 1.91 | .078 | 1.99 | .901 |
| Experience | Rice farming experience (Number of years) | 2.67 | 2.76 | -.141 | 2.62 | -1.37 |
| Farm size | Actual farm size use for growing rice (hectares) | .641 | .784 | -.228 | .556 | -3.73*** |
|
Farmer’s group (dummy) |
Farming group membership, 1 for members and 0 for non- members | .39 | .69 | -.479 | .21 | -11.01*** |
|
Seed source (dummy) |
Seeds gotten from UNVDA (1 for yes) or other sources (0 for others) | .40 | .84 | -.696 | .14 | -19.30*** |
|
Training (dummy) |
Training attendance in the last 2 farming seasons (1 for Yes and 0 for No) | .45 | .81 | -.576 | .24 | -13.26*** |
|
Extension visits (dummy) |
If extension workers visited their farms during the growing season (1 for Yes and 0 for No) | .43 | .84 | -.644 | .20 | -16.47*** |
|
Credit Access (dummy) |
If inputs loans were given or not (1 for Yes and 0 for No) | .35 | .38 | -.053 | .33 | -1.08 |
|
Reason to produce (dummy) | Main reason for growing rice | .37 | .281 | -.252 | 2.56 | -4.05*** |
|
Sales infos (dummy) |
Knowledge of rice market price at harvesting time (1 for yes and 0 for No) | .36 | .74 | -.586 | .15 | -14.84*** |
| Productivity | Quantity of rice produce per hectare (kg/ha) | 4.08 | 4.76 | -1.07 | 3.68 | -13.32*** |
| Rice income | Income generated from sales of rice | 662.4 | 952.5 | -460.8 | 491.6 | -33.73*** |
|
Warehouse (dummy) |
Availability space to store harvested paddy (1 for yes and 0 for No) | .59 | .58 | .009 | .59 | .183 |
|
Extension needs (dummy) |
Expressed desired for extension visit (1 for yes and 0 for No) | .82 | .90 | -.131 | .77 | -2.16* |
The independent t-test for both groups shows a significant difference between adopters and non-adopters. The mean average rice productivity for adopters was 4.76 tons/ha while the average productivity for non-adopters was 3.68 tons/ha. Adopters had an average income of 952500 FCFA while non-adopters had 491600 FCFA. This significant difference in yield and income clearly shows the importance of improved rice varieties within the study area. The average farm size for adopters was 0.78 ha while that of non-adopters was 0.55 ha. Farm size also showed a difference in terms of area cultivated.
Econometric Results
Propensity score matching
The results on factors influencing the adoption decision are presented in ‘Table 3’. The marginal effect of the estimation, identified improved variety adoption to be influenced by educational level, farm size, Farming group, source of seeds, training, extension need, and extension visits. These factors showed a positive and statistically significant impact on the decision to adopt the technology. On the other hand, factors such as income and access to credit had a negative but significant impact on the adoption by the farmers.
Table 3.
Probit estimation on technology adoption
| Variables | Coefficients | Marginal effects |
| Gender | -.142(.256) | -.0109 |
| Age | -.003(.016) | -.0002 |
| Educational Status | .207(.101)* | .0158* |
| Household Labour | .015(.078) | .0011 |
| Non-farm Income | -.352(.136)* | -.0269* |
| Farming Experience | -.216(.133) | -.0165 |
| Farm Size | .729(.202)*** | .0557*** |
| Farmer’s Group member | .437(.140)** | .0334** |
| Source of seed | 2.063(.268)*** | .15769*** |
| Training | 1.558(.283)*** | .1190*** |
| Extension | 1.787(.293)*** | .1365*** |
| Credit Access | -.5905(.2726)* | -.0451* |
| Reason of production | .3633(.2046) | .0277 |
| Extension need | 2.173(.313)*** | .1660*** |
| Intercept | -4.508(.936)*** | |
| Log Likelihood | -58.18 | |
| LR test | 130.65*** | |
| Number of observations. | 421 | 421 |
The common support balancing test of the propensity matching showed satisfactory as 98.8% of the matched samples fell within the common support zone. The propensity scores generated ranged from 0.000264 to 0.998, in which the scores of adopters ranged from 0.0382 to 0.998 while that of non-adopters ranged from 0.000264 to 0.879. The matching overlap between adopters and non-adopters is better presented in ‘Fig. 1’ and ‘Fig. 2’.
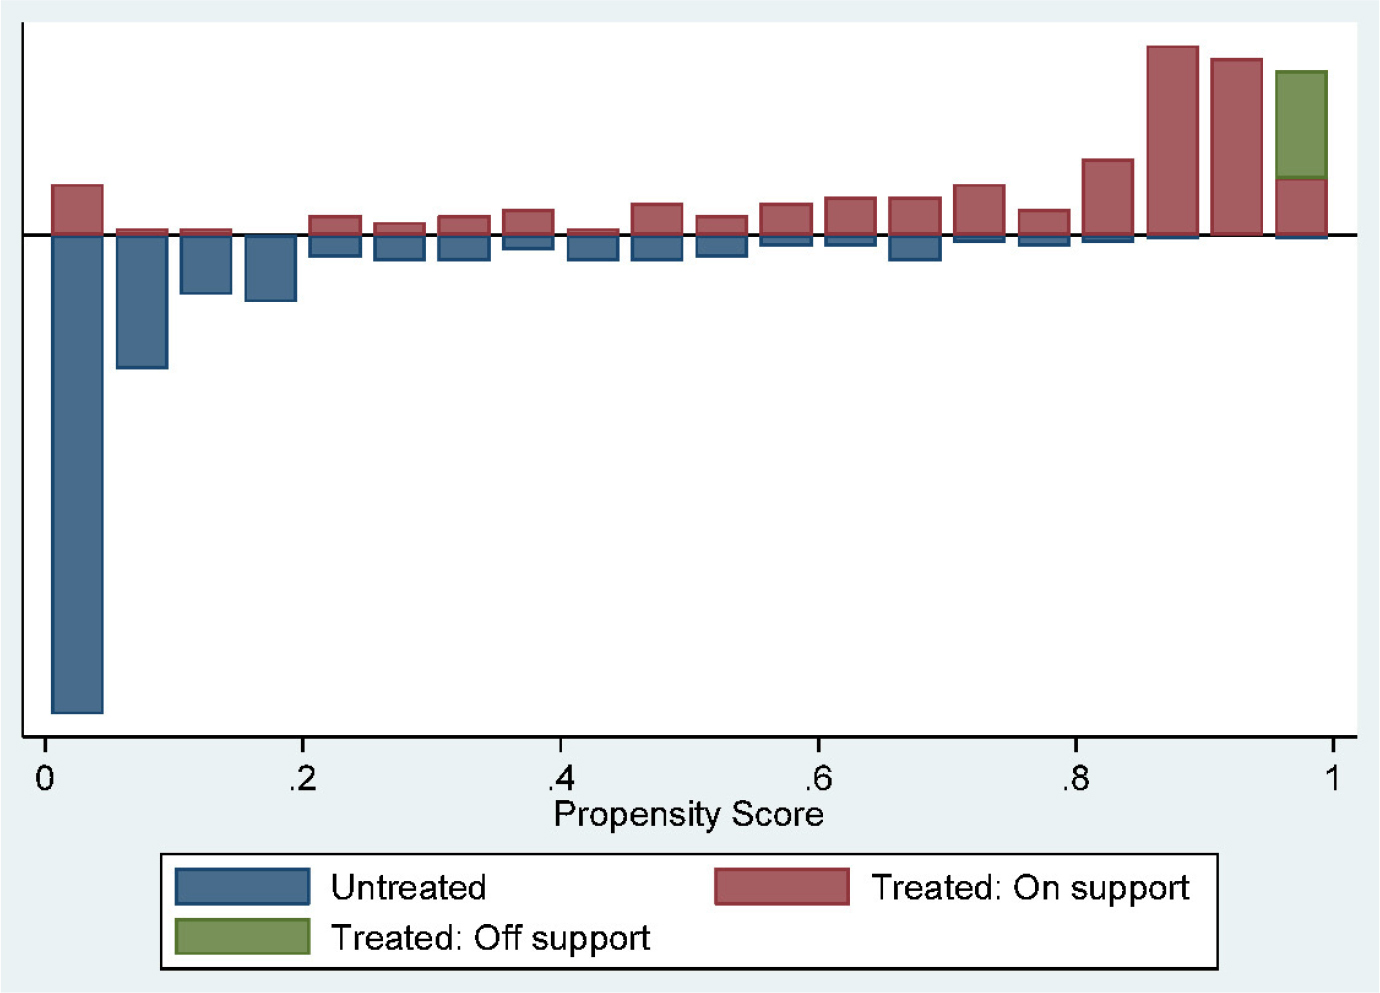
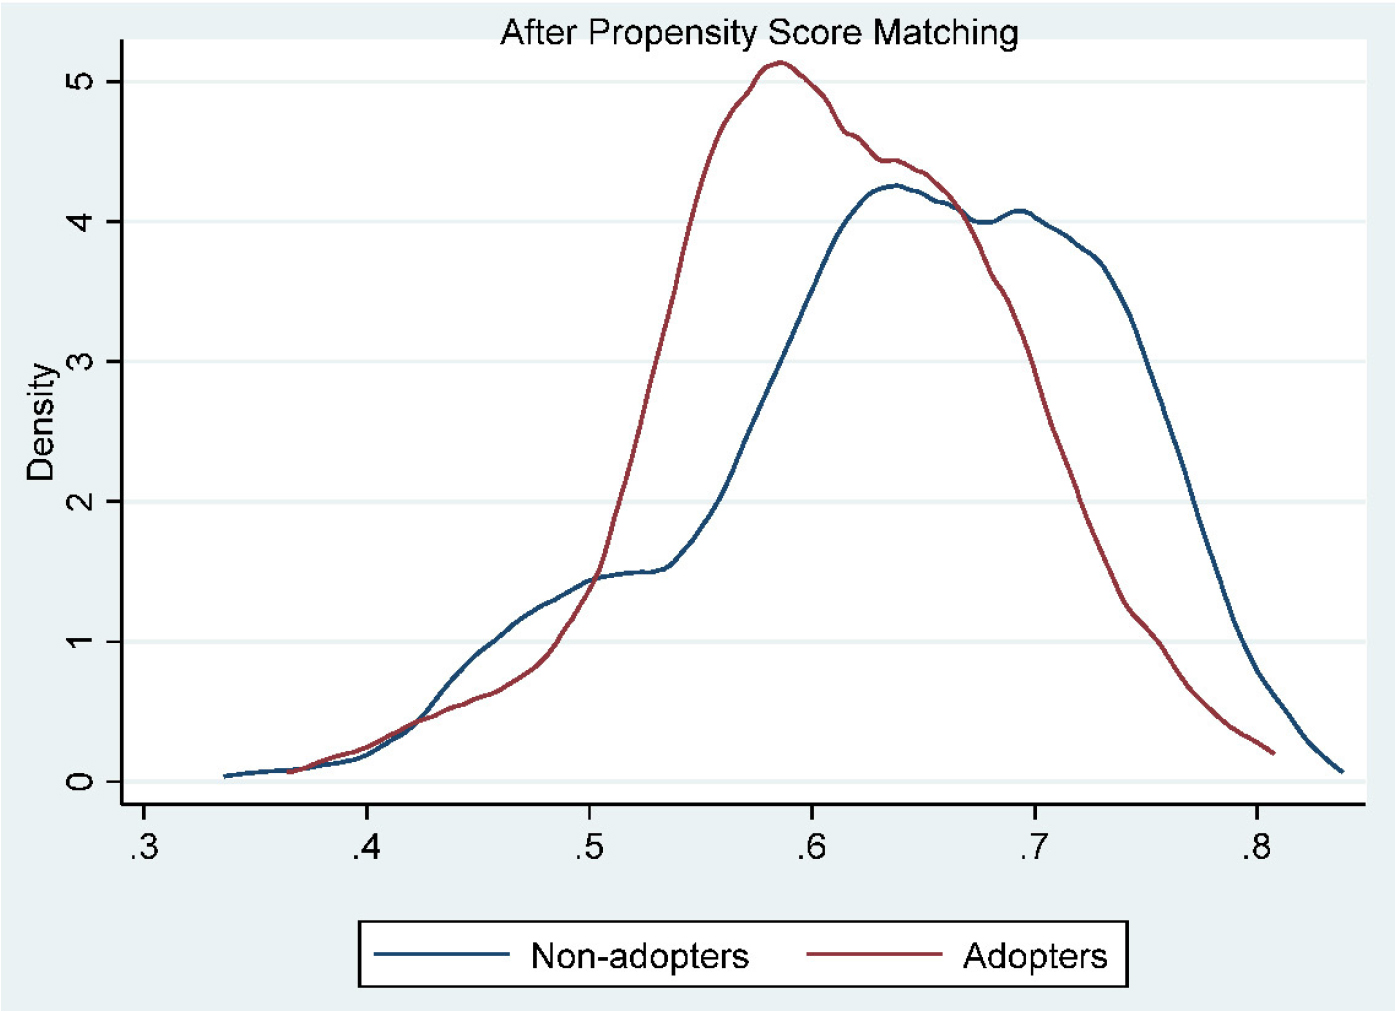
The untreated path represents the distribution of non-adopting farming households while the treated represents the adopters of the technology and the support represents the matching overlap areas between the two groups after matching. Both figures show just a few of the samples are off support from the total sample. This result clearly shows a good match, indicating that the overlap assumption for matching both groups in the study was satisfied.
Quality test of matching covariates
The matching quality test before and after the matching of the covariates considered in the study are presented in ‘Table 4’. The results clearly showed a satisfactory balance after the match between the adopting and non-adopting groups used in the match. The standardized mean difference for the overall covariates used for the matching reduced from 34% before matching to 7.8% after matching. The likelihood ratio test showed that the null hypothesis of the joint significance of all the covariates could be rejected before matching (P > X2 = 0.000). However, the likelihood test results after the matching for the joint significance of all covariates could not be rejected as its P values showed (P > X2 = 0.486). The very high % bias reduction of the variables, clearly shows that the balancing property of the distribution of propensity score for the data set was satisfied.
Table 4.
Quality indicators before and after propensity score matching
| Parameters | Before matching | After matching |
| Pseudo R2 | 0.210 | 0.013 |
| LR X2 | 116.47 | 5.46 |
| P-value (P > X2) | 0.000 | 0.486 |
| Mean Standardized bias% | 34.0 | 7.8 |
| Med Bias | 18.5 | 6.9 |
| B | 120.7 | 27.0 |
| R | 1.38 | 0.83 |
| % Var | 20 | 0 |
Table 5.
Propensity score matching-based average treatment effects of adopting improved rice varieties on productivity and income
| Matching Algorithm | Treated | control | ATT | S.E | impact (%) | |
|
Crop productivity (kg/ha) | Nearest Neighbor | 4759.4 | 3599.9 | 1159.4 | 114.78*** | 24.4 |
| Radius matching | 4759.4 | 3687.5 | 1071.8 | 76.54*** | 22.5 | |
| Kernel matching | 4759.4 | 3604.4 | 1154.9 | 112.9*** | 24.3 | |
|
Crop income (x1000FCFA/ha) | Nearest Neighbor | 951.8 | 471.9 | 479.8 | 18.8*** | 50.4 |
| Radius(.01) | 951.8 | 491.6 | 460.2 | 14.7*** | 48.4 | |
| Kernel matching | 951.8 | 473.8 | 478.0 | 18.8*** | 49.8 |
Propensity score Matching Average Treatment Effect
The results of the average treatment effect on the treated from the PSM estimation are presented in ‘Table 5’. The analysis considered 500 replications for bootstrapping the standard errors to ensure that the results were robust. Three matching algorithms were used: Kernel matching, Nearest Neighbor matching, and radius matching (0.01). The results of these matching methods for both crop productivity and crop income were all positive, statistically significant, and consistent in range. For the effect of adoption on crop productivity, the Nearest Neighbor matching was 24.4% treatment effect, the Radius matching was 22.5% and the Kernel matching showed a 24.3% impact on adopters of the technology. For the effect of adoption on crop income, the percentage change in income for the matching methods was as follows; 50.4% increase for the Nearest Neighbor matching, 48.4 % for Radius matching, and 49.8% for Kernel matching. These results show the percentage increase that adopting improved rice varieties within the surveyed population had as impact on their crop productivity and crop income.
Endogenous Switching Regression Results
The estimated coefficients of the selection equations for both crop productivity and income are significantly different from zero. This suggests that both observed and unobserved factors influenced farmers’ decisions on the adoption of the improved varieties. This comforts our choice of model since it handles the problem of endogeneity.
The results of the endogenous switching regression with crop productivity as an outcome variable considering the adoption tendency are presented in ‘Table 6’. The first column (1) represents results from the first stage of the selection equation earlier defined while column (2) represents the results of the second stage estimation for adopters of the technology and column (3) represents results for the non-adopters. Crop productivity was the dependent variable and was measured in kilograms per hectare (kg/ha). The selected data set fits the chosen model as confirmed by the Wald test and the LR test (6.59) which is statistically significant at 1% (p < 0.000). The chosen ESR model was appropriate for the analysis unlike an exogenous model in which applying ordinary least squares would have resulted in biased results.
Table 6.
Endogenous switching regression on rice productivity
| Selection Equation (1) | Adopters (2) | Non-Adopters (3) | |
| Intercept | -3.274(.626)*** | 3496.3(417.4)*** | 3492(242.9)*** |
| Gender | -.0965(.286) | 43.43(130.6) | 80.27(93.48) |
| Age | .008(.013) | 14.98(7.36)* | -4.48(5.17) |
| Educational level | .232(.118)* | -66.55(52.9) | -9.57(38.81) |
| Household labor | .014(.073) | -68.10(34.7)* | 9.89(24.76) |
| Non-farm Income | -.507(.162)** | 41.18(66.50) | -22.49(55.15) |
| Experience | -.173(.139) | -61.01(68.48) | 64.29(55.3) |
| Farmer’s group | .841(.273)** | 689.99(136.06)*** | -99.62(117.1) |
| Farm size | .416(.269) | 314.03(100.5)** | 246.48(84.98)** |
| Training | 1.09(.312)*** | -308.66 (182.71) | -49.79(121.8) |
| Extension Visits | 1.284(.296)*** | 42.43(172.80) | 317.3(129.2)* |
| Credit Access | -.516(.285)* | 285.20(136.67)* | 44.61(109.9) |
| Warehouse | 1.070(.280)*** | 430.75(141)** | 17.82(151.4) |
| Extension need | 1.712(.306)*** | 73.15(145.67) | 112.8(149.1) |
| 6.63(.060)*** | |||
| 6.590(.0434)*** | |||
| ρ1 | 1.375(.506)** | ||
| ρ2 | .0201(.271) | ||
| Log Likelihood | -3420.51 | ||
| Observations | 414 | 156 | 258 |
| Prob > X2 | 0.0000 | ||
| LR test of Indep. eqns | Prob > X2 = 0.0103 |
Except for the variable access to seed and warehouse availability, the estimation results of the other variables are similar to the Probit result earlier observed in this study. The exclusion restriction variable availability of warehouse is statistically significant only for the adopted farming households on both the productivity and farm income models. The correlation coefficient between improved variety adoption on both the crop productivity and farm income were all positive but statistically significant only for the adopters of the technology. This result confirms the presence of selection bias within both models. This result suggests that both observed and unobserved factors influence the adoption of the improved varieties and affect the productivity and farm income of the farmers in the study area. The improved variety adopters had a higher productivity and farm income over the non-adopters as observed in the value of the coefficients.
As observed in ‘Table 6’, the age of the farmers, membership in farming groups, farm size, credit access, and availability of warehouse all had a positive and statistically significant associated with the productivity of adopting farmers. For every unit of increase in their age and farm size, their probability of productivity increased. Household labor rather had a negative and statistically significant effect on the productivity of improved varieties. This result agrees with the findings of Anki (2016), and Musa et al. (2017) who in similar studies in Cameroon and Ethiopia respectively, found that farm size, credit access, and farming group membership all had a positive and significant association with the adoption of improved rice varieties.
For non-adopting farmers, extension visits had a positive and significant effect on their productivity. Farmers who had regular extension visits saw their productivity increase. Secondly, their farm size had a positive and significant effect on their productivity. For every increase in farm size unit, their crop productivity increased. This increase is significantly lower than that earlier observed for adopting farmers. This result agrees with the findings of Kijima et al. (2008) and can be justified by the fact that adopting farmers had a comparative advantage of participation over non-adopting households as confirmed by the significance level of variance coefficient (ρ1). However, ρ1 and ρ2 all have the same signs indicating that all the farmers had above-average productivity and farm income whether or not they adopted however they are better off being adopters of the improved varieties.
Endogenous Switching Regression (ESR) on crop income
The results of the ESR estimation on the crop income are presented in ‘Table 7’. The data set was appropriate to be analyzed using the ESR model as confirmed by the LR test which is significant at 1%. The outcome equations from the ESR show that the farm income of adopting farmers was positively and significantly affected by age, farmers’ group membership, credit access, and availability of the warehouse. Active household labor had a negative but significant effect on the farm income of adopters. Non-adopters had their farm income positively and significantly determined by extension visits while farmers’ group membership had a negative and significant effect on their farm income. The correlation coefficients for both regimes were positive, attesting to the rejection of the hypothesis of a non-selection bias. The coefficient was significant for regime 1 and not for regime 2 indicating that adopting farmers had a better or higher farm income than non-adopting households. The significance level of (rho) in regime 1 and not in regime 2, attest that adopting households had a comparative advantage over non-adopting households.
Table 7.
Endogenous switching regression on farmers’ income
| Selection Equation (1) | Adopters (2) | Non-Adopters (3) | |
| Intercept | -3.282(.627)*** | 699.9(83.5)*** | 469.3(34.03)*** |
| Gender | -.1104(.287) | 8.5(26.12) | 9.70(13.10) |
| Age | .008(.013) | 2.99(1.47)* | -.976(.723) |
| Educational level | .232(.118)* | -13.30(10.58) | -.817(5.43) |
| Household labor | .016(.073) | -13.58(6.9)* | 2.07(3.47) |
| Non-farm Income | -.512(.162)** | 8.21(13.29) | -3.41(7.725) |
| Experience | -.172(.139) | -12.27(13.6) | 11.32(7.73) |
| Farmer’s group | .845(.275)** | 137.8(27.2)*** | -34.46(16.35)* |
| Farm size | .419(.272) | 62.65(20.1)** | 28(11.90)* |
| Training | 1.10(.312)*** | -62.02(36.51) | -5.39(16.91) |
| Extension Visits | 1.30(.294)*** | 8.58 (34.5) | 51.00(17.89)** |
| Credit Access | -.522(.285) | 86.40(28.31)* | 5.10(15.34) |
| Warehouse availability | 1.087 (.279)*** | 430.75(141)** | 16.51(20.85) |
| Extension need | 1.717 (.313)*** | 14.35(29.14) | 28.83(20.51) |
| 5.028(.0604)*** | |||
| 4.626(.0434)*** | |||
| ρ1 | 1.362(.5021)** | ||
| ρ2 | .0817(.2456) | ||
| Log Likelihood | -3420.51 | ||
| Observations | 414 | 156 | 258 |
| LR Prob > X2 | 0.0097 |
ESR-based Average Treatment Effect on the Treated and Non-treated
The model estimated the mean outcomes of the treated farmers and the corresponding counterfactual outcomes. It answered the question of “what would have been the crop productivity/income if the farmers didn’t receive the treatment?”. The average treatment effect on the treated (ATT) and the average treatment effect on the untreated (ATU) were calculated. The estimation reveals that the treatment effect of improved variety adoption on crop productivity and crop income is positive and statistically significant from zero. The ATT is 765200 FCFA/ha and 2615.1 Kg/ha for crop income and productivity respectively, as presented in ‘Table 8’.
Adopting the improved variety significantly improves crop income and productivity by 24.6% and 45.2% respectively. If the non-adopters of the technology decided to adopt the technology, their crop income and productivity would have increased by 41.6% and 10.7% respectively. This drastic increase in crop income can be justified by the difference in market price between improved paddy and non-improved paddy. The marginal effect estimation of the factors influencing adoption with the sampled farmers highlighted some key factors that guided the decisions of farmers.
Table 8.
Endogenous switching regression-based average treatment effects of adopting improved varieties on productivity and income
| Decision stage | ||||
| INCOME (000FCFA) | To Adopt | Not to-adopt | Treatment Effect | Effect % |
| Adopters | 953.5 | 188.3 | 765.2*** | 24.6 |
| Non-adopters | 841.9 | 491 | 350.9*** | 41.6 |
| PRODUCTIVITY (Kg/ha) | ||||
| Adopters | 4767.8 | 2152.7 | 2615.1*** | 45.2 |
| Non-adopters | 4127.7 | 3687.5 | 440.2*** | 10.7 |
Analysis of these factors from the endogenous switching regression identifies the group-specific factors for both adopters and non-adopters of the technology. For farmers who adopted improved varieties, their age, farmers’ group membership, and ownership of the storage facility affected their adoption decisions positively. As the farmers became older, their probability of accepting the technology increased. Age comes with more wisdom and it’s believed that older farmers had more experience to enable them to compare technologies and decide on trying new ones. Their membership in farming groups had a positive effect on the adoption of the technology. This can be due to the numerous advantages that farming groups offer such as access to loans, training, and inputs provided by some farming groups. Farm size equally had a positive influence on adoption. This can be explained by the fact that farmers with larger farms find it easy to adopt new varieties as their fields can be shared to experiment with the new varieties alongside old varieties. These four factors were therefore observed as being positively and statistically significant on improved variety adoption. These findings were coherent with the previous findings of Abebaw et al. (2022), Bezu et al. (2014), and Donkoh et al. (2019), who identified these characteristics to have a positive and significant influence on rice farmers’ decisions to adopt new rice and maize varieties in Ethiopia, Malawi, and Ghana respectively. On the other hand, the lack of credit and a warehouse had a negative and significant influence on the adoption of the technology. This can be explained by the fact that applying new technologies is costly and as such access to credits should be helpful to farmers but when access to credit is constrained, the decision to adopt improved varieties may be negatively influenced. These results agree with the findings of Kumara et al. (2020).
For farmers who didn’t adopt the improved varieties, the results identified farm size and extension visits to influence their non-adoption decision positively and significantly. Limited farm size could account for some farmers not being willing to try or adopt new varieties. The lack of regular extension visits to farmers’ fields could affect them not to adopt new technologies. This can be justified by the fact that new technologies usually required careful follow-up to achieve the expected benefits from the technology. As such, when extension services are not available or visits are not regular, some farmers could be discouraged from adopting such technologies. This result agrees with the findings of Takahashi et al. (2020) who found that farmers in Tanzania had less probability of adopting new rice varieties dues to a lack of extension visits and that paddy yields were low on farms not visited by extension officers. Lastly, not belonging to farming groups had a negative and significant impact on non-adopters. Farmers’ groups play an important role in ensuring the productivity and well-being of farmers as confirmed by Adjin et al. (2020) on the impact of agricultural cooperatives on smallholder farmers in Senegal. Therefore where belonging to such groups is not possible, farmers may not have access to improved seeds, fertilizers, or input supports that could motivate them to adopt new technologies easily. Adjin et al. (2020), equally found that farmers in Senegal who belong to agricultural cooperatives had a significant increase in their outputs especially if they adopted new technologies.
The results of the average treatment effect from the analysis showed that rice productivity increased significantly by a range between 22.5% and 24.4% for farmers who adopted the varieties. Their income increased significantly by a range between 48.4% and 50.4%. These findings are similar to that of Abebaw et al. (2022), who using both PSM and ESR models observed that the impact of improved rice variety adoption in Ethiopia was consistent across the models and had a significant impact on the yield of rice and income of the crop on adopters of the technology. In another study done in Cameroon, Malaa et al. (2016) also found that farmers who adopted improved rice varieties like the New rice for Africa (NERICA), had a significant and positive increase in their yield and income.
The ESR-based ATT and ATU show that adopting improved rice varieties increased crop productivity and income significantly. Households that didn’t adopt could see their income increase by about 41.6 % and productivity increased by about 10.7% if they decided to adopt the improved varieties. Comparing the results across the both models shows a consistent and significant increase for the 2 outcome variables considered. These however, the PSM results are a little higher compared to the ESR results. This can be accounted for by the effects of unobserved heterogeneity which is not accounted for in the PSM approach. This notwithstanding, these results are consistent with other findings (Takahashi et al., 2014; Teklewold et al., 2013; Jaleta et al., 2015).
Conclusion
The two econometric models ensured that the potential effect of selection bias due to observable and non-observables characteristics was reduced to provide robust estimates of the desired estimators. The results obtained from the models were consistent and robust. Given that the results shows some difference in their adoption effects, any of the models could be retained for the analysis for a single analytical approach, However both models are used for most impact studies based on the nature of the available data. In the context of this study, the endogenous switching regression model for example provides answers to the specific impact of the explanatory variables on the different outcome variables and further presents the counterfactual effect of the adoption. These results indicate that adopting the improved varieties will significantly increase the yield and income of rice farmers in the study area. With these vital observations, this study put forward the following recommendations based on these findings.
Recommendations
1) This study identified credit access and limited household labor to be of negative influence on improved varieties adoption in the study area, farmers are encouraged to make use of other local technologies that could substitute for household labor such as the use of small hand machines, animal oxen, and agrochemicals. The adoption of such complimentary technologies will reduce the dependency on household labor for land preparation and weeding.
2) Secondly, the state and private stakeholders should help farmers gain easy access to input loans and credits from micro-finance institutions or from private contract farming agencies, to enable them to get the desired farm resources or inputs needed to ensure the adoption of new varieties.
3) Regular extension visit to farmers’ field is recommended. These services will positively guide farmers on the cultivation challenges that may arise from adopting new varieties and will equally encourage other farmers to adopt these improved varieties.
Finally, new varieties play a very important role in improving crop yields and subsequently farmers’ income and well-being. This study has presented a clear picture of the significant impact of such technologies in the study area. The government is encouraged to continue to finance the development and introduction of other improved and adaptable small-scale farm technologies that will not only boost the yields and income of farmers but that will largely contribute to alleviating poverty and ending hunger in the country.
