


Introduction
Materials and Methods
Feedstock characteristics and process overview
Basis for estimating capital and operating expenditures
Economic analysis
Scenario design
Monte Carlo simulation
Life cycle assessment
Results and Discussion
Capital Cost Structure
Operating Cost Structure
Revenue Allocation and Profitability Structure
Interpretation of Economic Performance Indicators
Quantitative Scenario-Based Financial assessment
Monte Carlo-Based Probabilistic Risk Assessment
Life Cycle Assessment
Conclusion
Introduction
As climate change escalates, the UN has characterised the situation as “global boiling,” underscoring the severity of environmental pollution and the escalating climate disaster (Bisset, 2023; Lionello and Scarascia, 2018; McCarthy et al., 2010). In these circumstances, climate change mitigation and sustainable waste valorisation are becoming important components of global carbon neutrality efforts. Consequently, interest in biomass-derived carbon-negative technologies is swiftly increasing. Biochar is a carbon-rich solid substance generated via thermochemical methods, capable of long-term atmospheric carbon dioxide storage by improving soil quality and facilitating carbon sequestration (Ennis et al., 2012; Lehmann and Joseph, 2009; Park et al., 2015, 2022). In addition, biochar exhibits high calorific value and fixed carbon content, making it attractive as a solid fuel alternative (Abdullah and Wu, 2009; Karaosmanoǧlu et al., 2000; Park et al., 2023, 2024; Waqas et al., 2018).
Agro-byproducts are produced in substantial volumes during agricultural operations, although their limited utilisation exacerbates environmental burdens. To transform these underutilised agricultural byproducts into energy sources or carbon sequestration materials, Lee et al. (2017) proposed a collection model to utilize agricultural residues. In particular, various studies have been conducted to utilize agricultural residues through pelletization (Park et al., 2020; Stulpinaite et al., 2023; Yang et al., 2014, 2018). Keil et al. (2010) indicated that agricultural byproducts, including soy stalk, maize stover, and alder chips, had remarkably low degradation rates when buried in deep-sea sediments, implying significant long-term carbon sequestration potential (Keil et al., 2010). Maroušek et al. (2022) showed that wood biochar, notably derived from infected or discarded wood, possesses significant economic and environmental potential, particularly in nutrient recycling and soil moisture preservation.
Nevertheless, current research on the commercial application of biochar has predominantly concentrated on its physical attributes, fuel characteristics, or effects on soil application in laboratory settings, whereas quantitative assessments of its economic and environmental performance at real production scales are still scarce. Carvalho et al. (2022) highlighted that biochar production substantially advances circular economy objectives, and life cycle assessment findings corroborate its efficacy in mitigating environmental impacts (Carvalho et al., 2022). Zhu et al. (2022) highlighted that the pyrolysis of agricultural leftovers is a viable method for achieving carbon neutrality. Life-cycle study indicated that biochar produced from crop leftovers can function as an energy source, soil amendment, and activated carbon (Zhu et al., 2022).
Coffee grounds are the residual waste left after coffee extraction, and it is known that approximately 0.99 kg of coffee grounds are generated for every 1 kg of coffee brewed (Kim and Ha, 2019). Despite efforts to employ coffee grounds in many applications, including mushroom growing substrates, bricks, air fresheners, and fertilisers, most remain unutilised and are disposed away (Kourmentza et al., 2018; Lee et al., 2023b; Muñoz Velasco et al., 2016). The social cost of disposing of these coffee grounds is estimated at over 764.2 billion KRW, underscoring the necessity for more varied and efficient utilisation techniques (Nam et al., 2017).
This work aims to fill the research gap by designing a small-scale (1 ton/day) biochar production system informed by prior research and doing an integrated analysis that combines Techno-Economic Analysis (TEA) and Life Cycle Assessment (LCA). The study specifically seeks to quantitatively evaluate the possible effects of a decentralised biochar production system using agricultural leftovers on climate change mitigation and area economic revitalisation. This is accomplished by a thorough assessment of material and energy balances derived from experimental data, estimation of capital and operational expenditures, revenue projections for biochar products, and the corresponding effects on carbon emission reduction.
Materials and Methods
Feedstock characteristics and process overview
While the coffee grounds show a high fixed carbon content and great calorific value, the red pepper stalks have a considerable lignin concentration and a compact structure, which results in a significant biochar output (Lee et al., 2023a; Park et al., 2017, 2020). The optimal composition is determined by the experimental results of our previous research and the previous literature, with a mixing ratio of 8:2 (Park et al., 2021). This study was conducted based on the existing experimental data to conduct a statistical evaluation of environmental sustainability and economic viability.
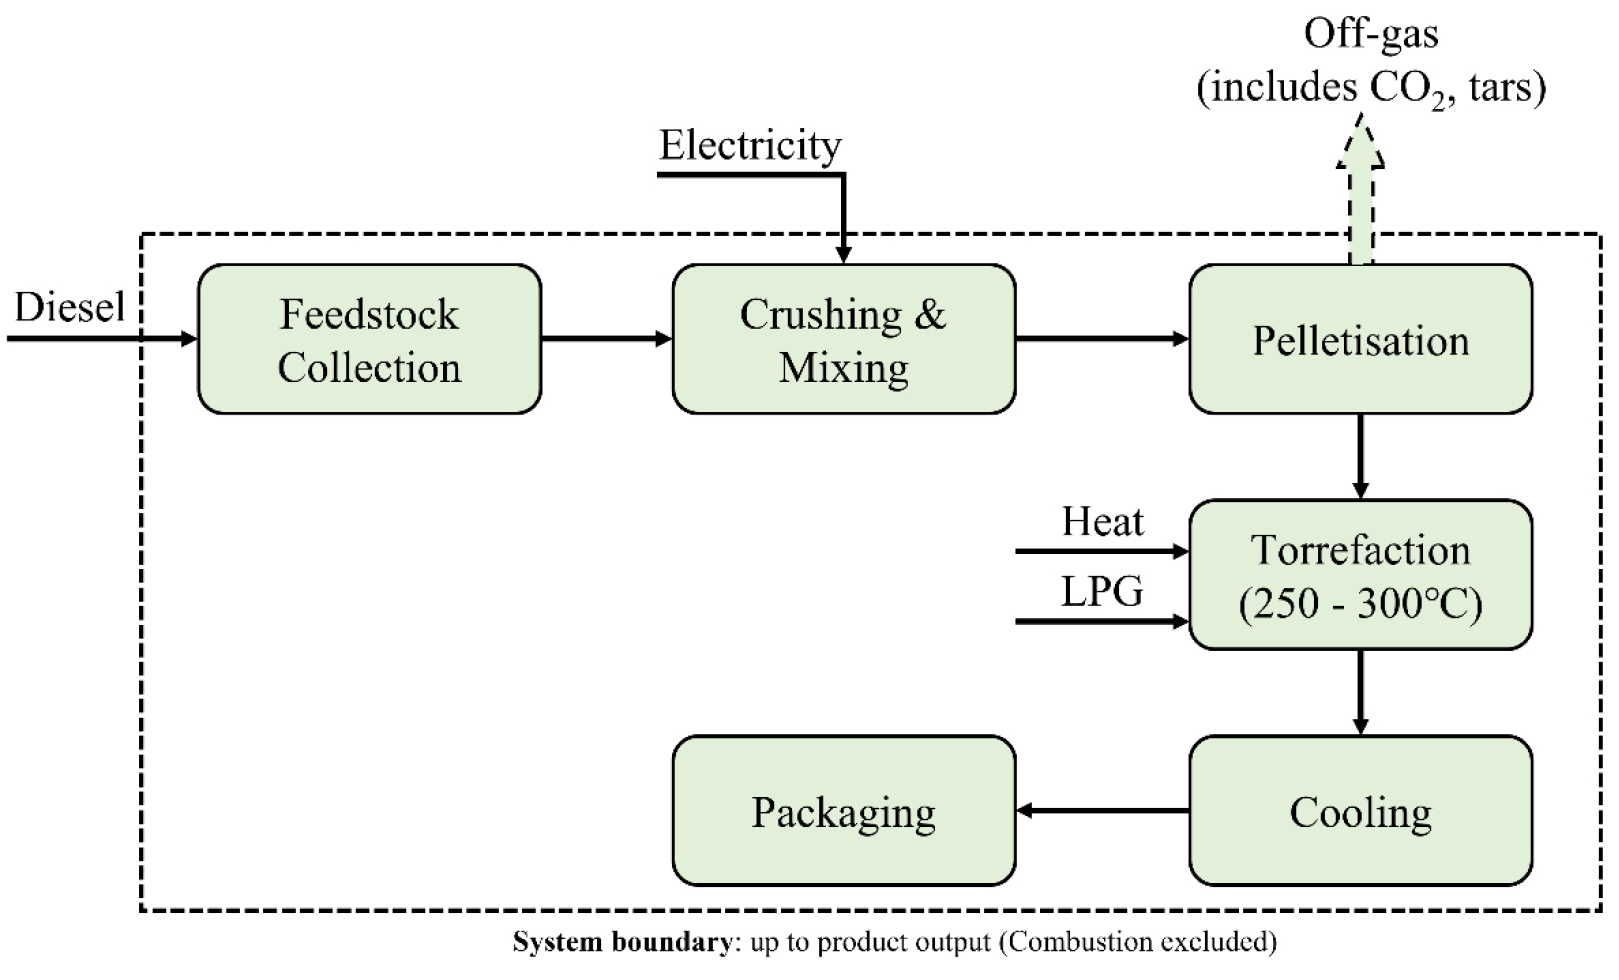
The procedure consisted of five stages: collection, crushing and mixing, pelletisation, torrefaction, chilling, and packaging. A daily capacity of 1 tonne and an annual capacity of 300 tonne were designed into the technique. In an oxygen-free environment, the torrefaction reactor is elevated to 250-300°C to catalyse thermal degradation reactions. Fig. 1 shows the process flow diagram of the torrefaction system.
Basis for estimating capital and operating expenditures
Capital expenditures
The equipment costs were determined using the cost estimating formula outlined in Turton et al. (2008), while considering the specifications and capacities of equivalent pilot systems (Turton et al., 2008). Equipment references and scaling factors were reported in Table 1. The equipment cost was estimated as following Eq. (1).
where, Costref refers standard equipment cost, Size stands for equipment capacity, n represents the scale index, and Ft represents the correction factor. Below is the estimation standard table used in this study.
Literature-based reference equipment costs reported in USD were used as reference values for equipment scaling. To maintain currency consistency, USD-denominated values were standardised using the 2023 annual average exchange rate (1 USD = 1,306.76 KRW), and all final TEA results are presented in KRW. The KRW-based equipment costs therefore reflect scaled estimates rather than direct one-to-one currency conversion from the reference values.
Table 1.
Standard Equipment Cost and Scale Index for System Design
The estimations were derived from the pilot system unit cost associated with the development of technologies for processing agricultural and forestry by-products and energy resources (Kang et al., 2010; Kim et al., 2024) and the NREL process economic analysis report (Davis et al., 2013). Estimated capital cost was summarised as Table 2.
Table 2.
Estimated capital costs for key equipment components
Operation expenditure
Operating expenses (OPEX) were itemised as follows, predicated on the processing of 300 tonnes of biomass annually. The overall annual OPEX was determined to cost approximately 156.86 million won, based on actual industrial unit prices and literature data for each item. Detail OPEX was summarised as Table 3.
Table 3.
Annual operating expenses breakdown for biochar production system
Economic analysis
In order to evaluate the economic feasibility of the biochar manufacturing system, this study implemented pertinent economic evaluation metrics, such as the internal rate of return (IRR), repayment period, benefit-cost ratio (B/C), and net present value (NPV). NPV represents the present value of anticipated earnings, which is a measure of investment profitability (Solarte-Toro et al., 2021). NPV is expressed by the following Eq. (2).
IRR, on the other hand, is the discount rate at which NPV equals zero, which indicates the expected rate of return of the project (Cardoso et al., 2019). The B/C Ratio denotes the proportion of benefits to costs, calculated in present value, that is used to evaluate economic efficiency, while the Payback Period denotes the duration required to recover the initial investment (Ceglia et al., 2022). B/C ratio is referred by the Eq. (3)
where, Bt and Ct refers the present values of benefits and costs at time t, respectively and r is the discount rate. t1 and t2 denote the time periods when benefits and costs occur.
Long-term profitability was evaluated using the return on investment (ROI), defined as the ratio of cumulative net income over the project lifetime to the initial capital investment. The evaluation criterion was established with a 5% discount rate and a 20-year operational duration. The income was established based on the selling price of biochar at 750 thousand won per tonne, with an annual production of 300 tonnes and an 80% mass yield. It is expressed as Eq. (4).
Scenario design
To evaluate the economic sensitivity of the decentralised biochar production system, five scenarios (S1-S5) were constructed by systematically varying labour intensity, transport cost burden, and biochar selling price. The scenario definitions are summarised in Table 4.
S1 represents the reference configuration. In this scenario, transport cost is assumed to be zero from the operator’s perspective. This reflects a policy-supported condition in which biomass collection and transportation are classified as part of municipal waste management services. Under this framework, transport expenses are covered through public waste-disposal subsidies and therefore do not contribute directly to the project’s operating expenditure. However, transport activities are still assumed to occur physically, meaning that biomass is collected and delivered to the facility. Accordingly, transport is included in the life cycle inventory as tonne-kilometre demand in the LCA, while it is set to zero only in the TEA cash-flow calculation.
S2 maintains the same transport subsidy condition as S1 but reduces labour from four to three workers to examine the impact of workforce optimisation on economic performance. S3 introduces a transport cost of 180,000 KRW per trip while maintaining the baseline labour configuration. This scenario represents a market-based operating condition in which biomass transport is not subsidised and must be internally financed by the project operator.
S4 isolates the revenue-side effect by increasing the biochar selling price to 800,000 KRW per tonne while maintaining subsidised transport and baseline labour. S5 combines the transport cost burden introduced in S3 with the higher selling price applied in S4, thereby evaluating whether revenue enhancement can offset additional logistics costs under unsubsidised conditions. For clarity, the transport subsidy assumption affects only the TEA cash-flow boundary. Physical biomass transport was assumed to occur in all scenarios and was therefore consistently included in the LCA inventory as tonne-kilometre demand
Table 4.
Summary of each scenario assumptions
Monte Carlo simulation
Monte Carlo simulation is a probabilistic modelling technique that uses repeated random sampling to assess the impact of uncertainty in input parameters on output variables. It is widely applied in techno-economic and risk assessments to estimate the range and likelihood of possible outcomes under varying conditions (Colantoni et al., 2021; McNulty et al., 2021). The Monte Carlo simulation was applied independently to each deterministic scenario (S1-S5) in order to evaluate probabilistic robustness under the respective structural assumptions.
To quantify uncertainty in the key economic drivers of the decentralised biochar production system, a Monte Carlo simulation comprising 10,000 iterations was performed. Biochar selling price was modelled using a normal distribution with a mean equal to the baseline price and a standard deviation of 50,000 KRW. Mass yield was represented by a triangular distribution defined by a minimum of 0.75, a most-likely value of 0.80, and a maximum of 0.85. Labour cost was treated as a stochastic variable using a uniform distribution within ±10% of its baseline value, while annual transport frequency was described using a discrete uniform distribution ranging from 40 to 60 trips per year. All other structural financial parameters, including capital investment, depreciation method, tax rate, discount rate (5%), and project lifetime (20 years), were held constant in order to isolate the effects of operational and market uncertainty.
For each iteration, discounted cash-flow analysis was conducted over the 20-year project horizon, and key financial indicators—NPV, IRR, ROI, and payback period—were calculated to evaluate the probabilistic economic feasibility and financial robustness of the project.
Life cycle assessment
According to ISO 14044, a cradle-to-gate system boundary was defined for the environmental assessment (International Organization for Standardization, 2020). The life cycle assessment (LCA) was conducted using the Brightway2 framework implemented in Python (Mutel, 2017), enabling transparent life cycle inventory modelling and user-defined flow configuration. The system boundary included feedstock collection, shredding and mixing, pelletisation, and torrefaction up to the production stage. The end-use combustion stage and potential carbon sequestration credits were excluded to ensure consistency within the cradle-to-gate boundary.
The life cycle inventory was constructed using background datasets available in Brightway2 together with relevant biosphere emission flows (Centre, 2023). Energy inputs were modelled based on an electricity consumption of 200 kWh per tonne of biomass and a gross thermal energy demand of 1500 MJ per tonne. It was assumed that non-condensable torrefaction gases were internally combusted to supply process heat, achieving an internal heat recovery efficiency of 80%. Consequently, the net external heat requirement was reduced to 300 MJ per tonne, and only this net value was included in the LCA inventory in order to prevent double counting of carbon flows. In addition, LPG consumption of approximately 470 L per year was incorporated to represent auxiliary fuel demand during start-up and operational stabilisation (Bridgeman et al., 2008; Davis et al., 2025; Jones et al., 2011; Kalinci et al., 2009; Klein et al., 2021).
Transportation was modelled using a 5-ton truck with an average travel distance of 100 km per trip. Although transport cost may be subsidised under certain economic scenarios, physical transport activity was consistently included in the LCA inventory as tonne-kilometre demand.
To address methodological uncertainty in biogenic carbon accounting, two alternative approaches were evaluated. In the first approach, biogenic CO2 emissions were fully included in the calculation of global warming potential (GWP), reflecting a carbon-flow perspective in which all emitted CO2 is accounted for regardless of origin. In the second approach, biogenic CO2 emissions were excluded from the GWP results based on the conventional carbon-neutrality assumption for biomass within cradle-to-gate system boundaries. Global warming potential was calculated using the ILCD 2011 midpoint method and expressed in kg CO2eq.
Results and Discussion
Capital Cost Structure
The capital expenditure (CAPEX) of the decentralized biochar system was estimated by first determining the total direct equipment cost and subsequently applying installation, engineering, and contingency factors to obtain the installed capital investment. The detailed breakdown of CAPEX, including equipment and installation costs, is presented in Table 5. Based on the model, the total direct equipment cost amounts to approximately 165 million KRW. When installation (30%), engineering (10%), and contingency (10%) are incorporated, the final installed capital cost increases to approximately 248 million KRW. This stepwise expansion clearly demonstrates that the initial investment is not driven solely by the purchase price of process equipment, but also by the additional expenditures required to integrate the system into a functional operational unit. Even at small scale, indirect costs constitute a substantial share of total capital investment.
Among all equipment components, the torrefaction reactor represents the dominant capital item, reflecting its central role in thermal conversion performance. Supporting units such as the pelletiser, cyclone dust collector, mixer, and cooler contribute secondary but still significant portions of the total capital cost. The overall structure indicates that the system is moderately capital-intensive, particularly due to the thermal reactor subsystem. This composition implies that cost-reduction strategies should prioritise reactor design optimisation and modular integration. Any improvement in reactor efficiency or simplification of auxiliary systems could significantly reduce both capital intensity and downstream operating burden.
It should also be noted that although a working capital ratio exists in the assumptions sheet, working capital was not explicitly added to the initial cash outflow in the current model. Therefore, the reported capital cost represents installed plant investment without additional operating liquidity allocation. Inclusion of working capital would increase the initial negative cash flow and slightly reduce overall economic performance.
Table 5.
Capital expenditure breakdown of the decentralised biochar system
Operating Cost Structure
The annual operating expenditure consists of core operating inputs—electricity, thermal energy, LPG, and labour—combined with capital-linked costs such as maintenance and insurance (Table 6). According to the model, base operating costs amount to approximately 142 million KRW per year. Labour represents the largest single component of operating expenses, reflecting the labour-intensive nature of small-scale decentralised systems. Energy-related costs, including electricity and thermal input, account for a moderate share of total OPEX. LPG contributes only a minor portion. When maintenance (5% of installed CAPEX) and insurance (1% of installed CAPEX) are added, the total annual operating expenditure increases to approximately 156.86 million KRW.
The structure of OPEX highlights a critical characteristic of decentralised biochar facilities: labour costs dominate the cost profile more strongly than energy consumption. While improvements in thermal efficiency may reduce energy expenditure, their overall impact on profitability may be limited if labour structure remains unchanged. Therefore, operational optimisation strategies should not focus exclusively on energy performance but also consider automation, workforce rationalisation, or shared operational models to enhance economic sustainability.
Table 6.
Annual operating expenditure (OPEX) breakdown of the decentralised biochar system
| Item | Cost (million KRW/year) | Share (%) |
| Labour | 108 | 68.85 |
| Heat | 22.5 | 14.34 |
| Electricity | 10.40 | 6.63 |
| LPG | 1.08 | 0.69 |
| Maintenance | 12.40 | 7.91 |
| Insurance | 2.48 | 1.58 |
| Total OPEX | 156.86 | 100 |
Revenue Allocation and Profitability Structure
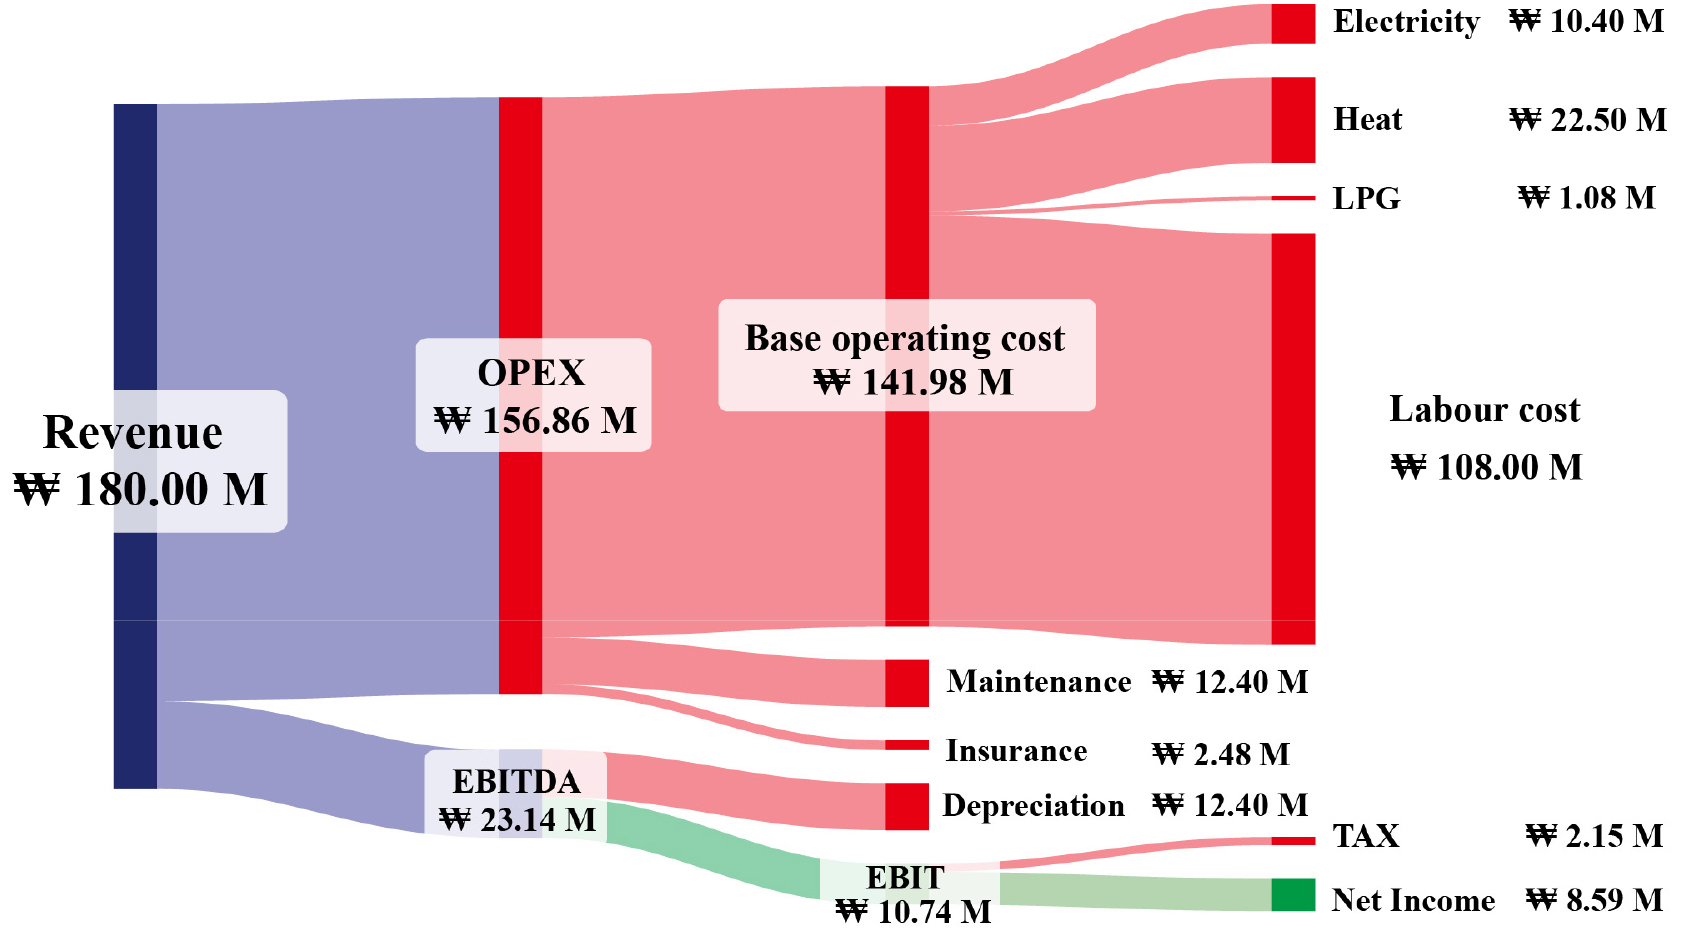
Annual revenue is generated from processing 300 tonnes of feedstock with an 80% mass yield and a biochar selling price of 750,000 KRW per tonne, resulting in total annual revenue of approximately 180 million KRW. The allocation of revenue within the financial structure is illustrated in Fig. 2. Of the total revenue, approximately 156.86 million KRW is consumed by OPEX. Labour cost constitutes the dominant component at 108 million KRW per year, representing nearly 60% of total revenue. This indicates that the economic performance of the decentralised biochar system is primarily constrained by fixed personnel expenses rather than variable energy inputs.
Energy-related costs, including electricity (10.40 million KRW), heat (22.50 million KRW), and LPG (1.08 million KRW), account for a smaller share of OPEX. Maintenance (12.40 million KRW) and insurance (2.48 million KRW) contribute moderately. After deducting OPEX, EBITDA amounts to approximately 23.14 million KRW. Depreciation, applied using straight-line allocation over the 20-year project life, is approximately 12.40 million KRW annually. Although depreciation does not represent an actual cash outflow, it reduces taxable income and therefore affects annual tax payments.
Following depreciation, EBIT reaches approximately 10.74 million KRW. After applying a corporate tax rate of 20%, annual net income is approximately 8.59 million KRW. When depreciation is added back, annual net cash flow remains above 20 million KRW. The cash-flow profile shows a substantial negative outflow in year zero due to CAPEX, followed by stable annual positive inflows throughout the operational lifetime. Cumulative cash flow gradually offsets the initial investment, with payback occurring at approximately ten years.
These results indicate that the system is economically feasible under the specified assumptions; however, profitability remains moderate and strongly dependent on long-term operational stability.
Interpretation of Economic Performance Indicators
The overall economic feasibility of the decentralised biochar production system was evaluated using key financial indicators, including NPV, IRR, ROI, and payback period. These indicators provide complementary perspectives on long-term profitability, capital efficiency, and investment attractiveness. Under the base-case scenario, the NPV calculated over a 20-year project lifetime at a 5% discount rate is positive, indicating that the present value of cumulative future cash inflows exceeds the initial capital investment. A positive NPV confirms that the project generates economic value beyond the assumed cost of capital and can therefore be considered financially viable under stable operating conditions.
Fig. 3 presents the cumulative cash flow profile over the project lifetime. The curve begins with a substantial negative value in Year 0, reflecting the upfront capital expenditure. Thereafter, the cumulative cash flow increases in an approximately linear manner, indicating relatively stable annual net cash flows. The intersection with the zero line occurs close to Year 10, marking the payback period. This gradual and steady recovery of capital highlights that the project’s financial sustainability is driven by long-term operational continuity rather than rapid short-term returns.
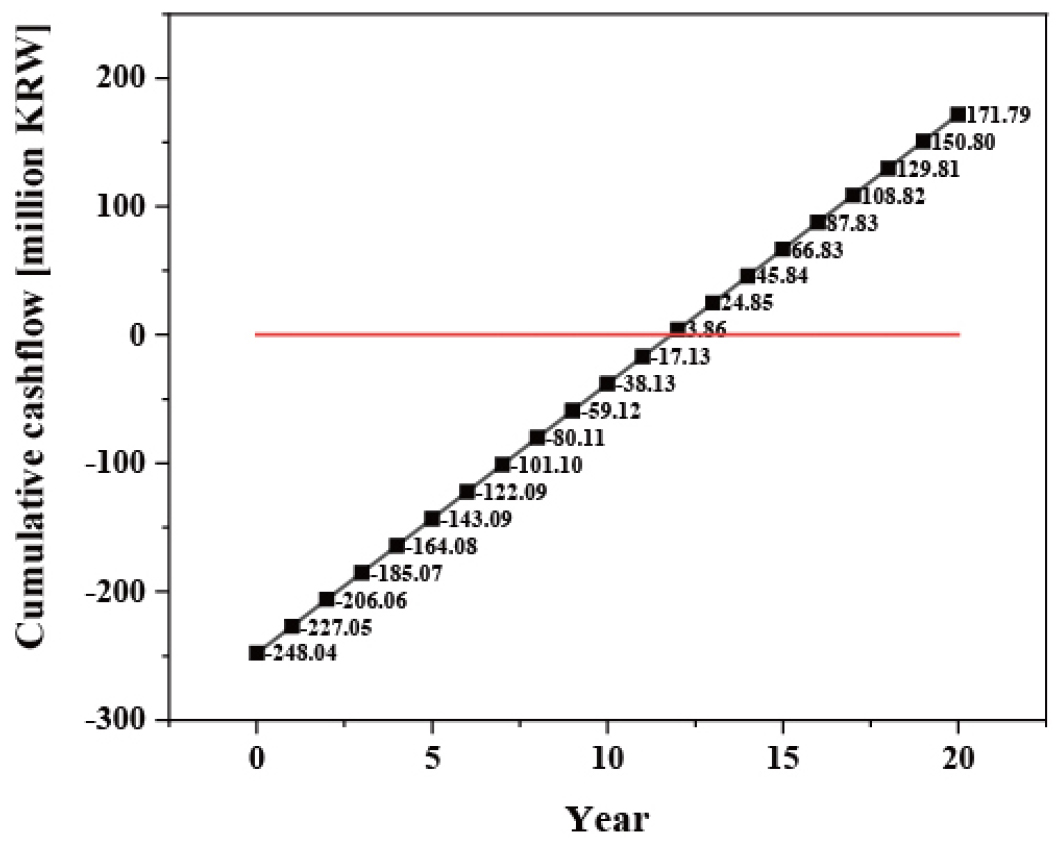
The IRR exceeds the 5% discount rate applied in the model, suggesting that the system yields a return higher than the minimum required rate of return. However, the margin between IRR and the discount rate is not excessively large, implying moderate investment resilience rather than strong financial robustness. In practical terms, the project remains profitable under base-case assumptions, but its performance is sensitive to variations in product price, biochar yield, or operating costs. The ROI reflects the cumulative return relative to the initial capital investment over the 20-year period. While the ROI appears favourable, this outcome is primarily a function of sustained operation over a long project horizon. The shape of the cumulative cash flow curve further supports this interpretation: the steady slope demonstrates consistent annual returns, but the absence of a steep early-stage rise indicates limited short-term surplus generation.
Collectively, the financial metrics indicate that the decentralised biochar facility can be regarded as a moderately viable investment under base-case assumptions. The project neither reflects a high-risk, high-yield profile nor delivers exceptionally strong profitability. Rather, it aligns more closely with an infrastructure-oriented investment model, where financial performance relies on sustained operation and relatively stable market conditions. The gradual incline of the cumulative cash flow trajectory further suggests limited economic headroom. Because capital recovery occurs steadily rather than rapidly, the system operates within relatively narrow margins. Under such conditions, external support instruments—including policy incentives, carbon credit mechanisms, transport cost subsidies, or access to higher-value biochar markets—could materially enhance financial resilience by accelerating value accumulation after payback. Conversely, unfavourable variations in product pricing or labour expenditure could substantially weaken performance, delaying capital recovery and compressing profitability. This degree of sensitivity highlights the necessity of careful market positioning and policy integration to secure the long-term economic sustainability of decentralised biochar systems.
Quantitative Scenario-Based Financial assessment
A scenario-based discounted cash flow analysis was conducted to evaluate the financial sensitivity of the decentralised biochar production system. The cumulative cash flow trajectories are presented in Fig. 4, and the corresponding financial indicators are summarised in Table 7.
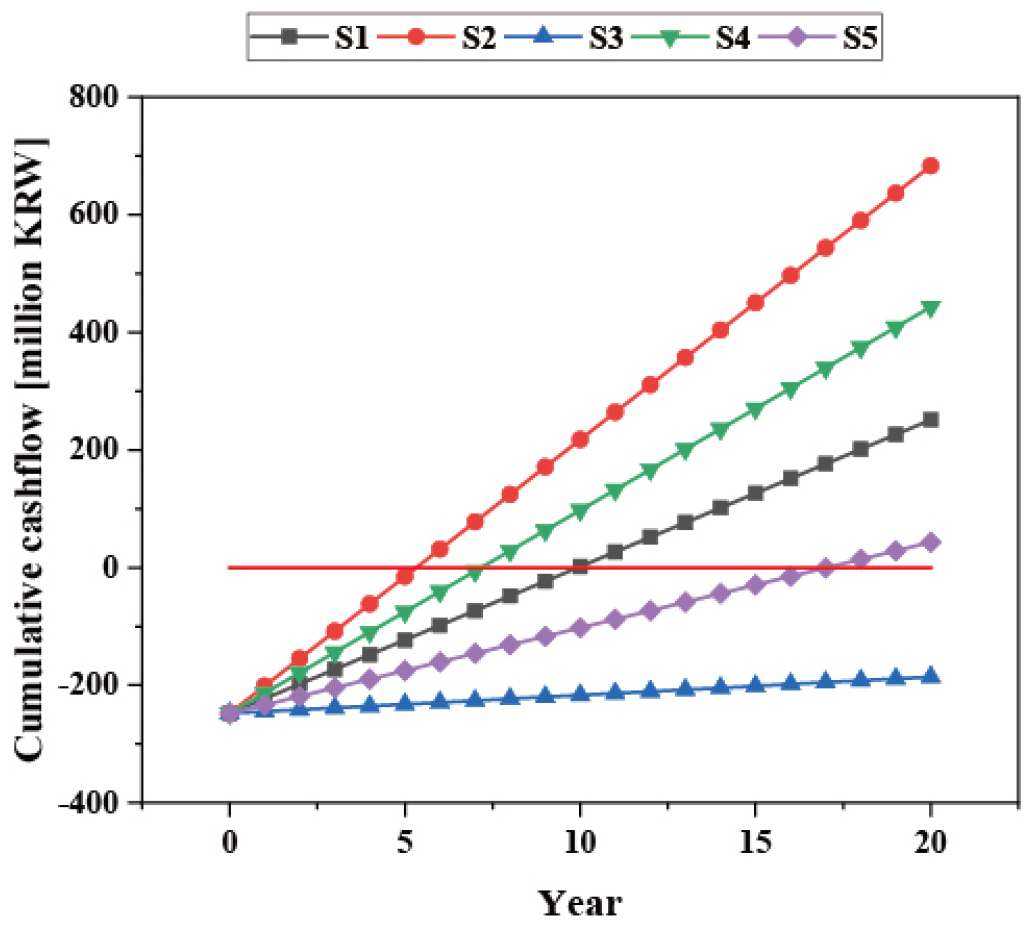
Table 7.
Financial performance indicators under five scenario assumptions
Under S1, the project generated an NPV of 63,019,493 KRW and an IRR of 7.84%, exceeding the 5% discount rate. The cumulative cash flow crosses the zero line at approximately Year 10, indicating a moderate payback period. Although financially feasible, the relatively gradual slope suggests limited economic buffer. Under S2, economic performance improved substantially. The cumulative cash flow curve becomes markedly steeper, reaching payback around Year 6. NPV increased to 332,203,237 KRW and IRR rose to 18.10%. This confirms that labour cost reduction exerts the strongest positive influence on profitability.
In contrast, S3 exhibits persistent negative cumulative cash flow throughout the 20-year horizon. NPV declined to -209,409,513 KRW and IRR to -10.66%, indicating clear economic infeasibility. The inability to recover capital investment under S3 highlights the severe impact of logistics costs. Under S4, the cumulative cash flow slope increases relative to S1, and payback occurs at approximately Year 8. NPV reached 182,656,712 KRW and IRR increased to 12.65%, demonstrating that revenue-side optimisation significantly enhances financial performance.
However, under S5, although cumulative cash flow eventually becomes positive near Year 18, the slope remains shallow. NPV declined to -66,587,494 KRW and IRR dropped to 1.58%, falling below the discount rate. This indicates that a moderate price increase is insufficient to fully compensate for additional transport costs.
Overall, IRR values ranged from -10.66% to 18.10%, and the NPV spread exceeded 540 million KRW. Among the tested parameters, labour reduction provided the greatest improvement, while transport cost introduction produced the most severe deterioration. Price optimisation offered partial mitigation but could not fully neutralise logistics-related financial pressure.
Monte Carlo-Based Probabilistic Risk Assessment
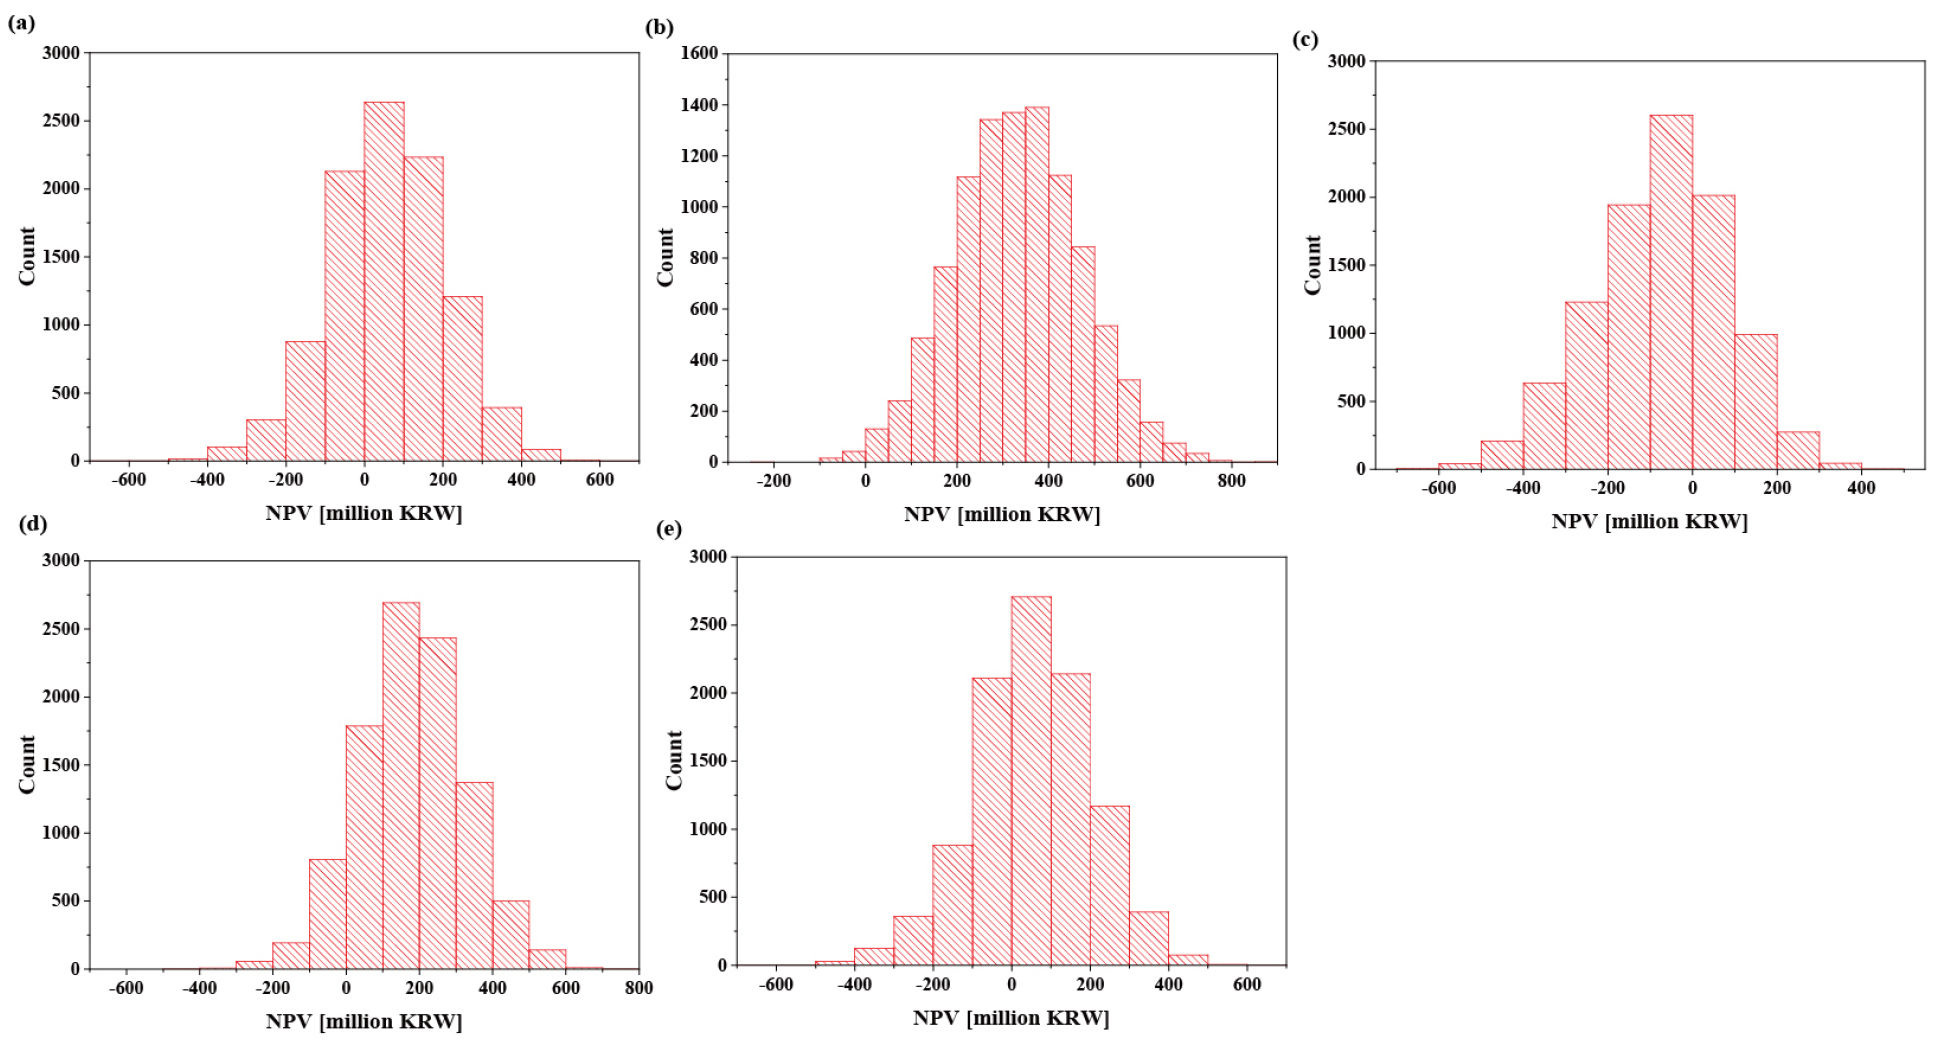
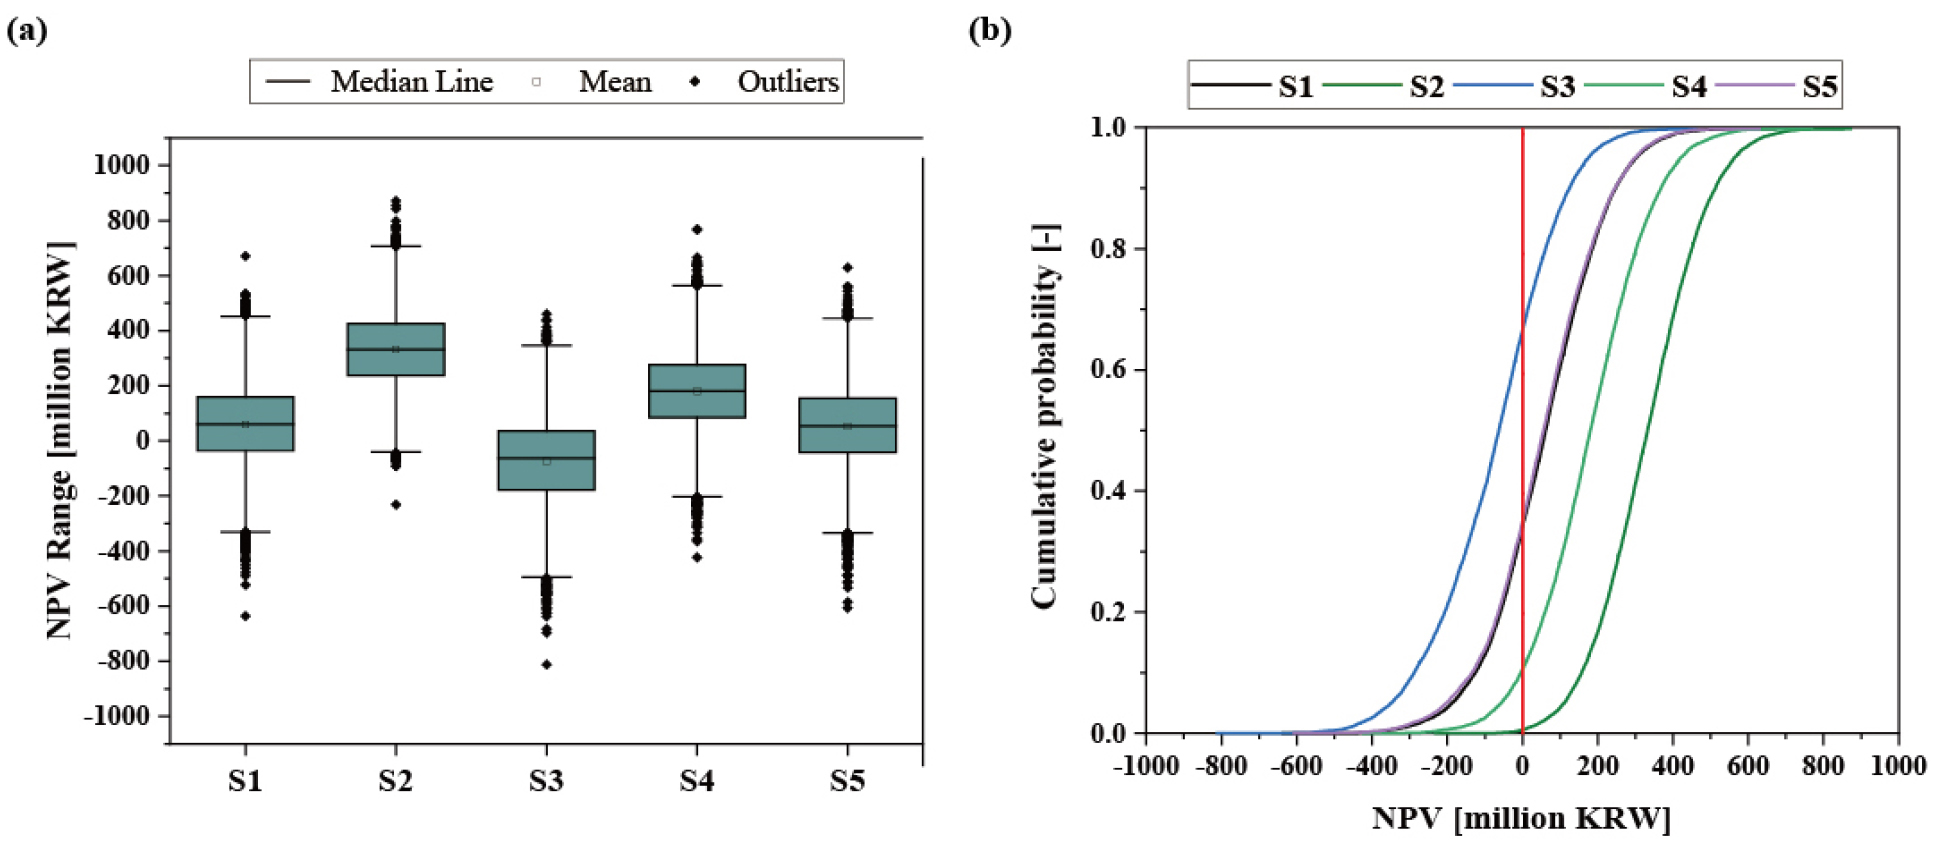
To evaluate the robustness of the decentralised biochar production system under market and operational uncertainties, a Monte Carlo simulation comprising 10,000 iterations was conducted. Biochar price variability was modelled using a normal distribution (σ = 50,000 KRW), process yield was represented by a triangular distribution ranging from 0.75 to 0.85, labour cost was allowed to fluctuate within ±10% of the baseline value, and annual transport frequency was randomly sampled between 40 and 60 trips. All structural financial parameters—including capital investment, depreciation, discount rate (5%), tax rate, and project lifetime (20 years)—were held constant to isolate operational uncertainty effects. The probabilistic outcomes are summarised in Fig. 5 through boxplots, cumulative distribution functions (CDFs), and scenario-specific histograms.
Under the baseline scenario (S1), the mean NPV was 59.5 million KRW, with a 5th percentile of -188.5 million KRW and a 95th percentile of 297.9 million KRW. The probability of financial loss (NPV < 0) reached 34.3%, while the median IRR was 7.94%, only marginally exceeding the 5% discount rate. Although deterministic evaluation suggested feasibility, the probabilistic distribution reveals substantial downside exposure, as illustrated by the left-tail extension in both the boxplot and histogram (Fig. 5 and Fig. 6(a)). The reduced labour scenario (S2) demonstrated the strongest financial resilience. The mean NPV increased to 332.5 million KRW, and notably, the 5th percentile remained positive at 110.3 million KRW. The probability of negative NPV was only 0.58%, and the median IRR reached 18.08%. The CDF curve in Fig. 6(b) shifts markedly to the right, confirming near-certain profitability under uncertainty. Both the upward shift of the median in the boxplot and the concentration of histogram outcomes in positive territory (Fig. 5(d)) indicate structural risk mitigation through labour optimisation.
In contrast, the transport-cost-added scenario (S3) exhibited pronounced financial deterioration. The mean NPV declined to -74.0 million KRW, with a 66.7% probability of financial loss. The median IRR fell to 3.23%, below the discount threshold. The CDF curve is positioned predominantly to the left of zero (Fig. 6(b)), and the histogram (Fig. 5(c)) confirms heavy negative density. This indicates that logistics cost introduces systemic vulnerability into decentralised biomass supply chains. When biochar price was increased to 800,000 KRW per ton (S4), economic stability improved. The mean NPV rose to 180.4 million KRW, the probability of loss decreased to 10.6%, and the median IRR increased to 12.55%. The rightward shift of the CDF curve and moderate compression of dispersion in the boxplot demonstrate that revenue-side optimisation partially offsets market uncertainty. However, residual downside risk remains evident in the lower percentile spread.
In the combined scenario incorporating both transport cost and price increase (S5), the mean NPV was 53.5 million KRW, with a 35.05% probability of financial loss. The median IRR was 7.74%, similar to the baseline case. The distribution appears centred near the break-even threshold, and the CDF curve intersects the NPV = 0 line at a cumulative probability comparable to S1. Although price adjustment mitigates some logistics burden, it does not fully restore financial robustness.
Across all scenarios, the spread between the 5th and 95th percentile NPVs exceeded 600 million KRW, indicating high sensitivity to operational variability. Labour structure emerged as the dominant determinant of risk-adjusted financial performance, followed by logistics cost. Revenue enhancement provides partial mitigation but cannot independently neutralise structural cost shocks.
Life Cycle Assessment
An attributional LCA was conducted in accordance with ISO 14044, with the impact category restricted to GWP. The system boundary was defined as cradle-to-gate, including raw material supply and torrefaction processing, while excluding the end-use combustion stage. Carbon sequestration credits were not considered. The FU was defined as the processing of 1-ton dry biomass. Gaseous emissions generated during torrefaction were treated conservatively due to limited compositional data and to avoid potential double counting. In the absence of detailed gas composition data, all carbon not retained in the solid product was conservatively assumed to be released entirely as CO2. This assumption likely overestimates climate impact, as torrefaction gases may contain CO, CH4, and other species. Carbon loss was determined from mass yield and carbon content differences before and after torrefaction and converted to CO2 using the stoichiometric factor (44/12).
To address the ongoing debate regarding biogenic CO2 accounting in LCA, two alternative treatments were evaluated. In Case A, biogenic CO2 released during torrefaction was fully included in the GWP inventory. This approach reflects a carbon-flow perspective in which immediate atmospheric emissions are accounted for regardless of biogenic origin. In Case B, biogenic CO2 was set to zero in accordance with the common assumption that carbon originating from biomass is climate-neutral within cradle-to-gate boundaries.
Fig. 7 presents the cradle-to-gate GWP breakdown under these two accounting approaches. Under Case A, tor-gas CO2 contributed 293.33 kg CO2eq per FU, dominating total emissions. Together with electricity (88.68 kg CO2eq per FU), heat (18.90 kg CO2eq per FU), and transport (12.00 kg CO2eq per FU), total GWP reached approximately 412 kg CO2eq per FU.
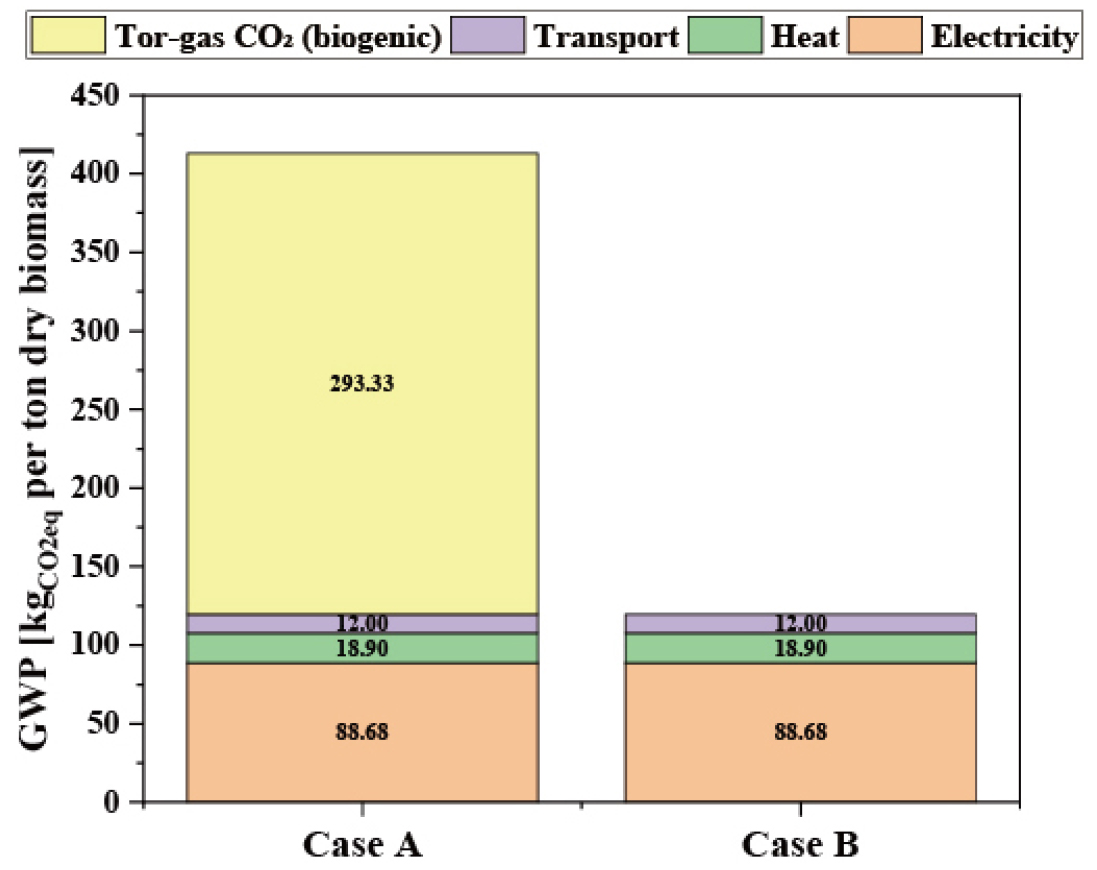
Under Case B, excluding biogenic CO2 reduced total cradle-to-gate GWP to approximately 119.6 kg CO2eq per FU. In this scenario, electricity became the primary contributor, followed by heat and transport. Although the absolute magnitude of GWP differed substantially between Case A and Case B (approximately 412 vs. 120 kg CO2eq per FU), the relative structure of emission sources remained consistent.
The contrast between the two cases highlights the methodological sensitivity inherent in biogenic CO2 accounting. Within many LCA approaches, biogenic CO2 emissions are considered climate-neutral based on the premise of rapid carbon turnover within short-term biological cycles. Nevertheless, this assumption has been challenged, as the instantaneous release of CO2 may exert temporal climate effects, particularly where biomass regrowth rates, land-use dynamics, or carbon permanence are uncertain. By reporting results under both accounting treatments, the present study avoids embedding implicit normative assumptions and clearly demonstrates the extent to which GWP outcomes depend on accounting conventions. Crucially, independent of the biogenic CO2 treatment, process energy consumption consistently emerged as the primary controllable emission hotspot. Even under Case A, fossil-derived energy inputs represented approximately 30% of total GWP. This finding indicates that improvements in energy efficiency and enhanced heat recovery would yield environmental benefits across both accounting scenarios, thereby strengthening the consistency between LCA results and TEA conclusions.
Overall, although the treatment of biogenic CO2 significantly influences the absolute magnitude of reported GWP values, it does not change the fundamental conclusion that cradle-to-gate environmental performance is primarily governed by process energy use. In the techno-economic analysis, labour cost emerged as the dominant economic driver, whereas the life cycle assessment identified utility demand—particularly electricity and process heat—as the principal environmental driver. These outcomes are not contradictory; rather, they reflect different optimisation objectives, namely financial cost control and emission reduction. Consequently, labour optimisation through automation and improvements in energy efficiency should be regarded as complementary strategies for enhancing the overall sustainability of decentralised biochar systems.
Conclusion
This study presented an integrated techno-economic and environmental assessment of a decentralised 1 ton/day biochar production system using agricultural residues. The capital cost analysis identified the torrefaction reactor as the principal investment component, while installation and contingency factors substantially increased the total installed cost. Operating expenditure was dominated by labour costs, with thermal and electricity consumption representing secondary but notable contributions, highlighting the labour-sensitive nature of small-scale decentralised systems.
Under the baseline scenario, the project achieved moderate economic feasibility, with positive NPV and an IRR exceeding the 5% discount rate. However, scenario and Monte Carlo analyses demonstrated significant sensitivity to labour intensity and transportation costs. Reducing labour requirements markedly improved financial resilience, whereas the introduction of logistics costs rapidly diminished profitability. These results indicate that decentralised biomass systems are structurally vulnerable to operating configuration and external cost fluctuations.
The cradle-to-gate GWP assessment revealed that the treatment of biogenic CO2 substantially affects the absolute magnitude of emissions but does not alter the overall emission structure. In both accounting approaches, electricity and process heat demand consistently emerged as the dominant environmental hotspots.
Taken together, the findings show that economic and environmental performance are governed by different primary drivers. While financial outcomes are largely labour-dominated, environmental impacts are mainly determined by utility demand. These distinctions reflect differing optimisation objectives—cost control versus emission reduction—rather than analytical inconsistency. Accordingly, labour optimisation through automation and improvements in energy efficiency should be regarded as complementary strategies.
Overall, the integrated TEA-LCA framework identifies labour configuration and process energy structure as the key leverage points influencing both economic viability and environmental performance. Enhancing heat recovery, operational efficiency, and logistics management will therefore be critical to strengthening the sustainability of decentralised biochar systems within carbon-neutral transition pathways.