

Introduction
Types of Bacterial and Fungal Diseases in Major Food Crops
Different Imaging Systems and Applications for Detecting Plant Diseases
Challenges and Future Scope
Conclusion
Introduction
Plants are essential for the survival of both humans and animals. They are ample sources of food, fiber, feed, energy, shelter, and medicine among other things. A majority of crop yields have been consistently increasing since the 1960s (Ritchie and Roser 2013). However, at the same time, the world population continues to increase, and the current global population of 7.6 billion is expected to increase to 9.7 billion by 2050 (Gu et al., 2021). Hence, the current crop production trend will not be sufficient to meet the growing demand driven by the population by 2050 (Ray et al., 2013). In addition, climate change is a major concern affecting the entire agricultural sector, including the agroecosystem (aquatic species, cultivated plants, livestock, forests, pests, diseases, and productive capital), which leads to agricultural production and post-harvest loss, ultimately threatening global food security and sustainability (Gitz et al., 2016).
Cereal crops, such as rice, wheat, maize, and tubers are the top-ranked energy sources for humans (Anonymous, 2021). According to recent reports, the worldwide yield of major crops has decreased by approximately 20-40% because of pests and diseases (Savary et al., 2019). Staple food crops such as rice, wheat, maize, and other tuber and legume crops have a direct impact on food security and nutrition. Plant diseases have caused significant yield loss; for example, rice blast disease annually causes 10-30% yield loss in the United States and Canada (Asibi et al., 2019; Yan and Talbot 2016). In addition, annual corn yield in Canada was significantly decreased by northern leaf blight disease from 2012 to 2015 (Mueller et al., 2016). Recently, Savary et al. (2019) estimated approximately 10.1-28.1% annual yield loss in wheat because of diseases (leaf rust, Fusarium head blight (FHB)/scab, tritici blotch, stripe rust, spot blotch, tan spot, and powdery mildew) and pests (aphids). The economic impacts and average annual yield loss because of common soybean diseases were estimated to be approximately 11% in 28 soybean-producing states in the United States over the last two decades (1996 to 2016) (Bandara et al., 2020; Hartman et al., 2015). Reducing crop loss and efficiently managing diseases and pests are crucial for food security and sustainability in the agricultural sector.
To reduce the yield loss caused by the plant diseases require more resources, constant observation or monitoring, and effort, as yield loss because of diseases may sometimes go unreported or unnoticed, misidentification or misinterpretation. Traditionally, pathologists and plant breeders have identified plant diseases by manually examining plants. However, visual diagnosis is time-consuming, less accurate, and difficult to scale. In addition, it is a challenging task for farmers, many of whom are not professionals, to recognize diseases based on their symptoms. Moreover, conventional methods include the manual processes of measurement and observation of every plant in a large area, which is time-consuming and expensive. Furthermore, visual estimation is influenced by the skill of the observer, human error, and can also be influenced by spatiotemporal variations. Various diseases can share symptoms or have similar symptoms; therefore, it is very difficult to distinguish them precisely. To overcome these limitations, researchers have developed new imaging technologies that use machine vision, deep learning, remote sensing, and robust approaches. The major bottleneck in plant disease phenotyping is at the field level; thus, researchers and engineers need to invest more effort into the development of cost-effective, user-friendly, and autonomous tools. Several researchers employ mechanized equipment to acquire images and determine whether the observed plants are diseased or are infested by pests (Minervini et al., 2015; Singh et al., 2016). Currently, the detection and assessment of plant diseases using computational and digital imaging systems have piqued the interest of the scientific world (Arnal Barbedo, 2013; Khan et al., 2019). Digital image analysis has progressed over the years. Improved image and computer technologies have been applied to create better and more accurate depictions since 1999. The analysis techniques have progressed from 2D image analysis through knowledge-based approaches using MRI and CT to the current more accurate 3D image analysis techniques. At the same time, the machine learning (ML) and deep learning (DL) approaches have also gradually evolved. Incorporating new and novel technologies is an important aspect of early detection and management of diseases in crop plants to avoid yield loss, help the sustainability of the agriculture sector, and meet the food demand.
In the present review, we focus on providing an overview of (i) major diseases in wheat, rice, maize, and soybean crops; (ii) the importance of plant disease detection in agriculture; (iii) recent image-based plant disease detection systems and their applications in early and accurate disease detection in major crops; and (vi) challenges and prospects to encourage farming and the research community to employ imaging systems for plant disease detection, increase precision agriculture, and improve plant phenotyping.
Types of Bacterial and Fungal Diseases in Major Food Crops
Here, we classified and organized the data available regarding the identification of plant diseases caused by various bacteria and fungi.
Several plant diseases are commonly caused by bacterial or fungal infections, such as bacterial blight, bacterial wilt, bacterial brown spots, rice spots, bacterial soft rot, downy and powdery mildew, citrus canker, leaf curl, anthracnose, angular scab, brown spot/narrow brown spot, blast, stem rot, bird’s eye spot, stripe rust, and wheat leaf rust (Dean et al., 2012; Derbyshire et al., 2022; Potnis et al., 2015; Sundin et al., 2016). Savary et al. (2019) identified 120 pathogens and pests (P&P) in wheat (31), rice (26), maize (38) and soybean (25). These widely found bacterial and fungal diseases and their causal pathogens may be specific to the plant species. Major bacterial and fungal diseases that occur in wheat, rice, maize, and soybean have been listed in Table 1.
Table 1.
List of major diseases that occur in wheat, rice, maize, and soybean crops
| Crop | Disease | Causing pathogen/pests | Type | Reference |
| Wheat |
Bacterial black chaff and bacterial stripe | Xanthomonas campestris pv. translucens | Bacterial | (Duveiller, 1994) |
|
Bacterial spike blight (Yellow Ear Rot) | Corynebacterium tritici | Bacterial | (Fattah, 1988) | |
|
Basal glume rot and bacterial leaf blight | Pseudomonas syringae pv. atrofaciens Syn. Pseudomonas atrofaciens | Bacterial | (Wilkie, 1973) | |
| Leaf blight | Pseudomonas syringae pv. syringae | Bacterial | (Editors, 1992; Shane and Baumer, 1987) | |
| Leaf streak and Stripe | Xanthomonas translucens pv. undulosa | Bacterial |
(Editors, 1992; Shane and Baumer, 1987) | |
| Bacterial blight | Xanthomonas oryzae pv. oryzae | Bacterial |
(Cottyn and Mew, 2004; Yashitola et al., 1997) | |
| Leaf rust (Brown Rust) | Puccinia recondita | Fungal |
(Browder and Eversmeyer, 1980; Singh et al., 2001) | |
| Stem rust (Black Rust) | Puccinia graminis f. sp. tritici | Fungal |
(Castroagudín et al., 2016; Ceresini et al., 2018; Urashima et al., 1993) | |
| Wheat blast | Pyricularia graminis-tritici | Fungal |
(Castroagudín et al., 2016; Ceresini et al., 2018; Urashima et al., 1993) | |
| Powdery mildew | Blumeria graminis f sp. tritici | Fungal | (Cowger et al., 2012) | |
| Crown rot | Fusarium pseudograminearum | Fungal | (Xie et al., 2022) | |
| Fusarium head blight | Fusarium spp. and Microdochium spp. | Fungal | (Kazan et al., 2012; Parry et al., 1995) | |
| Rice | Bacterial blight | Xanthomonas oryzae pv. oryzae | Bacterial |
(Liu et al., 2014; Mew et al., 1993; Ou, 1985) |
| Bacterial leaf streak | Xanthomonas oryzae pv. oryzicola | Bacterial | (Liu et al., 2014) | |
| Bacterial panicle blight | Burkholderia glumae | Bacterial | (Ham et al., 2011; Liu et al., 2014) | |
| Rice blast | Magnaporthe oryzae | Bacterial | (Liu et al., 2014) | |
| Rice sheath blight | Rhizoctonia solani | Bacterial |
(Liu et al., 2014; Ou, 1985; Srinivasachary, 2011) | |
| False smut | Ustilaginoidea virens | Fungal |
(Guo et al., 2012; Liu et al., 2014; Reddy et al., 2011; Tanaka et al., 2008) | |
| Sheath rot | Sarocladium oryzae | Fungal | (Liu et al., 2014; Ou, 1985) | |
| Brown spot | Cochliobolus miyabeanus | Fungal |
(Barnwal et al., 2013; Liu et al., 2014; Ou, 1985) | |
| Bakanae | Fusarium fujikuroi | Fungal | (Liu et al., 2014; Ou, 1985) | |
| Maize | Bacterial stalk rot | Erwinia carotovora | Bacterial | (Sinha and Prasad, 1977; Subedi, 2015) |
| Bacterial leaf stripe | Xanthomonas rubrilineans | Bacterial | (Subedi, 2015) | |
| Stewart wilt | Erwinia stewartii | Bacterial | (Kang and Zuber, 1988; Subedi, 2015) | |
| Gray leaf spot | Cercospora zeae-maydis | Fungal | (Ward et al., 1999) | |
| Northern leaf blight | Helminthosporium turcicum | Fungal | (Ullstrup, 1972) | |
| Southern leaf blight | Helminthosporium maydis | Fungal | (Ullstrup, 1972) | |
|
Banded leaf and sheath blight | Rhizoctonia solani | Fungal | (Ahuja and Payak, 1982; Li et al., 2019) | |
| Common rust | Puccinia sorghi | Fungal | (Dey et al., 2012) | |
| Brown spot | Physoderma maydis | Fungal | (Osunlaja, 1983) | |
| Anthracnose leaf blight | Colletotrichum graminicola | Fungal |
(Gorman et al., 2020; Schall et al., 1980) | |
| Head smut | Sphacelotheca reiliana | Fungal | (Bernardo et al., 1992) | |
| Common smut | Ustilago maydis | Fungal | (Boland et al., 2004) | |
|
Fusarium kernel rot (Gray ear rot) | Fusarium moniliforme or Gibberella fujikuroi | Fungal | (Subedi, 2015; Ullstrup, 1953) | |
| Diplodia stalk rot | Diplodia maydis syn. Stenocarpella maydis | Fungal | (Boland et al., 2004) | |
| Diplodia ear rot | Stenocarpella macrospora | Fungal | (Bressan, 2003) | |
| Charcoal rot | Macrosporium phasiolina | Fungal | (Sankar and Sharma, 2001) | |
| Downy mildew | Peronosclerospora sorghi | Fungal |
(Kim et al., 2020; Koch and Slusarenko, 1990; Panicker and Gangadharan, 1999) | |
| Aspergillus ear rot | Aspergillus flavus | Fungal | (Smart et al., 1990) | |
| Soybean |
Soybean bacterial pustule | Xanthomonas axonopodis pv. glycines | Bacterial | (Hong et al., 2012) |
|
Soybean bacterial wildfire | Pseudomonas syringae pv. tabaci | Bacterial | (Hong et al., 2012) | |
|
Soybean bacterial blight | Pseudomonas glycinea pv. glycine | Bacterial |
(Scherff, 1973; Williams and Nyvall, 1980) | |
| Soybean rust | Phakopsora pachyrhizi | Fungal | (Godoy et al., 2016) | |
| Anthracnose | Colletotrichum truncatum | Fungal | (Boufleur et al., 2021) | |
| Charcoal rot | Macrophomina phaseolina | Fungal | (Hemmati et al., 2018; Meyer et al., 1974) | |
| Frogeye leaf spot | Cercospora sojina | Fungal | (Mian et al., 1998) | |
|
Septoria brown spot (brown spot) | Septoria glycines | Fungal | (Williams and Nyvall, 1980) | |
|
Sudden death syndrome | Fusarium solani | Fungal | (Aoki et al., 2003; Roy et al., 1997) | |
| Downy mildew | Peronospora manshurica | Fungal | (Lim, 1978; Silva et al., 2011) | |
| Soybean leaf blight | Cercospora kikuchii | Fungal | (Cai and Schneider, 2008) |
Different Imaging Systems and Applications for Detecting Plant Diseases
Plant diseases cause physiological and visual changes in plants. To prevent or control disease transmission and provide a timely solution, growers must detect the causative pathogen precisely, sensitively, and quickly so that optimal disease management measures can be chosen and implemented. Rapid and precise plant disease detection methods can aid in maintaining disease infections, reducing the spread of infection which can utilize for proper plant growth and adequate resource management. Advancements in plant stress phenotyping technologies have paved the way for P&P detection.
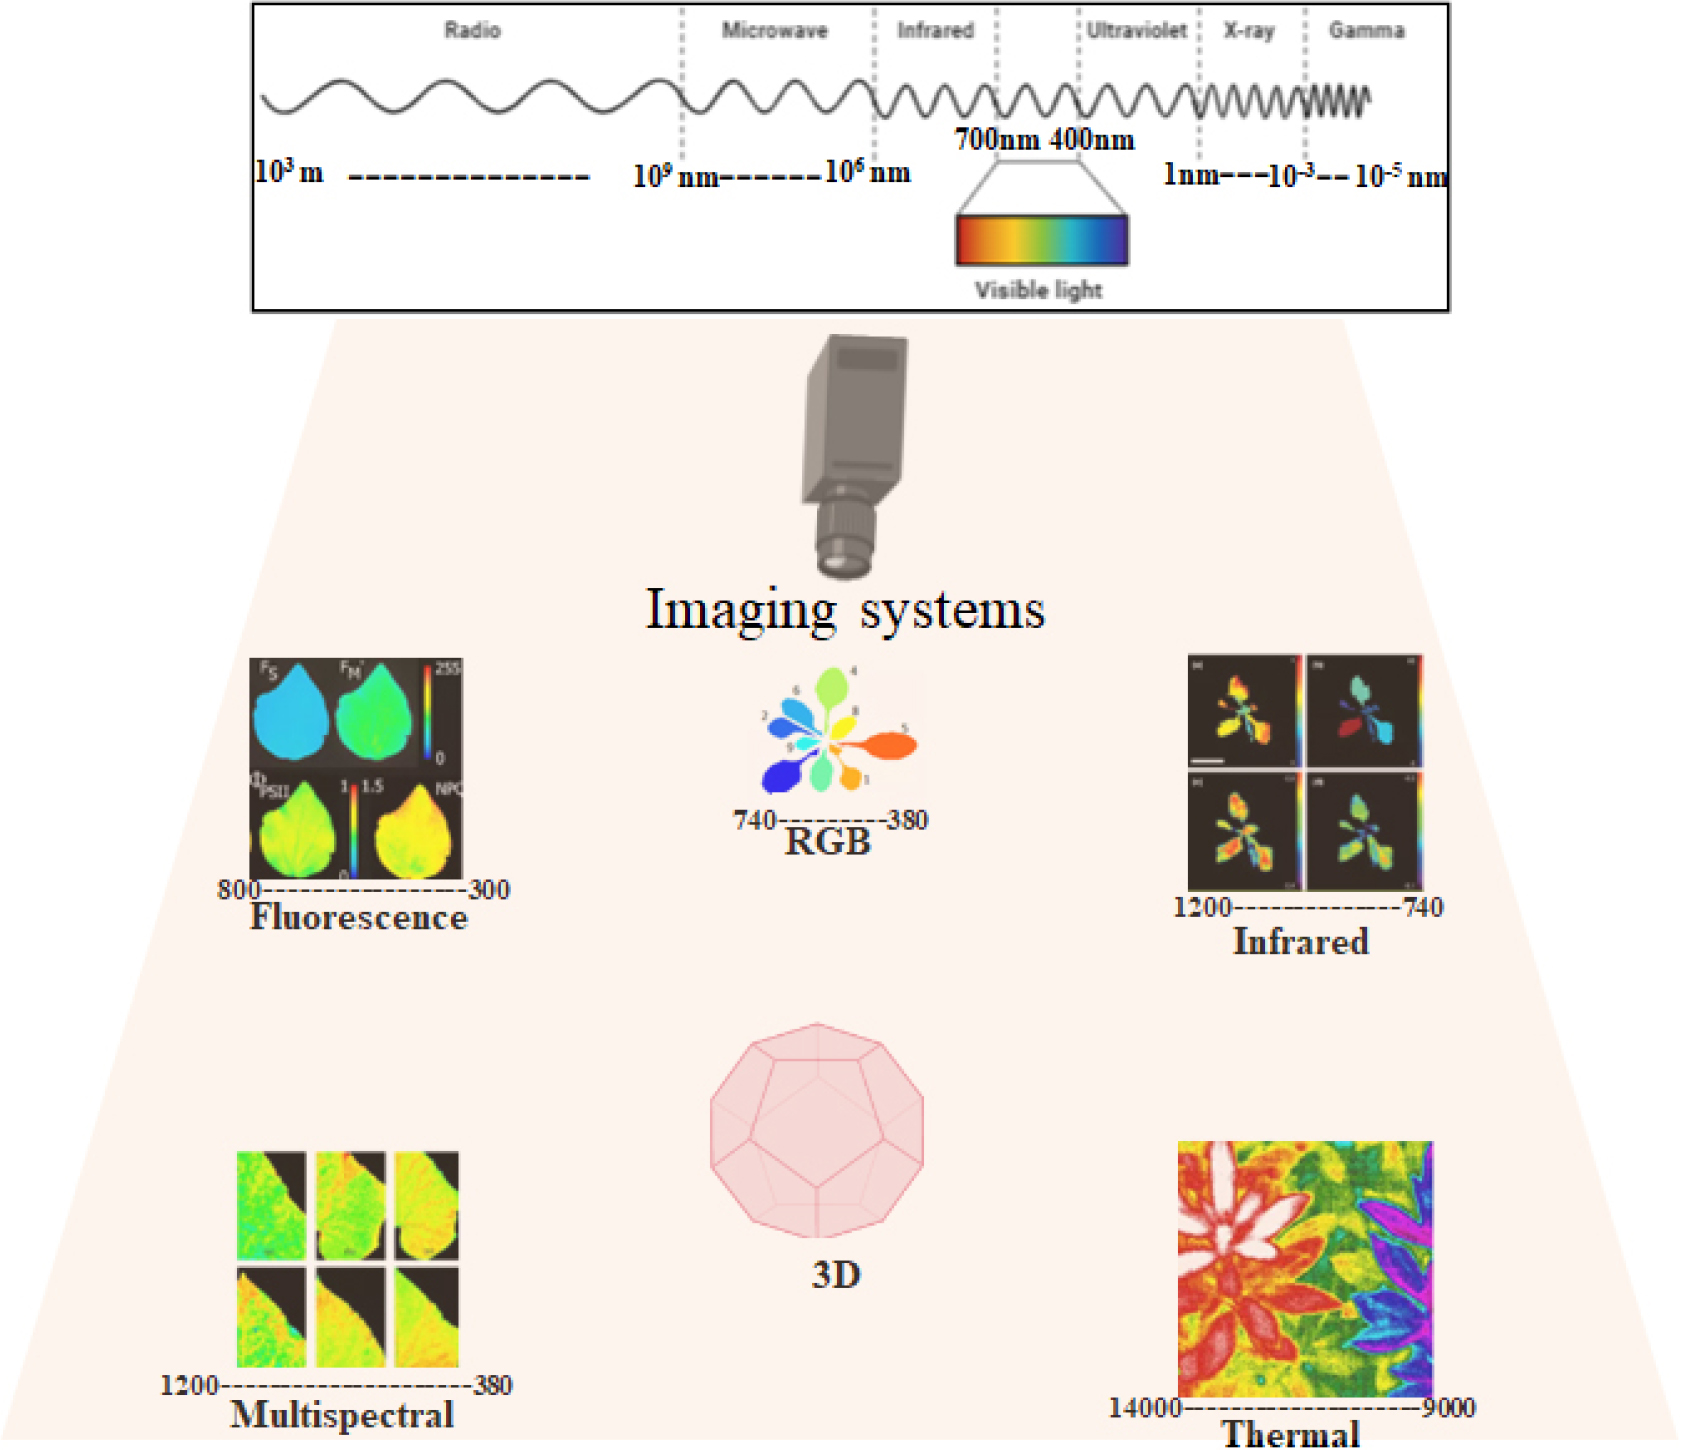
Recently, researchers have proposed several disease detection approaches using advanced techniques (Awaludin et al., 2020, Gao et al. 2020; Lin et al., 2020; Shrivastava and Pradhan 2021). For example, (i) the fluorescence method has been employed by researchers for assessing photosynthetic parameters, detecting changes in plant pigments at fluorescence level; it can be very useful for crop monitoring because it allows early detection of plant diseases, which can significantly contribute to reducing yield losses (Pérez-Bueno et al., 2016); (ii) the red-green- blue (RGB) technique, despite the lack of a precise definition, is based on color and texture, and is widely used in agricultural research with certain advantages (economical, easy to operate), and modern models can acquire images with high spatial resolutions (Chaudhary et al., 2012); (iii) the infrared process uses the visible infrared wavelengths of the electromagnetic spectrum to detect plant stress, and this method is also useful for plant disease detection (Sankaran et al., 2013); (iv) the thermal method transforms the different types of radiations detected from objects to distinct types of images for feature extraction, analysis, and classification. It was initially developed for military purposes, but its applicability in agriculture and plant disease detection has been proven by researchers (Awad et al., 2014; Sankaran et al., 2013); (v) multispectral imaging technique cover wide wavebands, including red, green, and near-infrared spectrum, to identify various parts of plants (fruits, leaves, stems), and classify plant diseases using ML algorithms that transform the data into useful information (Cui et al., 2010; Sankaran et al., 2013); (vi) hyperspectral imaging encompasses narrow wavelength bands, obtaining results in a color dataset with relevant data, as well as a large spatial resolution with numerous data bytes per leaf (Cao et al., 2015; Del Fiore et al., 2010); and (vi) 3D imaging obtains data from objects employing two methods; volumetric and surface presentation, using cameras with different sensors [Light detection and ranging (LIDAR) and Time of light (TOF)]. Digital imaging systems are considered vital for automatic plant disease identification (Vázquez-Arellano et al., 2016). All the mentioned effective imaging approaches currently used for plant disease detection and phenotyping are shown in Fig. 1, also see (Singh et al., 2020) recent review for imaging techniques for plant disease detection. These approaches involve the development and employment of various algorithms and different sensors for prediction, early detection, and accurate recognition of infected plants and distinguishing them from healthy plants. In addition, several computational techniques have been utilized for plant disease detection all over the world. Most procedures for detecting plant diseases use different wavelengths and require the following steps: image acquisition, image preprocessing, image segmentation, feature extraction, and classification (Khirade and Patil, 2015).
These imaging systems and techniques have been recognized as the most beneficial for disease detection and differentiation even at an asymptomatic stage, and hence, they could aid in competently controlling, managing, and preventing the transmission ofdiseases (Abdulridha et al., 2020). Most tools use a high-resolution camera to acquire images and save them in the form of RGB values (Velu and Abimannan, 2022). In addition, DL is a popular technique because of the accuracy of its results when testing with large amounts of data (Patil and Patil, 2021). Image processing, K-means clustering, artificial neural networks (ANN), and support vector machines (SVM) have been reviewed previously (Gupta & Bhatia, 2013). Furthermore, computer-aided diagnosis (CAD) systems have been widely used in the human health and medical sectors for disease detection, and researchers have proposed several image-based CAD systems that leverage color features to be applied in plant disease detection using RGB and L*a*b* color spaces (Ngugi and MoatazAbelwahab 2020; Shrivastava et al., 2015; Shrivastava et al., 2017; Shrivastava et al., 2021). Similarly, Verma and Dubey (2020) reported plant disease classification based on color space technology using ML.
Recently, different imaging systems/techniques have been applied for P&P or disease detection in major crops such as wheat, rice, maize, and soybean. For example, Lu et al. (2017a) proposed an in-field automatic disease detection system that could accurately identify and localize major wheat diseases with 95.12-97.95% accuracy. In addition, different DL models have been used to evaluate the severity of wheat blight leaf streak (Jahan et al., 2021). Three DL models, GoogleNet, ResNet, and VGG16, were tested and reported to have the highest test accuracies of 98%, 95%, and 84%, respectively. (Kiruthika et al., 2019) detected and classified diseases in paddy by DL technique (ANN) and recommended the use of a suitable quantity of pesticides to reduce crop loss. Similarly, Ramesh and Vydeki (2020) proposed the utilization of an optimized deep neural network with the Jaya algorithm (DNN_JOA) for the recognition and classification of paddy leaf diseases, such as blast, bacterial blight, sheath rot, and brown spot diseases. The proposed methods achieved high accuracies of 98.9%, 95.78%, 92%, and 94%, respectively. In addition, using different ML methods [SVM, K-nearest neighbor (KNN), random forest (RF), RGB, and convolutional neural network (CNN)], Sharma et al. (2022) also studied bacterial blight, rice blast, and brown spots in 3 to 4-week-old seedlings. Islam et al. (2018) used image-processing techniques to detect and classify rice diseases in Bangladesh. The experimental results showed that the classifications ranged from >89% to 90% in accuracy. Recently, using DL-based ensemble model and smartphone tools, Upadhyay and Kumar (2022) proposed a novel approach to effectively use Otsu’s thresholding-based preprocessing, together with four hidden layers of CNN, to detect and classify diseases in rice. This approach uses plant leaf images to characterize the features based on the size, shape, and color of the lesions in the leaves. Several other studies have been conducted using different methods for the detection of wheat and rice diseases caused by bacterial and fungal infections, as listed in Table 2.
Table 2.
Examples of different imaging approaches used in wheat, rice, maize, and soybean crop disease detection
| Crop | Type of diseases detected | Method/Algorithm | Accuracy | References |
| Wheat | Septoria and yellow rust | SVM |
70.00% & 95.00% | (Han et al., 2015) |
| Powdery mildew, leaf rust, and strip rust | K-mean clustering | - | (Niu et al., 2014) | |
| Wheat leaf rust | RGB | 92.30% | (Xu et al., 2017) | |
| Fusarium head blight |
CARS-SVM and CARS-SR-SVM |
85.40% & 92.70% | (Zhang et al., 2019) | |
| Crown rot | SVM | - | (Xie et al., 2022) | |
| Yellow rust |
Fluorescence induction and spectral reflection method | - | (Bravo et al., 2003) | |
| Fusarium head blight | SVM | - | (Alisaac et al., 2018) | |
| Fusarium head blight |
mask region convolutional neural network (Mask-RCNN) | 77.19% | (Su et al., 2020) | |
|
Powdery mildew, rust, leaf blight, and stripe rust | SVM | - | (Tian et al., 2011) | |
| Wheat spike diseases | CNN | - | (Ennadifi et al., 2020) | |
| Powdery mildew | N-CNN | 98.90% | (Kumar and Kukreja, 2021) | |
|
Wheat yellow rust, stem rust, and powdery mildew | CNN | 95.4 ± 0.4% | (Kendler et al., 2022) | |
| Head blight disease | SAM | - | (Bauriegel et al., 2011) | |
|
Brown rust, yellow rust, powdery mildew, and blotch | WHEATPEST | - | (Bregaglio et al., 2021) | |
| Yellow rust | Normalization | - | (Bravo et al., 2003) | |
| Septoria blotch, tan spot, and Rust | CNNs | (Picon et al., 2019) | ||
| Rust, septoria blotch, and tan spot | AuCs (smartphone application) | - | (Johannes et al., 2017) | |
| Rice | Bakanae disease | SVM | 87.90% | (Chung et al., 2016) |
| Rice blast, false smut, and brown spot | CNN | 95.48% | (Lu et al., 2017b) | |
| Rice blast | CNN, SVM, LBPH | 95.83% | (Liang et al., 2019) | |
|
Rice blast, bacterial blight, sheath rot, and brown spot | DNN_JOA, ANN, DAE | 97.00% | (Ramesh and Vydeki, 2020) | |
| Rice blast | RiceTalk | 89.40% | (Chen et al., 2019) | |
|
Leaf blast, false smut, neck blast, sheath blight, bacterial stripe disease, and brown spot | Ensemble Model | 91% | (Deng et al., 2021) | |
|
Brown spot, leaf blight, sheath blight, sheath rot, bacterial blight, and leaf smut | CNN and SVM | - | (Vasantha et al., 2021) | |
|
Rice blast, bacterial leaf blight, and sheath blight | AlexNet, CNN, SVM | 91.37% | (Shrivastava et al., 2019) | |
|
Rice blast, bacterial leaf blight, brown spot, sheath blight, sheath rot, and false smut | CNN | - | (Shrivastava and Pradhan, 2021) | |
| Rice blast, brown spot, and bacterial blight | k-mean clustering | - | (Nidhis et al., 2019) | |
|
Rice blast, red blight, stripe blight, and sheath blight | CNN + SVM, AlexNet, VGG |
96.80%, 93.79% and 91.65% | (Jiang et al., 2020) | |
| Rice sheath blight | iTOP 4412 | 83.50% | (Yao et al., 2017) | |
|
Bacterial leaf blight, brown spot, and leaf smut | SVM | 73.33% | (Prajapati et al., 2017) | |
| Rice leaf blast and brown spot | SOM neural network | - | (Phadikar and Sil, 2008) | |
| Rice leaf blast and brown spot | ANN and SVM |
87.50% & 92.50% | (Ghyar and Birajdar, 2017) | |
| Rice pests and diseases | CNN | - | (Mique Jr and Palaoag, 2018) | |
|
Brown spot, false smut, bacterial leaf blight, leaf scald, leaf smut, red stripe, sheath blight, tungro virus, and blast | SVM and DCNN | 97.50% | (Hasan et al., 2019) | |
|
Bacterial blight, blast, brown spot, and tungro | CNN and SVM | - | (Sethy et al., 2020) | |
| Rice fungal diseases | CNN (GoogleNet, ResNet-18, SqueezeNet-1.0, and DenseNet-121) | 95.57% | (Arinichev et al., 2021) | |
|
Rice leaf blast, brown spot, and Hispa insect | CNN (VGG16 and GoogLeNet) | - | (Muruganandam et al., 2022) | |
|
Bacterial blight, rice blast, and sheath blight | SVM | 94.68% | (Shrivastava et al., 2017) | |
|
Leaf blast, brown spot, panicle blast, sheath blight, and stem borer disease |
Color space (RGB, HSV, YCbCr, LAB and XYZ) | - | (Verma and Dubey, 2020) | |
| Common rice diseases and disorder | e-Rice (Mobile Application) | - | (Morco et al., 2017) | |
| Rice false smut | WNN and QSVM | 95.00% | (Chen et al., 2022) | |
|
Bacterial leaf blight, brown spot, and leaf smut | CNN | (Sharma et al., 2020) | ||
|
Bacterial blight, blast, brown spot, and sheath blight | CNN | - | (Hossain et al., 2020) | |
|
Bacterial leaf blight, brown spot, and leaf smut | RNN | 95.83% | (Patidar et al., 2020) | |
|
Bacterial leaf blight, brown spot, and leaf smut | CNN | 99.70% | (Upadhyay and Kumar, 2022) | |
| Maize | Leaf spot, common rust leaf blight, | CNN | (Xiong et al., 2020) | |
| common rust, and northern leaf | k-NN and SVM |
85.00% & 88.00% | (Deshapande et al., 2019) | |
| Northern leaf blight | OPNN | - | (Akanksha et al., 2021) | |
|
Gray leaf spot, leaf rust, and northern leaf blight | CNN | 92.50% | (Bonifacio et al., 2020) | |
|
Cercospora leaf spot, common rust, and northern leaf blight | SVM, NB, KNN, DT and RF |
Highest: 80.68% (RF) | (Chauhan, 2021) | |
| Fungal diseases |
Hyperspectral imaging-based | - | (Del Fiore et al., 2010) | |
| Common rust and northern leaf | CNN | 88.46% | (Mishra et al., 2020) | |
| Corn leaf rust and leaf blight | DNN | - | (Ashwini and Sellam, 2022) | |
|
Common rust, gray leaf spot, and northern blight | CNN | 97.89% | (Ahila Priyadharshini et al., 2019) | |
|
Cercospora leaf spot, common rust, and Northern blight | CNN | 98.78% | (Panigrahi et al., 2020) | |
|
Northern leaf blight, cercospora leaf spot gray leaf spot, and common rust | CNN | 98.06% | (Waheed et al., 2020) | |
|
Curvularia leaf spot, dwarf mosaic, gray leaf spot, Northern leaf blight, brown spot, round spot, rust, and Southern blight | CNN | - | (Zhang et al., 2018) | |
| Fusarium verticillioides contamination | NIR hyperspectral imaging | - | (Williams et al., 2012) | |
|
Northern corn leaf blight, common rust, and gray leaf spot | CNN | - | (Sibiya and Sumbwanyambe, 2019) | |
| Soybean |
Bacterial blight, brown spot, frog eye, rust, and sudden death syndrome | SVM, CNN, PNN | - | (Shrivastava et al., 2017) |
| Mildew and soybean rust | SVM | 98% | (Pires et al., 2016) | |
|
Septorial leaf blight spot, Frogeye leaf spot, and Downy mildew | CNN | 99% | (Wallelign et al., 2018) | |
| Charcoal rot |
LR-L1, LR-L2, MLP, RF, GBT, and SVM | - | (Khalili et al., 2020) | |
|
Anthracnose, bacterial blight, Carijo leaf, Charcoal rot leaf cercospora, mela, mildew, murcha sclerocio, oidio, phytopthora rot, rust, septoria, and Southern blight | CNN (VGG19, GoogleLeNet, Dense121, XceptionNet, LeNet, and ResNet50) | 98.14% | (Karlekar and Seal, 2020) | |
|
Frog eye leaf spot, bacterial leaf spot, viral diseases | MF R-CNN | 83.34% | (Zhang et al., 2021) | |
|
Frogeye leaf spot, downy mildew, and bacterial pustule | NN | 93.30% | (Gharge and Singh, 2016) | |
|
Bacterial blight, frogeye leaf spot, and septoria brown spot | SVM, KNN |
87.30% & 83.40% | (Jadhav et al., 2019) | |
|
Bacterial blight, rust, phytotoxicity, stem canker, corynespora leaf spot, myrothecium leaf blight, downy mildew, and septoria brown spot | Color information | - | (Barbedo and Godoy, 2015) | |
|
Bacterial blight, brown spot, and frogeye leaf spot | CNNs | - | (Jadhav et al., 2021) |
Note: SVM, support vector machines; RGB, red-blue-green; CARS, competitive adaptive re-weighted sampling; RCNN, region convolutional neural network; CNN, convolutional neural network; SAM, spectral angle mapper; AuC, area under the receiver operating characteristic (ROC) curve; LBPH, local binary pattern histograms; DNN_JOA, deep neural network with Jaya optimization algorithm; ANN, artificial neural network; DAE, deep autoencoder; VGG, visual geometry group; SOM, self-organizing map; DCNN, deep convolutional neural networks; WNN, wide natural network; QSVM, quadratic support vector machines; k-NN, k-nearest neighbors; OPNN, optimized probabilistic neural network; NB, naive Bayes; DT, decision tree; RF, random forest; DNN, deep neural network; NIR, near-infrared; GBT, gradient tree boosting; MLP, multilayer perceptron; LR, linear regression; MF R-CNN, multi-feature fusion faster region convolutional neural network.
Similarly, researchers have also reported different disease detection methods for maize crop. For example, Kai et al. (2011) studied image-based disease classification using the JPEG-applied YCbCr color space for detecting leaf blight, sheath blight, and southern leaf blight of maize via image processing and analysis, and the results were observed to have >98% accuracy. Panigrahi et al. (2020) detected plant diseases in maize using ML techniques such as naive Bayes, decision tree, KNN, and SVM. The results illustrate that the RF algorithm has the highest accuracy of 79.23% compared to the rest of the classification techniques. Similarly, Micheni et al. (2021) developed a classification model for maize leaf diseases using DNN (AlexNet and ResNet50) and CNN methods. They observed a detection accuracy of >98% when both models were used, and the ResNet-50 model performed better than AlexNet. Various other studies showing the different methods used for the detection of maize diseases caused by bacterial and fungal infections are listed in Table 2.
Over the last few decades, researchers have identified, quantified, and predicted various crop plant diseases using techniques such as the automatic foliar disease detection and quantification (for rusts, bacterial blight, sudden death syndrome, brown spot, downy mildew, and frog eye), where they used three indices, namely, the disease severity index, infection per region, and disease level parameter to forecast infection levels (Shrivastava et al., 2015). Similarly, salient region-based and color transformation-based approaches have also been reported for soybean disease detection using low-level luminance or color features with multi-scale analysis to identify diseased regions (Barbedo and Godoy, 2015; Gui et al., 2015). In addition, the LeNet model has also been used to detect and classify diseases in soybean (Wallelign et al., 2018). Similarly, eight stress factors for soybean crop, including biotic (fungal and bacterial) stresses, have been identified, classified, and quantified using a deep CNN model (Ghosal et al., 2018). Recently, Karlekar and Seal (2020) proposed SoyNet, which was applied to soybean leaf images for disease diagnosis, and the results showed >98% precision. The different methods used for the detection of soybean diseases caused by various pathogenic infections are listed in Table 2.
Challenges and Future Scope
Although the early detection of plant diseases using imaging systems is crucial for crop management, decreasing crop yield loss, and increasing food security and sustainability, it has not been promoted to its full potential over the years. Progress made in the last few decades has appeared to be modest. Moreover, several challenges remain to be addressed by the research community, requiring significant progress to adopt modern imaging systems for plant disease detection. The major challenges for the early detection of plant diseases using imaging systems are: (i) Most P&P and disease detection/classification methods are based on training and testing stages, and need proper validation to be widely used for a particular crop. (ii) Sufficient examples of agricultural crop diseases and pests have not been published; moreover, small samples may lead to false-positive results. (iii) When the disease pressure is minimal, imaging equipment can only collect a limited amount of training data, leading to a cost disadvantage. (iv) Most methods are crop-, stage-, and algorithm-specific; hence, they cannot be extrapolated to the other stages or crops, and this limits their application. (v) Some of the operating methods are excessively stringent and require a certain distance, angle, and light to acquire the plant images. It is highly impossible to meet all parameters in real field conditions and difficult to obtain reproducible results. (vi) Some imaging systems are not cost-effective because of high-resolution cameras, robotics, and nondestructive methods, based on advanced settings, which may lead to inadequate technical knowledge of the advanced technical tools. (vii) With a larger sample size, tremendous amounts of imaging data are obtained, making it challenging to store, manage, and process these big data and draw conclusions. (viii) The different imaging systems and algorithm techniques provide different levels of accuracy and are influenced by the background noise/conditions; thus, it is challenging to obtain precise results. However, with technological evolution, researchers should focus on developing digital imaging systems with high-throughput, cost-effective, robust, efficient, and user-friendly tools/models/systems. For example, smartphone-based digital technology can be utilized for making a more feasible plant disease diagnosis (Buja et al., 2021; Mendes et al., 2020). As smartphone technology is ever-evolving day by day with advanced cameras, features that can efficiently reduce processing and help end-user to monitor plant diseases. Furthermore, to get real-time monitoring and analysis an intriguing viewpoint is the combination of tissue flexible sensors and a wireless networking system tool will be desirable. In addition, efforts should be invested in creating disease-specific image datasets (curated and labeled) based on field sample images acquired for diverse plant species using smart mobile devices/phones, robots, drones, or unmanned aerial systems. This data set can facilitate the template for research resources in the precise identification of plant diseases. Generated disease image datasets should be shared and made available to researchers and farmers for better utilization and efficient monitoring of plant health and resources to reduce crop yield loss and increase sustainability. The use of artificial intelligence with DL and ML approaches in conjunction with an advanced image system could be explored for more accurate disease detection at an earlier stage. Overall, a holistic approach needs to be considered which can integrate multifaced technology and enable several disease detection in plants. This technological advancement will encourage farmers and scientists to use imaging technologies for detecting diverse plant diseases, improving precision agriculture, and scaling up plant phenotyping.
Conclusion
Prediction, early identification, and management of plant diseases are critical for food security. Digital imaging systems or tools have great potential for early disease detection and improved accuracy, consistency, scalability, and flexibility. In this review, we present an overview of the key plant diseases that affect essential food crops as well as the need for the early identification of diseases. A summary of various imaging technologies for the early identification of plant diseases is also presented. We summarized existing imaging systems used for major food crops as well as pros and cons of the imaging techniques currently being used and prospects for improving imaging approaches to detect plant diseases in the future.
