

Introduction
Literature review
Method
Data
Result
Beer consumptions
Beer Prices
Robustness check
Conclusion
Introduction
The beer industry in South Korea is experiencing fierce competition between domestic and foreign brands (KAFFTC, 2021). Due to the manufacturing, sales, and distribution of beer, it requires a large amount of labor and raw material supplies from related industries. The growth of domestic beer can provide opportunities to generate domestic jobs and various economic benefits (Jeong et al., 2015). Therefore, expanding the competitiveness of domestic beer against foreign brands would contribute greatly to the domestic economy.
Boycotts can reduce the sales and profits of products from specific brands or a particular country (Fershtman and Gandal, 1998; Kim et al., 2022). For example, the Arab economic boycott on the Israeli automobile market in 1995 clearly was effective in that the major Japanese and all of the Korean firms stayed out of the market (Fershtman and Gandal, 1998). Thus, boycotts can increase market share for competing companies and provide them with economic advantages. Furthermore, a decrease in sales of a specific brand can lead to intensified price competition and changes in market conditions.
In July 2019, when the Japanese government announced export restrictions on South Korea, a boycott of Japanese products began within the country (MEF, 2019). The boycott aimed to refrain from purchasing or consuming Japanese products or those associated with Japanese companies. It started on July 3, 2019, when a user on an internet community created a logo saying ‘NO, BOYCOTT JAPAN’ and distributed it freely for non-profit purposes (Kang, 2019).
The boycott of Japanese products has resulted in a decline in the consumption of Japanese beer, causing changes in the condition of the South Korean beer market. However, there is limited empirical evidence in the literature on this topic, with a few notable exceptions (Kim and Lee 2022; Kim and Kim 2022). Kim and Lee (2022) analyzed the impact of import beer demand on anti-Japanese sentiment using Seemingly Unrelated Regression. Their findings indicated that when anti-Japanese sentiment formed, the consumption of Chinese or Dutch beer increased greatly compared to Japanese beer. They suggested that there was a competitive or substitution relationship between imported Japanese beer and Chinese or other imported beers. However, they acknowledged that they did not analyze the impact of the boycott on domestic beer demand due to data limitations.
Kim and Kim (2022) conducted a study to assess the impact of the boycott on Japanese products in the Korean beer market. They employed a Difference-in-Difference (DID) approach to analyze the data. The study revealed that Japanese beer sales decreased by more than 70 percent during the 14-month boycott period in the data, and the decrease in Japanese beer sales was mainly offset by an increase in domestic beer sales. Due to the potential impacts of the boycott on both Japanese and non-Japanese beer sales, they used a comparison group instead of a control group in their DID empirical analysis. This limited their investigation to examining the relative effects of the boycott on sales of Japanese and non-Japanese beers. However, it is important to note that relative effects may have different absolute impacts depending on the baseline. And taking absolute treatment effects into account is generally considered more appropriate (Sormani and Bruzzi, 2017). Therefore, the impact of the boycott on Japanese products in the Korean beer market is still less clear.
This study aims to estimate the impact of the boycott on Japanese products in the Korean beer market using Regression Discontinuity (RD) designs. Employing RD, which can assess absolute treatment effects and are regarded as more reliable than DID strategies (Lee and Lemieux, 2010), would be a good way to infer causality in this case study. The finding shows that the boycott decreased Japanese beer consumption but increased the consumption of American beer and Belgian beer. It also increased the unit prices of Japanese beer, Korean beer, and Dutch beer while it decreased the unit price of American beer and Belgian beer.
The contribution of this study is to provide valuable implications to beer industry by quantitatively analyzing the impact of the boycott of Japanese products using RD designs, addressing the limitations of previous studies. This study underlines the importance of pricing strategies in influencing consumption when a market structure changes due to foreign product boycotts. It demonstrates how the boycott had distinct effects on the consumption and unit prices of different beer products. Appropriate pricing strategies in the face of market changes, such as boycotts, can lead to the growth of the domestic beer industry, creating domestic jobs and providing various economic benefits.
This study also sheds light on the consequences of international product boycotts on the domestic beer market. Understanding the effects of foreign product boycotts and the resulting changes in the domestic market provides valuable insights for domestic beer companies and policymakers. International political and economic factors can have a direct impact on the domestic beer industry. We suggest that policymakers should carefully consider global issues and international relations, developing strategies to respond to these changes effectively.
The paper proceeds as follows. Section 2 provides literature review. Section 3 introduces the empirical strategy. Section 4 describes the data. Section 5 shows the results and Section 6 concludes.
Literature review
Based on the animosity model of consumer purchase behavior (Antonetti et al., 2019; Cheah et al., 2016; Ettenson and Klein, 2005; Klein et al., 1998), consumer animosity is understood as anger and antipathy directed at a particular country due to political, economic, diplomatic, or military events. This model explains consumers’ evaluative and decision-making processes on their consumption of products or brands during and after boycotts. Previous studies on the animosity model show that animosity has a direct negative influence on people’s willingness to buy (Lee and Lee, 2013; Mrad et al., 2014). Therefore, this study proposes the following hypothesis:
H1. The boycott on Japanese products has a negative impact on consumption of Japanese beer.
Boycotts can lead to shifts in consumer behavior. Consumers boycotting products from a particular country are likely to consider alternative options. By studying these substitution relationships, we can gain insights into which products consumers are turning to and how this affects their preferences and buying habits. Previous studies found that there is a substitution relationship between Japanese beer and other beers in Korea. For example, Kim and Lee (2022) reported that the imports of Chinese or Dutch beer increased greatly while the imports of Japanese beer decreased. Therefore, we propose the following hypothesis:
H2. The boycott on Japanese products has a substitution effect between Japanese beer and other beers.
Boycotts can have varying effects on prices, depending on the specific circumstances and market conditions. In some cases, a successful boycott can lead to a decrease in prices. Hendel et al. (2017) studied a consumer boycott on cottage cheese, organized in Israel on Facebook in the summer of 2011 and found that the boycott led to an immediate decline in prices. On the other hand, the impact of a boycott on prices may be limited. If the market is highly competitive and there are readily available substitutes, companies may have less room to increase prices even in the face of a boycott. Fershtman and Gandal (1998) show that prices would not have increased if the Arab economic boycott had persisted in 1995. This is attributed to the relative competitiveness of the Israeli market and the availability of close substitutes for nearly all products in the market. Following these studies, we formulate the following hypothesis:
H3. The boycott on Japanese products result in the price changes of Japanese beer and other beers.
Method
This study adopts the empirical approach of Davis (2008) which measures the effect of the driving restrictions on air quality using RD designs where the assignment variable (also referred to the forcing variable or the running variable) is time. RD designs are a way of estimating treatment effects in a nonexperimental setting where treatment is determined by whether an observed “assignment” variable exceeds a known cutoff point. Thistlethwaite and Campbell (1960), pioneers of RD designs, conducted an analysis on the influence of merit awards on future academic outcomes. They utilized the fact that the allocation of these awards depended on observed test scores. The fundamental concept of their research design was to compare individuals with scores just below the cutoff (who did not receive the award) with those just above the cutoff (who did receive the award). Since their work, there has been a rapidly growing literature employing RD designs to investigate a variety of questions.
We estimates the effects of the boycott on Japanese products by estimating the following model:
In the main specification, the log of outcome variables (beer consumptions and prices) is regressed on , an indicator variable for observations after the boycott on Japanese products, , the time variable t subtracted by the cutoff value c. is the intercept and is the error term. The coefficient of interest, 𝜏 identifies the discontinuous jump in at as the causal effect of the boycott. OLS estimation of (1) consistently estimates the effect (Black et al., 2007). The equation (1) is, a parametric functional form, the case of polynomial regressions that estimates separate regressions on the two sides (l denotes left side and r denotes right side) of the cutoff point and needs to choose the order, k, of the polynomial. It is often useful to have a formal guidance on the choice of the order of the polynomial. Following Black et al. (2007), the order of the polynomial was selected using Akaike information criterion (AIC) of model selection. The AIC is given by
Where N is the number of observations, is the mean squared error of the regression, and p is the number of parameters in the model. In practice, parametric and nonparametric approaches lead to the computation of the exact same statistic, therefore, a nonparametric estimation does not represent a solution to functional form issues raised by RD designs (Lee and Lemieux, 2010).
The Chow test was conducted to test structural changes after the boycott. It is commonly employed in the field of econometrics, specifically with time series data, to identify the presence of a structural break at a particular point in the data. The null hypothesis in the Chow test is that the estimated coefficients and in Equation (1) are equal to each other. The chow test statistic is calculated as follows
where RSSE is the sum of squared error (SSE) from the constrained model with = 0, and USSE is the SSE from the unconstrained model. J represents the number of constraints set by the null hypothesis, and k is the number of explanatory variables including the constant term. T is the total time period.
To confirm the robustness of estimation results, this study re-estimates equation (1) including the monthly dummy variables and the week-of-month dummy variables, which can capture the seasonal changes in beer consumption and price. The same orders of the polynomial are used in the robustness check as they are chosen for the optimal estimation model. The estimation was performed using Stata 17, and robust standard errors were computed to address any potential heteroscedasticity.
Data
To examine the impact of the Japanese products boycott on beer consumption and beer price, this study uses Nielsen Korea Retail Tracking Service data which covers all products in the beer category sold in the entire Korean market. The sample covers the weekly sales of 506 beer brands from January 2018 to July 2020. This study categorized each beer brand according to its country of origin. For each beer brand, the data provide weekly revenue (million KRW), sales volume (million liters). However, the data does not provide differentiation between various types of packaging (such as bottles or cans) or different sizes (like 355ml or 500ml) within a specific product. Additionally, the sample is imbalanced due to the introduction of new products and the removal of products with low sales performance from the market.
Table 1 shows the annual share of sales volume and share of revenue for the top 90% of countries in the Korean beer market in 2018. This study conducts an analysis on these main countries which accounts for almost all of the Korean beer market. The sales volume was high in the order of Korea (71.67%), Japan (8.09%), China (3.40%), the Netherlands (3.04%), the United States (2.81%), and Belgium (2.50%). The unit price, calculated by dividing the total revenue by the total sales volume, was high in the order of the Netherlands (5,553 KRW), Japan (5,477 KRW), China (5,199 KRW), the United States (5,067 KRW), Belgium (4,265 KRW), and Korea (3,779 KRW).
Table 1.
The annual share of sales volume and share of revenue in the Korean beer market in 2018
Fig. 1 shows the average weekly consumptions of the Japanese beer. The average weekly beer consumptions were constructed by averaging over all beer brands of the week by countries. The consumptions dropped sharply from the first week of July 2019, when the boycott began. The vertical line indicates the start of the boycott. This suggests that the boycott has reduced the consumptions of Japanese beer, which in turn has changed the consumptions of beer of other countries.
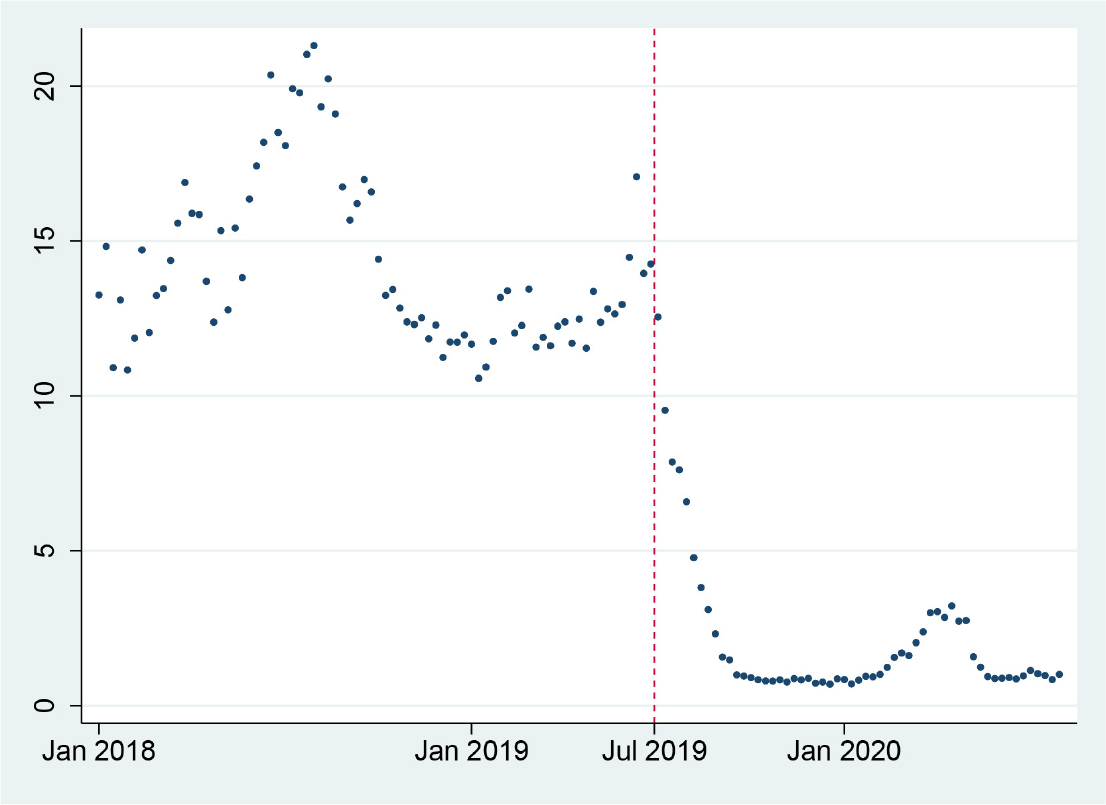
Table 2 shows the descriptive statistics of the log of average weekly beer consumptions (lnC) and the log of weekly unit prices (lnP) by countries. The average weekly unit prices were constructed by averaging over all beer brands of the week by countries.
Table 2.
Descriptive statistics
Result
Beer consumptions
Table 3 reports the selected order of the polynomials for each regression models based on AIC. We selected the regression model with the lowest AIC. The selected order is 11 for Japan, 6 for Korea, 11 for China, 8 for the Netherlands, 9 for the United States, and 11 for Belgium.
Table 3.
Order of the polynomial selection for beer consumption estimations
Table 4 represents the effects of the boycott on beer consumption models. The estimation results provide evidence of reduction in Japanese beer consumption indicating that the boycott reduced the average weekly consumption of Japanese beer by 40.1%. Therefore, we cannot reject the null hypothesis (H1): the boycott on Japanese products has a negative impact on consumption of Japanese beer. Interestingly, the estimation result shows that due to the boycott, the average weekly consumption of American beer and Belgian beer increased by 20.9%, 27.1%, respectively. While, there was no evidence that the boycott affected consumption of Korean beer, Chinese beer, and Dutch beer. These suggest that we cannot reject the null hypothesis (H2): The boycott on Japanese products has a substitution effect between Japanese beer and other beers. In addition, the Chow test result suggests that there was a structural change in the consumption of beer in each origin except for China. This implies that the boycott did not simply reduce the consumption of Japanese beer, but affected the consumption structure of the beer market.
Table 4.
Beer consumption estimation results
| (1) | (2) | (3) | (4) | (5) | (6) | |
| Japan | Korea | China | The Netherlands | The United States | Belgium | |
| Dt | -0.401** | -0.0877 | -0.0309 | -0.0526 | 0.209** | 0.271*** |
| (0.179) | (0.0799) | (0.114) | (0.0918) | (0.0887) | (0.0731) | |
| Constant | 2.727*** | 2.976*** | 2.200*** | 1.990*** | -0.161*** | 0.382*** |
| (0.0693) | (0.0420) | (0.0837) | (0.0526) | (0.0344) | (0.0398) | |
| Obs. | 135 | 135 | 135 | 135 | 135 | 135 |
| R-squared | 0.993 | 0.858 | 0.916 | 0.935 | 0.971 | 0.933 |
| Chow: F-test | 43.42*** | 8.48*** | 0.74 | 2.13* | 14.05*** | 20.04*** |
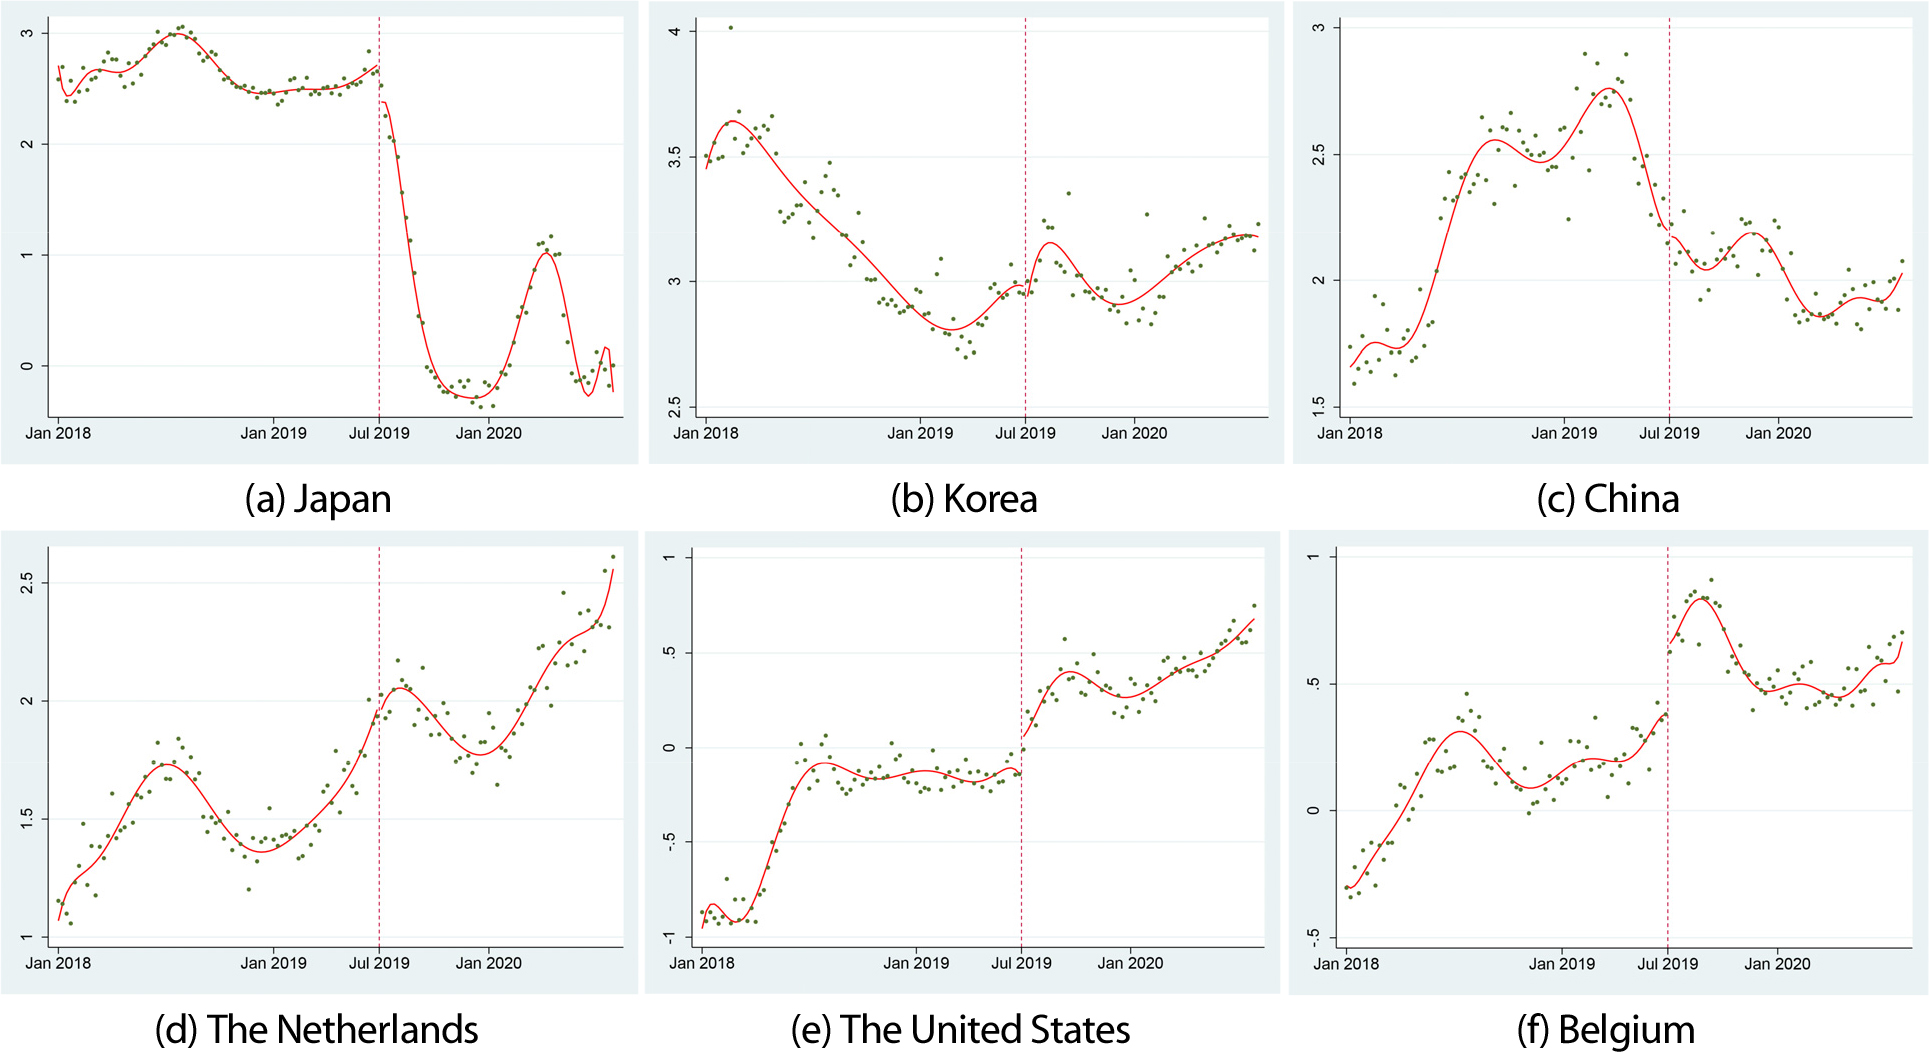
Fig. 2 plots the average weekly beer consumption for six origins along with a polynomial in time with an intercept for observations after the boycott started. There is visible decrease in Japanese beer consumption when the boycott started. Also we can find a visible evidence that the consumption of American beer and Belgian beer increased when the boycott started. While, there is no visible change in consumption of Korean beer, Chinese beer, and Dutch beer when the boycott started.
Beer Prices
Table 5 reports the selected order of the polynomials for each regression models based on AIC. We selected the regression model with the lowest AIC. The selected order is 11 for Japan, 13 for Korea, 7 for China, 11 for the Netherlands, 7 for the United States, and 8 for Belgium.
Table 5.
Order selection for beer price estimations
Table 6 represents the effects of the boycott on beer price models. The estimation results provide evidence of increase in Japanese beer price indicating that the boycott increased the weekly unit price of Japanese beer by 7.3%. When the boycott started, the weekly unit prices of Korean beer and Dutch beer were increased by 1.6%, 4.4%, respectively. While, when the boycott started, the weekly unit prices of American beer and Belgian beer were decreased by 3.0%, 3.8%, respectively. This suggests that the increase in consumption of American and Belgian beers due to the boycott was influenced by the lower prices of these beers at the same time as the boycott started. These findings indicate that we cannot reject the null hypothesis (H3): The boycott on Japanese products result in the price changes of Japanese beer and other beers. In addition, the Chow test result suggests that there was a structural change in the price of beer in each origin. This implies that the boycott did not simply affect the price of Japanese beer, but also affected the price structure of the beer market.
Table 6.
Beer price estimation results
| (1) | (2) | (3) | (4) | (5) | (6) | |
| Japan | Korea | China | The Netherlands | The United States | Belgium | |
| Dt | 0.0734** | 0.0167*** | 0.00194 | 0.0443*** | -0.0293* | -0.0381*** |
| (0.0290) | (0.00524) | (0.00412) | (0.0134) | (0.0165) | (0.0139) | |
| Constant | 3.975*** | 3.683*** | 3.942*** | 3.969*** | 3.986*** | 3.828*** |
| (0.00712) | (0.00232) | (0.00353) | (0.00838) | (0.0159) | (0.0118) | |
| Obs. | 135 | 135 | 135 | 135 | 135 | 135 |
| R-squared | 0.973 | 0.964 | 0.789 | 0.871 | 0.526 | 0.886 |
| Chow: F-test | 9.20*** | 10.15*** | 9.51*** | 6.34*** | 11.43*** | 16.87*** |
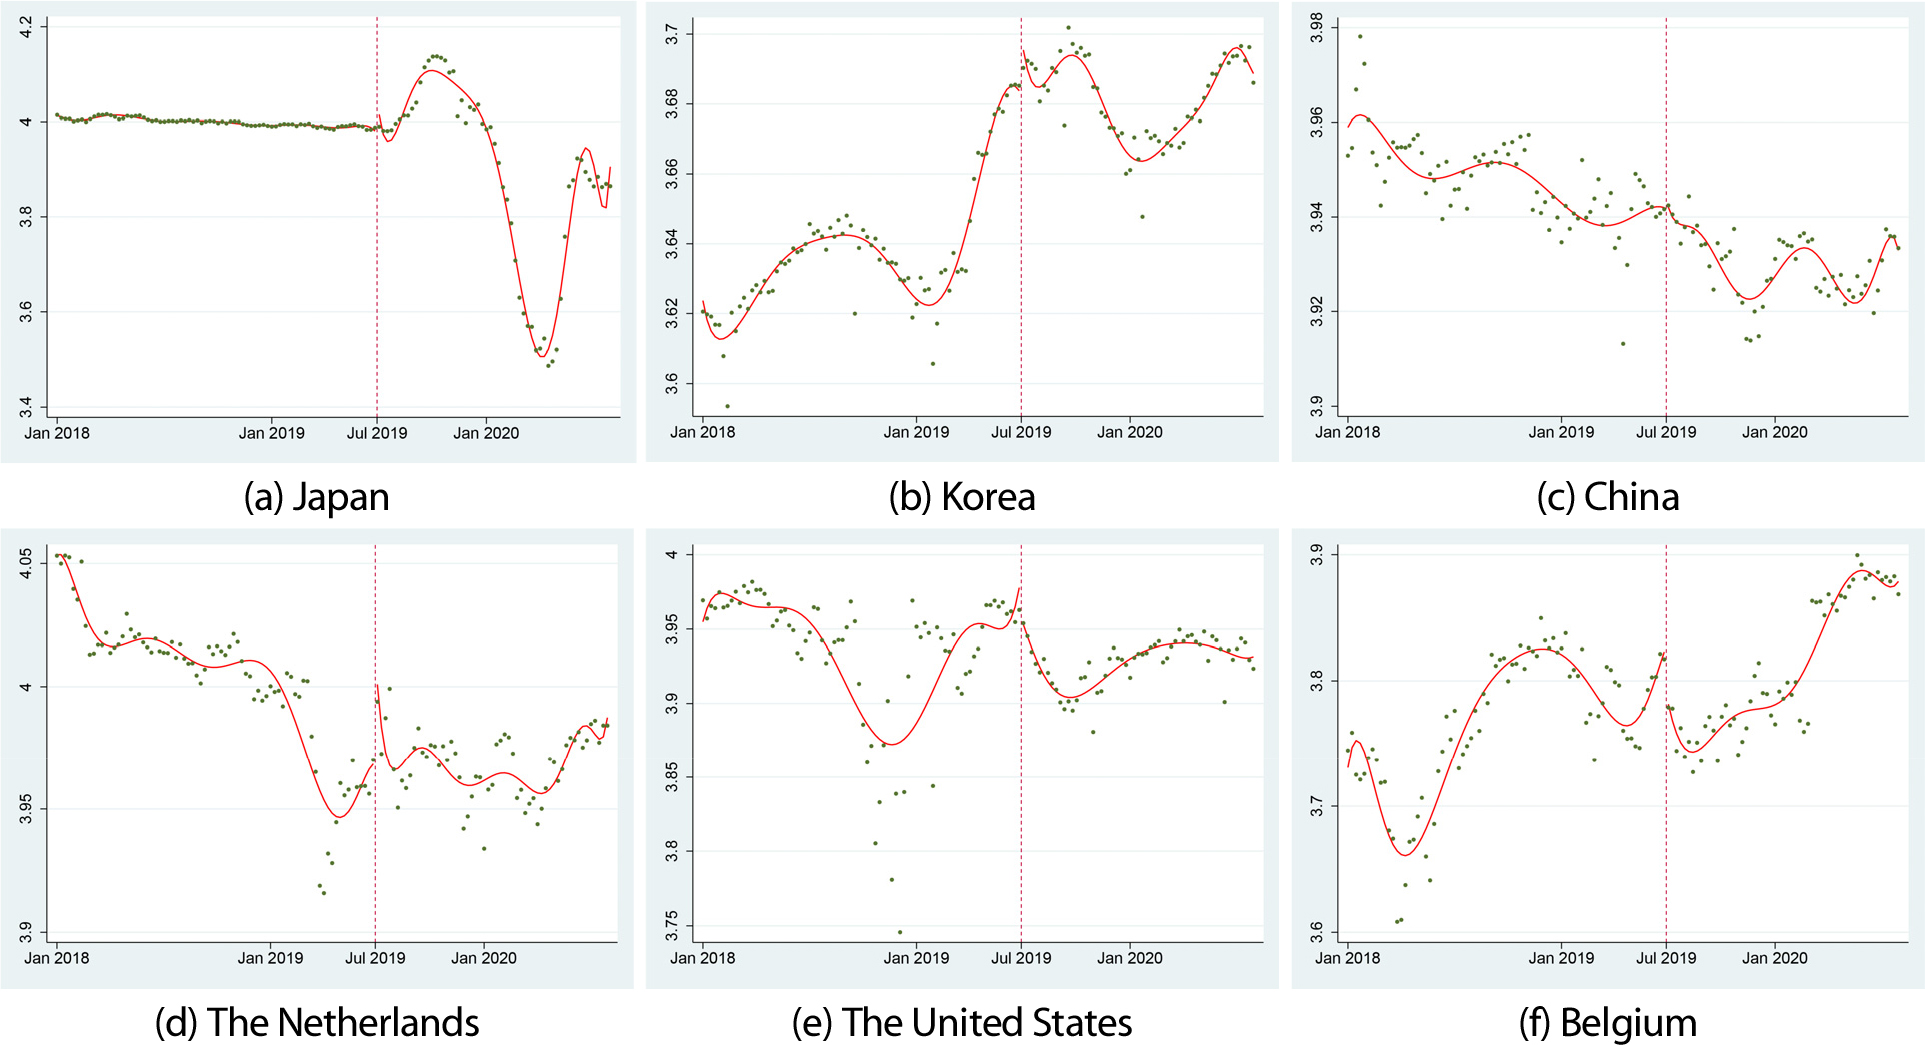
Fig. 3 plots the weekly unit price for six origins along with a polynomial in time with an intercept for observations after the boycott started. There is visible increase in Japanese beer, Korean beer, and Dutch beer when the boycott started. Also we can find a visible evidence that the unit price of American beer and Belgian beer decreased when the boycott started. While, there is no visible change in unit price of Chinese beer when the boycott started.
Robustness check
Table 7 reports the result of beer consumption estimation including monthly and week-of-month dummy variables. Controlling the seasonality, the effect of the boycott became larger than the previous analysis. The estimation results provide evidence that the boycott reduced the average weekly consumption of Japanese beer by 50.6%-52.2%. Also, the estimation result shows that due to the boycott, the average weekly consumption of American beer and Belgian beer increased by 37.5%-42.2%, 33.0%-40.6%, respectively. While, there was no evidence that the boycott affected consumption of Korean beer, Chinese beer, and Dutch beer.
Table 7.
Beer consumption estimation results
| (1) | (2) | (3) | (4) | (5) | (6) | |
| Japan | Korea | China | The Netherlands | The United States | Belgium | |
| Dt | -0.522** | -0.0707 | 0.0383 | 0.0336 | 0.375*** | 0.330*** |
| (0.231) | (0.0864) | (0.147) | (0.0858) | (0.101) | (0.105) | |
| Constant | 2.791*** | 2.993*** | 1.979*** | 1.807*** | -0.363*** | 0.189 |
| (0.286) | (0.159) | (0.177) | (0.140) | (0.114) | (0.133) | |
| Monthly dummies | Yes | Yes | Yes | Yes | Yes | Yes |
| Week of month dummies | No | No | No | No | No | No |
| Obs. | 135 | 135 | 135 | 135 | 135 | 135 |
| R-squared | 0.992 | 0.881 | 0.926 | 0.943 | 0.978 | 0.943 |
| Dt | -0.506** | -0.0258 | 0.0492 | 0.0802 | 0.422*** | 0.406*** |
| (0.231) | (0.0959) | (0.153) | (0.0968) | (0.0979) | (0.105) | |
| Constant | 2.780*** | 2.982*** | 1.954*** | 1.783*** | -0.387*** | 0.171 |
| (0.286) | (0.163) | (0.183) | (0.133) | (0.117) | (0.135) | |
| Monthly dummies | Yes | Yes | Yes | Yes | Yes | Yes |
| Week of month dummies | Yes | Yes | Yes | Yes | Yes | Yes |
| Obs. | 135 | 135 | 135 | 135 | 135 | 135 |
| R-squared | 0.992 | 0.885 | 0.928 | 0.950 | 0.979 | 0.949 |
Table 8 reports the result of beer price estimation including monthly and week-of-month dummy variables. The estimation results provide evidence of increase in Japanese beer price indicating that the boycott increased the weekly unit price of Japanese beer by 8.5%-8.8%. Also, when the boycott started, the weekly unit prices of Korean beer and Dutch beer were increased by 0.9%-1.0%, 2.7%-3.0%, respectively. While, when the boycott started, the weekly unit price of American beer and Belgian beer were decreased by 4.3%-4.5%, 6.6%-7.1%, respectively. However, there was no evidence that the boycott affected the price of Chinese beer.
Table 8.
Beer price estimation results
| (1) | (2) | (3) | (4) | (5) | (6) | |
| Japan | Korea | China | The Netherlands | The United States | Belgium | |
| Dt | 0.0881* | 0.00972* | -0.000726 | 0.0278** | -0.0446* | -0.0661*** |
| (0.0464) | (0.00494) | (0.00527) | (0.0123) | (0.0254) | (0.0210) | |
| Constant | 3.935*** | 3.686*** | 3.943*** | 3.951*** | 3.995*** | 3.824*** |
| (0.0592) | (0.00941) | (0.00963) | (0.0217) | (0.0362) | (0.0417) | |
| Monthly dummies | Yes | Yes | Yes | Yes | Yes | Yes |
| Week of month dummies | No | No | No | No | No | No |
| Obs. | 135 | 135 | 135 | 135 | 135 | 135 |
| R-squared | 0.968 | 0.967 | 0.830 | 0.911 | 0.631 | 0.881 |
| Dt | 0.0853** | 0.00911** | 0.000586 | 0.0304** | -0.0439* | -0.0711*** |
| (0.0448) | (0.00541) | (0.00592) | (0.0128) | (0.0254) | (0.0229) | |
| Constant | 3.943**** | 3.686**** | 3.943**** | 3.949**** | 3.996**** | 3.832*** |
| (0.0585) | (0.00907) | (0.00981) | (0.0224) | (0.0363) | (0.0430) | |
| Monthly dummies | Yes | Yes | Yes | Yes | Yes | Yes |
| Week of month dummies | Yes | Yes | Yes | Yes | Yes | Yes |
| Obs. | 135 | 135 | 135 | 135 | 135 | 135 |
| R-squared | 0.969 | 0.968 | 0.831 | 0.913 | 0.637 | 0.885 |
Conclusion
This study investigated the impact of the boycott on Japanese products in the Korean beer market. The result shows that the boycott decreased Japanese beer consumption but increased the consumption of American beer and Belgian beer. It also increased the unit prices of Japanese beer, Korean beer, and Dutch beer while it decreased the unit price of American beer and Belgian beer. These findings suggest that the increase in consumption of American and Belgian beers during the boycott may have been influenced by lower prices that dropped at the start of the boycott.
Our results highlight importance of pricing appropriately in response to market changes. Given the high market share of domestic beers, it seems likely that popular domestic beers would substitute for Japanese beers during the Japanese boycott, but the analysis in this study shows that domestic beers did not substitute for Japanese beers. In addition to domestic beers, Chinese and Dutch beers also appeared to be unable to substitute for Japanese beers, with the common feature that their prices did not decrease during the boycott. On the other hand, consumption of American and Belgian beers increased during the boycott, substituting for Japanese beers, which may be related to the lower prices of these beers. In other words, the substitutes that consumers who were buying Japanese beers chose during the boycott were presumably American and Belgian beers, which were cheaper than before. This suggests that in order to strengthen the competitiveness of domestic beers in response to these market changes, which are influenced by consumer preferences and purchasing behavior, it may be necessary to adjust prices according to market conditions.
The findings of the study indicate that boycotts targeting specific products from a particular country can have important implications for the beer industry. In this case, the boycott on Japanese products in the Korean beer market resulted in several noteworthy effects. Firstly, the boycott led to a decrease in Japanese beer consumption. This suggests that consumers were motivated to seek alternatives to Japanese beer due to the boycott. Therefore, it is crucial for beer companies to monitor consumer sentiments and adapt their strategies accordingly during politically charged events that may impact consumer behavior.
Secondly, the consumption of American and Belgian beers increased as a result of the boycott. This implies that consumers actively sought out alternative options from countries not affected by the boycott. Beer companies from non-boycotted countries can take advantage of such situations to enhance their market share by strategically promoting their products and emphasizing that they are not associated with the boycotted countries.
Finally, this study reveals that lower prices may play a role in driving the increased consumption of American and Belgian beers. This suggests that consumers may be sensitive to pricing changes, especially during boycotts or politically charged situations. Beer companies should consider adjusting their pricing strategies to attract consumers seeking alternative options during such events.
This study focused on examining the impact of the Japanese product boycott on the Korean beer market at a specific time point, so it was only able to analyze the temporary effects of the boycott. Future studies that investigate the long-term effects of the boycott on the beer market, as well as the temporary effects, will contribute to a more comprehensive understanding of changes in consumer behavior.
