

Introduction
Materials and Methods
Experimental Materials and Reagents
Preparation of F. esculentum Extracts
Total Phenolic Content Analysis
Total Flavonoid Content Analysis
Rutin Content Analysis
General Component Analysis
DPPH Radical Scavenging Activity
ABTS Radical Scavenging Activity
FRAP Activity Measurement
Reducing Power
Statistical Methods
Results and Discussion
General Component Analysis
Analysis of Total Phenolic, Total Flavonoid, and Rutin Contents in F. esculentum
Evaluation of the Antioxidant Capacity of F. esculentum Extracts
Conclusion
Introduction
Buckwheat (Fagopyrum esculentum) is a dicotyledonous plant originating from northwestern Yunnan Province, China, known for its ability to adapt and grow in diverse environments (Ohnishi, 1998). According to various sources, the global cultivation area of Fagopyrum esculentum was estimated to be approximately 1,673,478 ha in 2019, with total production reaching about 2,042,401 tons in the same year. Major producing countries include Russia, China, the United States, and Ukraine, where F. esculentum is widely cultivated (Graziano et al., 2022; Zhang et al., 2021). F. esculentum possesses various physiological benefits, including anti-cancer and anti-inflammatory activity (Zhu, 2016), and is nutritionally valuable due to its rich content of proteins, amino acids, and minerals. Due to these characteristics, it is utilized in various processed foods, such as baking, pasta, and tea, and has recently gained attention as an important raw material for developing functional foods (Atambayeva et al., 2024).
The functional properties of F. esculentum are primarily attributed to phenolic compounds and flavonoids. These components are known to alleviate oxidative stress by eliminating reactive oxygen species within the body; through their antioxidant and anti-inflammatory actions, they contribute to improving cardiovascular health, regulating immunity, and preventing metabolic diseases (Holasova et al., 2002; Liu et al., 2024). In particular, rutin is the most abundant flavonoid in F. esculentum, occurring in a glycoside form wherein rutoside is bound to quercetin. Rutin is also referred to as rutoside, quercetin-3-rutinoside, and sophorin (Akash et al., 2024). It exhibits various physiological activities, including antioxidant, anti-inflammatory, antihypertensive, and anticancer effects, and is utilized as a representative indicator component for evaluating F. esculentum functionality (Kaur and Muthuraman, 2016). However, improper conditions during the extraction process, such as high-temperature treatment or excessive solvent use, can lead to the loss of rutin and other key bioactive compounds, thereby reducing the nutritional value of F. esculentum (Plaskova and Mlcek, 2023). Therefore, there is a need to establish optimal extraction conditions that effectively preserve the bioactive components of F. esculentum, while maximizing extraction efficiency.
Moreover, the content of bioactive compounds in F. esculentum has been reported to vary depending on the climate and environmental conditions of the cultivation region (Kiprovski et al., 2015; Žvikas et al., 2017). Even within the same species, the accumulation levels of phenolic compounds and flavonoids can vary depending on environmental factors such as soil, rainfall, sunlight exposure, and temperature. This serves as a key factor in forming quality differences between origins. These differences underscore the need for standardized research that accounts for regional variations in composition when utilizing F. esculentum as a functional food ingredient. However, reported studies have often been limited to specific regions or varieties, and standardized research that considers compositional variation based on origin and extraction conditions remains insufficient.
Therefore, this study compared and analyzed the general components, rutin content, and antioxidant activity of three domestic F. esculentum varieties (Bongpyeong, Nonsan, and Yecheon) and one Chinese variety. Accordingly, the study aims to identify differences in compositional characteristics and antioxidant capacity by origin, standardize extraction conditions, and enhance the extraction efficiency of bioactive compounds. The results of this study are expected to serve as foundational data for utilizing F. esculentum as a functional food ingredient, while also contributing to future industrial applications and origin-based quality control.
Materials and Methods
Experimental Materials and Reagents
The samples used in this study comprised three domestic varieties and one Chinese variety of F. esculentum. The domestic F. esculentum varieties were purchased from Bongpyeong Buckwheat Market (Bongpyeong, Korea), Natural Hanjae (Nonsan, Korea), and Sohwa Farm (Yecheon, Korea). The Chinese F. esculentum variety was sourced from a product distributed through Hyugyeja Agricultural Products (Korea). All samples were homogenized to a particle size of 20 mesh or smaller and stored at 4°C. For analyzing antioxidant capacity and rutin content, 2,2-diphenyl-1-picrylhydrazyl (DPPH), gallic acid, Folin-Ciocalteu’s phenol reagent, sodium phosphate monobasic, sodium phosphate dibasic, trichloroacetic acid, 2,2’-azino-bis(3-ethylbenzothiazoline-6-sulfonic acid) (ABTS), potassium persulfate, potassium acetate, rutin (≥ 98%, HPLC grade), sodium acetate, 2,4,6-tripyridyl-s-triazine, ferric chloride, aluminum nitrate, ascorbic acid, ethanol, sodium carbonate, potassium ferricyanide, and other reagents were all purchased from Sigma-Aldrich Co. (St. Louis, MO, USA).
Preparation of F. esculentum Extracts
Optimal extraction conditions were established for all examined F. esculentum varieties: Bongpyeong F. esculentum extract (BFE), Nonsan F. esculentum extract (NFE), Yecheon F. esculentum extract (YFE), and the Chinese F. esculentum extract (CFE). EtOH (solvent) concentration was set at 50% and 70%, and extraction temperature was divided into three conditions: 40°C, 60°C, and 80°C. The extraction time was fixed at 2 hours, as reported by Wang and Bai (2017), to yield the highest flavonoid and antioxidant activity. For the extraction experiment, 50 g of F. esculentum powder per variety was placed in a 500 mL volumetric flask. Distilled water and EtOH (Daejung Chemical Co., Siheung, Korea) at the corresponding concentration were then added to ensure complete immersion of the sample. Subsequently, extraction was performed under the set conditions using a reflux cooling apparatus (Tokyo Rikakikai Co., Ltd., Tokyo, Japan). The extract was filtered through qualitative filter paper (Whatman No. 3; Whatman Ltd., Maidstone, UK) to remove residuals, and concentrated to a final volume of 35 mL at 40°C using a rotary vacuum concentrator (Tokyo Rikakikai Co., Ltd., Tokyo, Japan). Finally, the sample was freeze-dried at -50°C for 7 days using a freeze dryer (Ilshinbiobase Co., Ltd., Dongducheon, Korea) to produce a powder.
Total Phenolic Content Analysis
Total phenolic content (TPC) was determined by applying the method of Guclu et al. (2006). First, 1 mL of 10% Folin-Ciocalteu’s reagent and 1 mL of 2% NaCO3 solution were added to 1 mL of the diluted sample solution. The mixture was then agitated and incubated in a dark environment at room temperature for 1 hour. Subsequently, 200 µL aliquots were dispensed into a 96-well plate, and absorbance at 750 nm was measured using a microplate reader (Molecular Devices, CA, USA). The results were converted to gallic acid equivalent (GAE) and expressed as mg GAE/g.
Total Flavonoid Content Analysis
Total flavonoid content (TFC) was determined by applying the method of Moreno et al. (2000). To 0.5 mL of diluted sample solution, 1.5 mL of 95% ethanol, 0.1 mL of 10% aluminum nitrate, 1 M potassium acetate, and 2.8 mL of distilled water were added. After mixing, the mixture was incubated at room temperature for 30 minutes. Subsequently, 200 µL aliquots were dispensed into a 96-well plate, and the absorbance was measured at 415 nm using the microplate reader. The results were converted to rutin equivalent (RE) and expressed as mg RE/g.
Rutin Content Analysis
F. esculentum was analyzed based on rutin, which has been reported as an indicator compound in previous studies (Lee, 2022). A 10 mg standard material of rutin was dissolved in MeOH and diluted to a final volume of 10 mL to prepare a 1000 µg/mL stock solution. This stock solution was then sequentially diluted with MeOH to prepare working solutions at concentrations of 100, 50, 25, 12.5, 6.25, 3.125, and 1.56 µg/mL. The rutin content in each sample was calculated using its corresponding calibration curve. The analysis of indicator components was performed using an HPLC system (LC-40XR Series, Shimadzu, Kyoto, Japan) equipped with a photodiode array detector (PDA). The analytical conditions were based on the methods of Gulpinar et al. (2012), as presented in Table 1.
Table 1
HPLC conditions for analysis of rutin
General Component Analysis
The moisture, crude protein, crude fat, crude ash, and carbohydrate contents of each F. esculentum sample were determined following the method described by Lee et al. (1992). Moisture content was measured by dry-down at 105°C under atmospheric pressure, and crude protein was analyzed using a semi-micro Kjeldahl apparatus applying the Kjeldahl method. Crude fat content was quantified after extraction using a Soxhlet apparatus (Hillerod, Denmark), and ash content was measured by direct ashing at 600°C for 2 hours. Carbohydrate content was calculated by subtracting the sum of moisture, crude protein, crude fat, and crude ash contents from the total (100%).
DPPH Radical Scavenging Activity
The DPPH radical scavenging activity was measured using a method adapted from Kedare and Singh (2011). First, 0.2 mL of a sample, previously diluted to various concentrations, was added to 0.8 mL of a 0.4 mM DPPH solution. The mixture was then agitated for 5 seconds. Subsequently, EtOH was added to adjust the absorbance to a range of 1.0 to 1.2 at 517 nm using the microplate reader. The reaction mixture was incubated for 10 minutes at 25°C in the dark, and the absorbance was then measured at 517 nm. The DPPH radical scavenging activity was calculated according to the following formula, with ascorbic acid used as the positive control.
ABTS Radical Scavenging Activity
ABTS radical scavenging activity was measured by applying the method of Yan et al. (2018). ABTS solution was prepared by incubating 7 mM ABTS and 2.45 mM potassium persulfate solution for 16 hours at 25°C in the dark. Subsequently, dilution was performed using the microplate reader to achieve an absorbance value of 0.70 ± 0.02 at 734 nm. A 10 µL sample solution diluted to various concentrations was mixed with 1 mL of ABTS solution and incubated at 25°C for 6 minutes. Subsequently, absorbance was measured at 734 nm. The ABTS radical scavenging capacity was calculated using the following formula, with ascorbic acid — proven to exhibit excellent antioxidant activity in previous studies (Kim et al., 2002) — serving as the positive control.
FRAP Activity Measurement
FRAP activity was measured by applying the method of Benzie and Strain (1996). Sodium acetate and acetic acid were mixed to prepare a 300 mM sodium acetate buffer at pH 3.6. A 10 mM TPTZ solution was preparing by mixing 40 mM HCl with TPTZ. The reaction solution for the experiment was prepared by mixing 300 mM sodium acetate buffer (pH 3.6), 10 mM TPTZ, and 20 mM FeCl3・Cl in a 10:1 ratio. 1 : It was used in a 1:1 ratio. A reaction mixture comprising 1.5 mL reaction solution, 50 µL of each sample, and 150 µL of distilled water was incubated at 37°C for 4 minutes. Subsequently, absorbance was measured at 593 nm.
Reducing Power
Reducing power was measured following the method of Yu et al. (2013). For each concentration, 0.5 mL of the diluted sample was mixed with 2.5 mL of 0.2 M sodium phosphate buffer (pH 6.6) and 2.5 mL of 1% potassium ferricyanide. The mixture was then incubated at 50°C for 20 minutes. Following termination of the reaction, 2.5 mL of 10% trichloroacetic acid was added, and the solution was subjected to centrifugation at 1,790 × g for 10 minutes. Then, 2.5 mL of distilled water and 0.5 mL of 0.1% FeCl3 solution were added to 2.5 mL of the supernatant and mixed. Then, absorbance at 700 nm was measured. Ascorbic acid was used as the positive control.
Statistical Methods
All experiments in this study were performed in triplicate (n = 3) and presented as mean ± standard deviation. Statistical analysis for each test group was performed using IBM SPSS Statistics software ver. 29 (IBM SPSS). For antioxidant capacity evaluation, one-way ANOVA and Duncan’s multiple range test were performed at the P & 0.05 level.
Results and Discussion
General Component Analysis
The general composition of the three domestic variants (BFE, NFE, YFE) and one Chinese variant (CFE) is presented in Table 2. The moisture content per 100 g was highest in BFE (12.07%), with lower levels in NFE (6.60%), YFE (11.07%), and CFE (11.56%). The crude protein content was also highest in NFE (16.33%), with lower levels in BFE (12.07%), YFE (12.41%), and CFE (11.76%), indicating protein content differences depending on breed and origin. The crude fat content was highest in BFE at 3.10%, whereas NFE and YFE contained 2.63% and 2.65%, respectively, and CFE exhibited the lowest value (1.92%). The crude ash content was highest in YFE (2.48%), followed by NFE (2.30%), and BFE and CFE (both 1.83%), revealing subtle differences between origins and varieties. The carbohydrate content was highest in CFE (72.93%), followed by NFE (72.14%), YFE at (71.39%), and BFE (70.93%), indicating that Chinese F. esculentum exhibited a relatively high carbohydrate ratio. The results of the general component analysis in this study showed trends and values comparable to those reported for domestic and Chinese F. esculentum by Cho et al. (2016). This suggests that while the general components of F. esculentum remain within a consistent range overall, specific numerical differences may be influenced by origin and variety. Additionally, Lee et al. (1991) reported that the general components of F. esculentum vary depending on cultivation environment and condition. Specifically, in a comparison by planting season, F. esculentum sown in summer showed approximately 0.32% higher crude protein and ash contents than F. esculentum sown in spring. These results suggest that the general composition of F. esculentum is not solely determined by differences in origin but is also influenced by the combined effects of various agricultural factors including cultivation environment, climatic conditions, and sowing time.
Table 2
Approximate ingredients of Korean and Chinese Fagopyrum esculentum varieties (%, v/w)
| Approximate ingredient | Moisture | Crude protein | Crude fat | Crude ash | Carbohydrate | |
| Korea | BFE1) | 12.07 ± 0.08a | 12.07 ± 0.37b | 3.10 ± 0.12a | 1.83 ± 0.26b | 70.93 ± 0.48c |
| NFE2) | 6.60 ± 0.10d | 16.33 ± 0.43a | 2.63 ± 0.38b | 2.30 ± 0.03a | 72.14 ± 0.58b | |
| YFE3) | 11.07 ± 0.18c | 12.41 ± 0.01b | 2.65 ± 0.13b | 2.48 ± 0.05a | 71.39 ± 0.25c | |
| China | CFE4) | 11.56 ± 0.37b | 11.76 ± 0.14c | 1.92 ± 0.13c | 1.83 ± 0.10b | 72.93 ± 0.43a |
Analysis of Total Phenolic, Total Flavonoid, and Rutin Contents in F. esculentum
This study aimed to establish optimal extraction conditions to maximize the content of beneficial components (total flavonoid, total phenol, and rutin contents) in F. esculentum extracts based on their origin. For this purpose, EtOH concentrations were set at 50% and 70% and extraction temperatures were set at 40°C, 60°C, and 80°C. To evaluate extraction efficiency, total phenol, total flavonoid, and rutin contents were selected because they reflect the content of important components. When the extraction temperature and time were fixed at 60°C and 2 h, respectively, the effects of EtOH concentration on total flavonoid, total phenol, and rutin contents were evaluated. A consistent trend was observed across all samples: the 70% EtOH condition yielded significantly higher contents than the 50% condition. The total phenolic content was significantly higher overall in the 70% EtOH extract (Fig. 1A), suggesting that increasing EtOH concentration may promote the extraction of various polyphenolic compounds, as reported by Woo et al. (2025). Furthermore, total phenolic content serves as an indicator for comprehensively evaluating the antioxidant potential of extracts by reflecting the total amount of various polyphenolic compounds present in plant material (Dai and Mumper, 2010). Total flavonoid content was also significantly higher in all origins under 70% EtOH conditions (Fig. 1B). Rahim et al. (2022) reported that flavonoid content is closely correlated with DPPH and ABTS free radical scavenging activity. The flavonoid increase identified in the present study also suggests the potential to contribute to enhanced antioxidant activity. Rutin content was also the highest in the 70% EtOH extract (Fig. 1C). Consistent with the findings of Jiang et al. (2007), higher rutin content was closely associated with enhanced free radical scavenging activity. This suggests that the extraction of antioxidant components is maximized under 70% EtOH conditions. Accordingly, all samples showed a consistent trend, with total phenol, total flavonoid, and rutin contents significantly increasing at 70% EtOH. The EtOH concentration of 70% is determined to be the optimal extraction condition for maximizing the functional components of F. esculentum extract. Total polyphenol, total flavonoid, and rutin contents were evaluated by varying the extraction temperature while maintaining a fixed ethanol concentration (70%) and extraction time (2 hours). Total polyphenol content and total flavonoid content generally showed maximum values at an extraction temperature of 40°C and exhibited a gradual decrease with increasing temperature (Fig. 2A and 2C). This pattern suggests that while extraction may be temporarily enhanced at high temperatures, extraction efficiency may decrease above a certain critical temperature due to the thermal decomposition of polyphenols and flavonoids (Son et al. 2020). Furthermore, rutin content was highest at 40°C extraction temperature and gradually decreased with increased temperature (Fig. 2C). This indicates that rutin is vulnerable to pyrolysis at high temperatures and exhibits higher extraction yields under low-temperature conditions, in line with the findings of Yoon et al. (2006). Based on the above results, considering the preservation of useful components and yield, 70% EtOH, 40°C, and 2 hours were established as the optimal extraction conditions in this study.
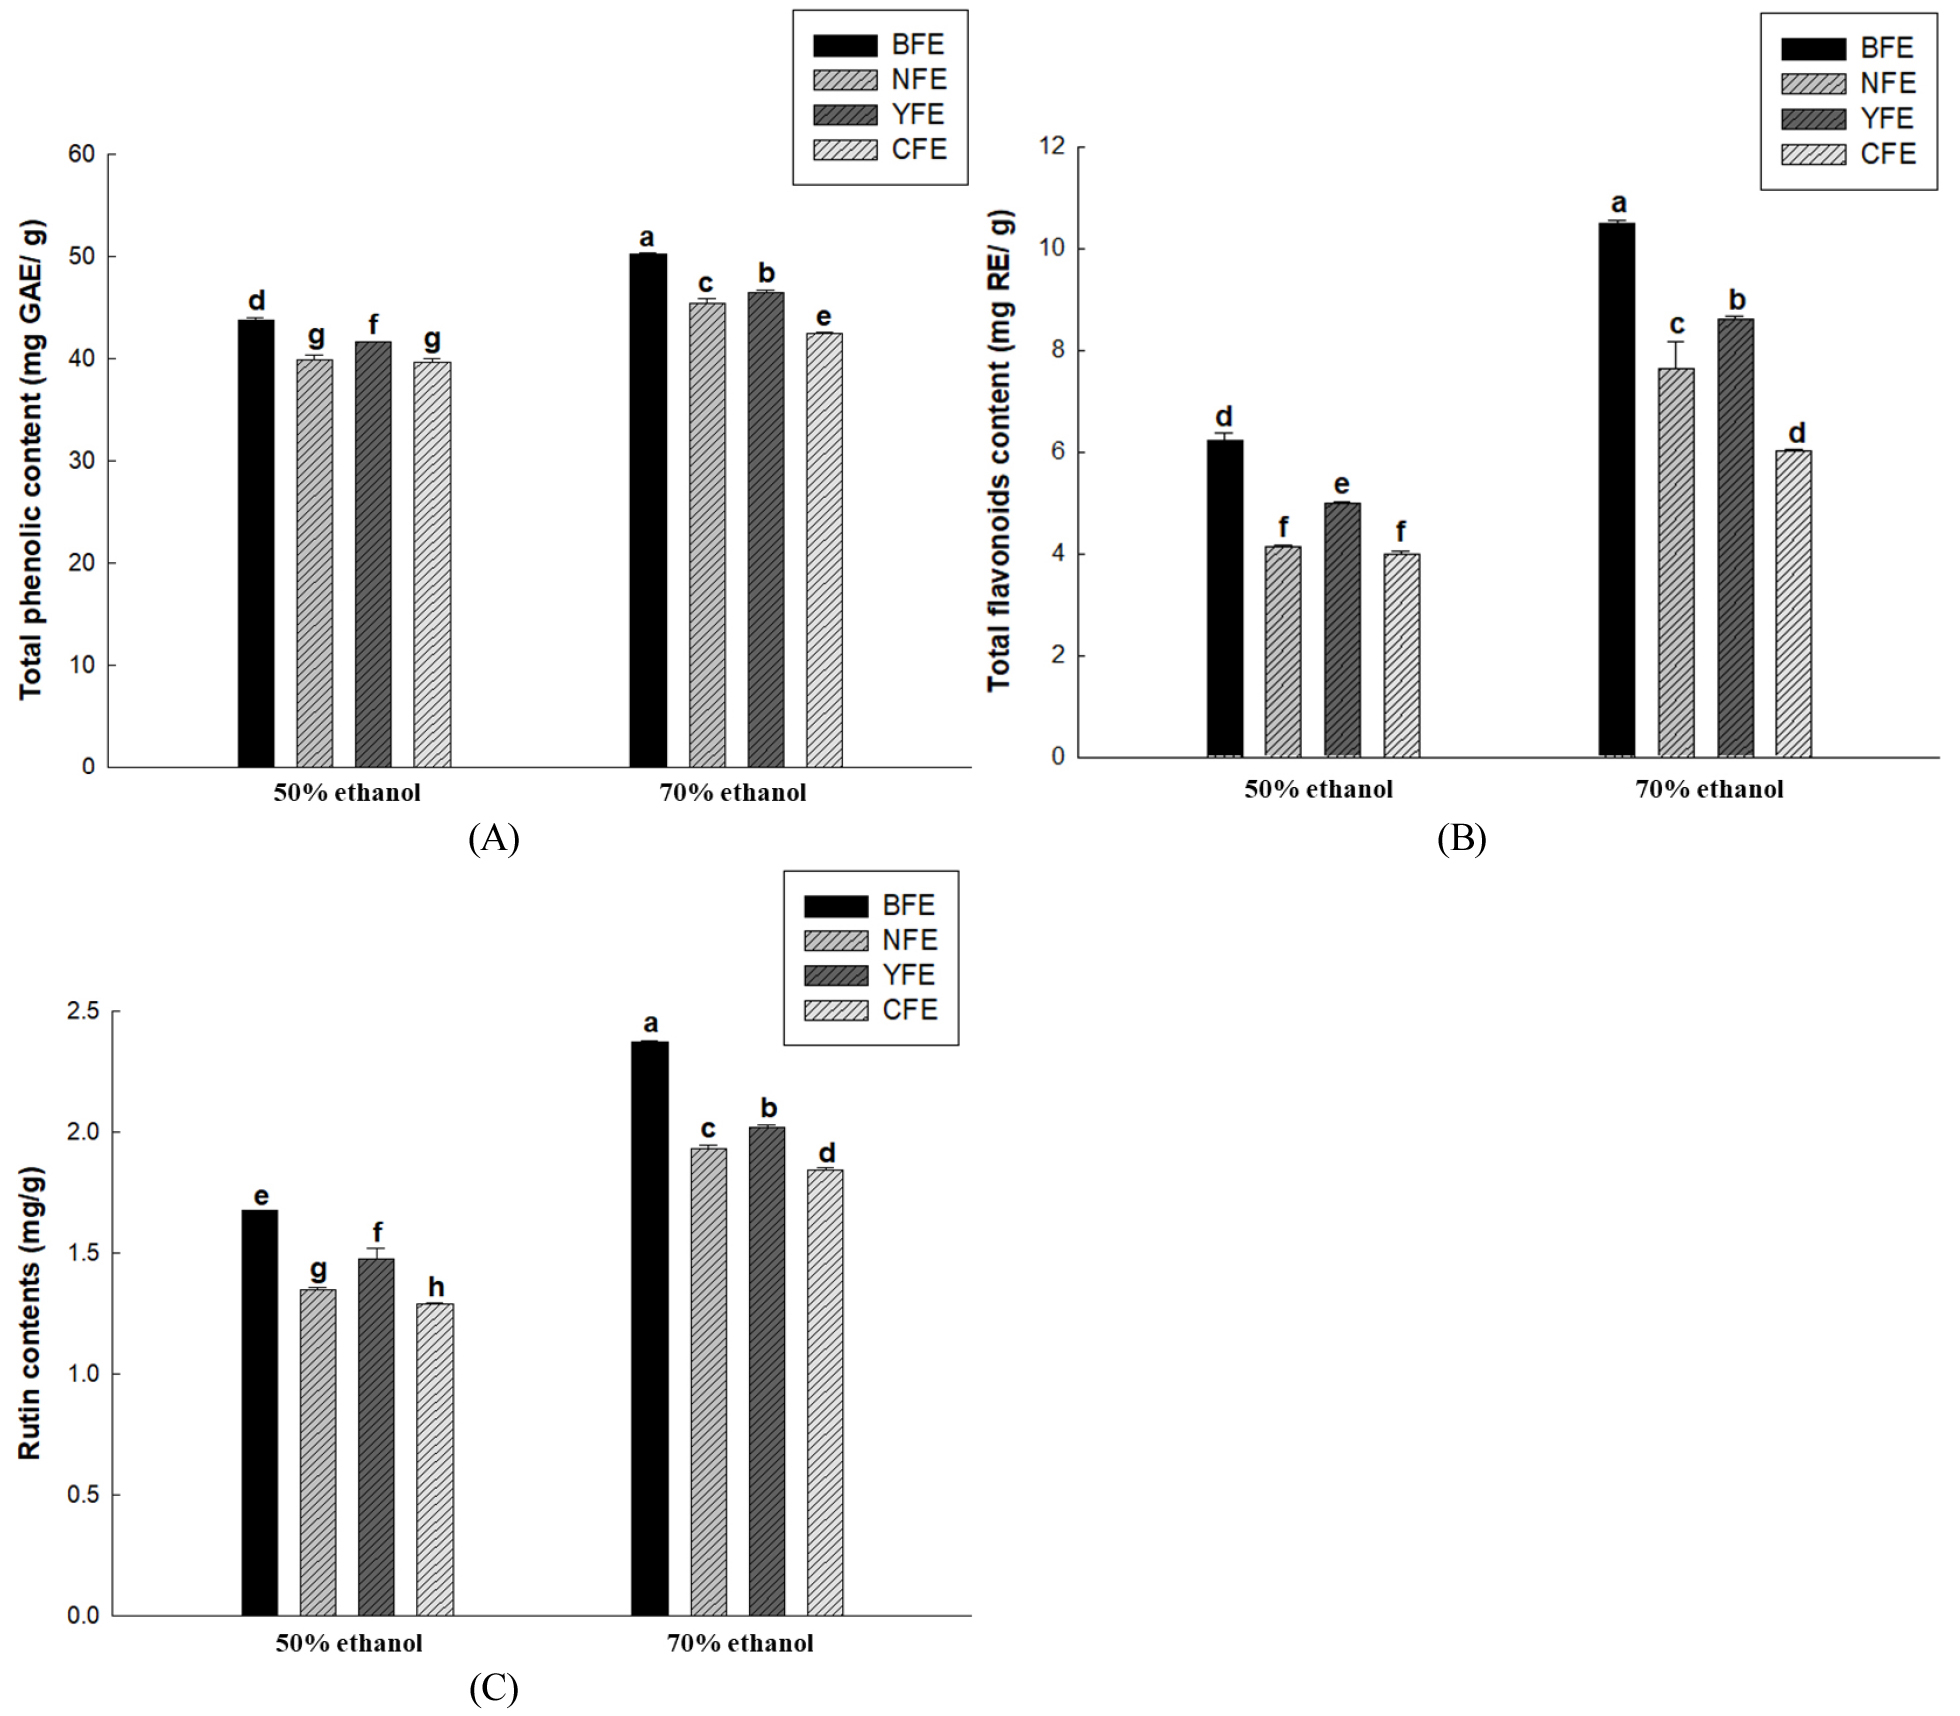
Fig. 1.
Total phenolic content (mg GAE/g) (A), Total flavonoid content (mg RE/g) (B), and rutin contents (mg/g) (C) of samples from BFE, NFE, YFE, and CFE with extraction using 50% or 70% ethanol. Results are presented as the mean ± standard deviation of three independent experiments performed in triplicate. Means with different letters indicate significant difference at p & 0.05 according to Duncan’s multiple range test.
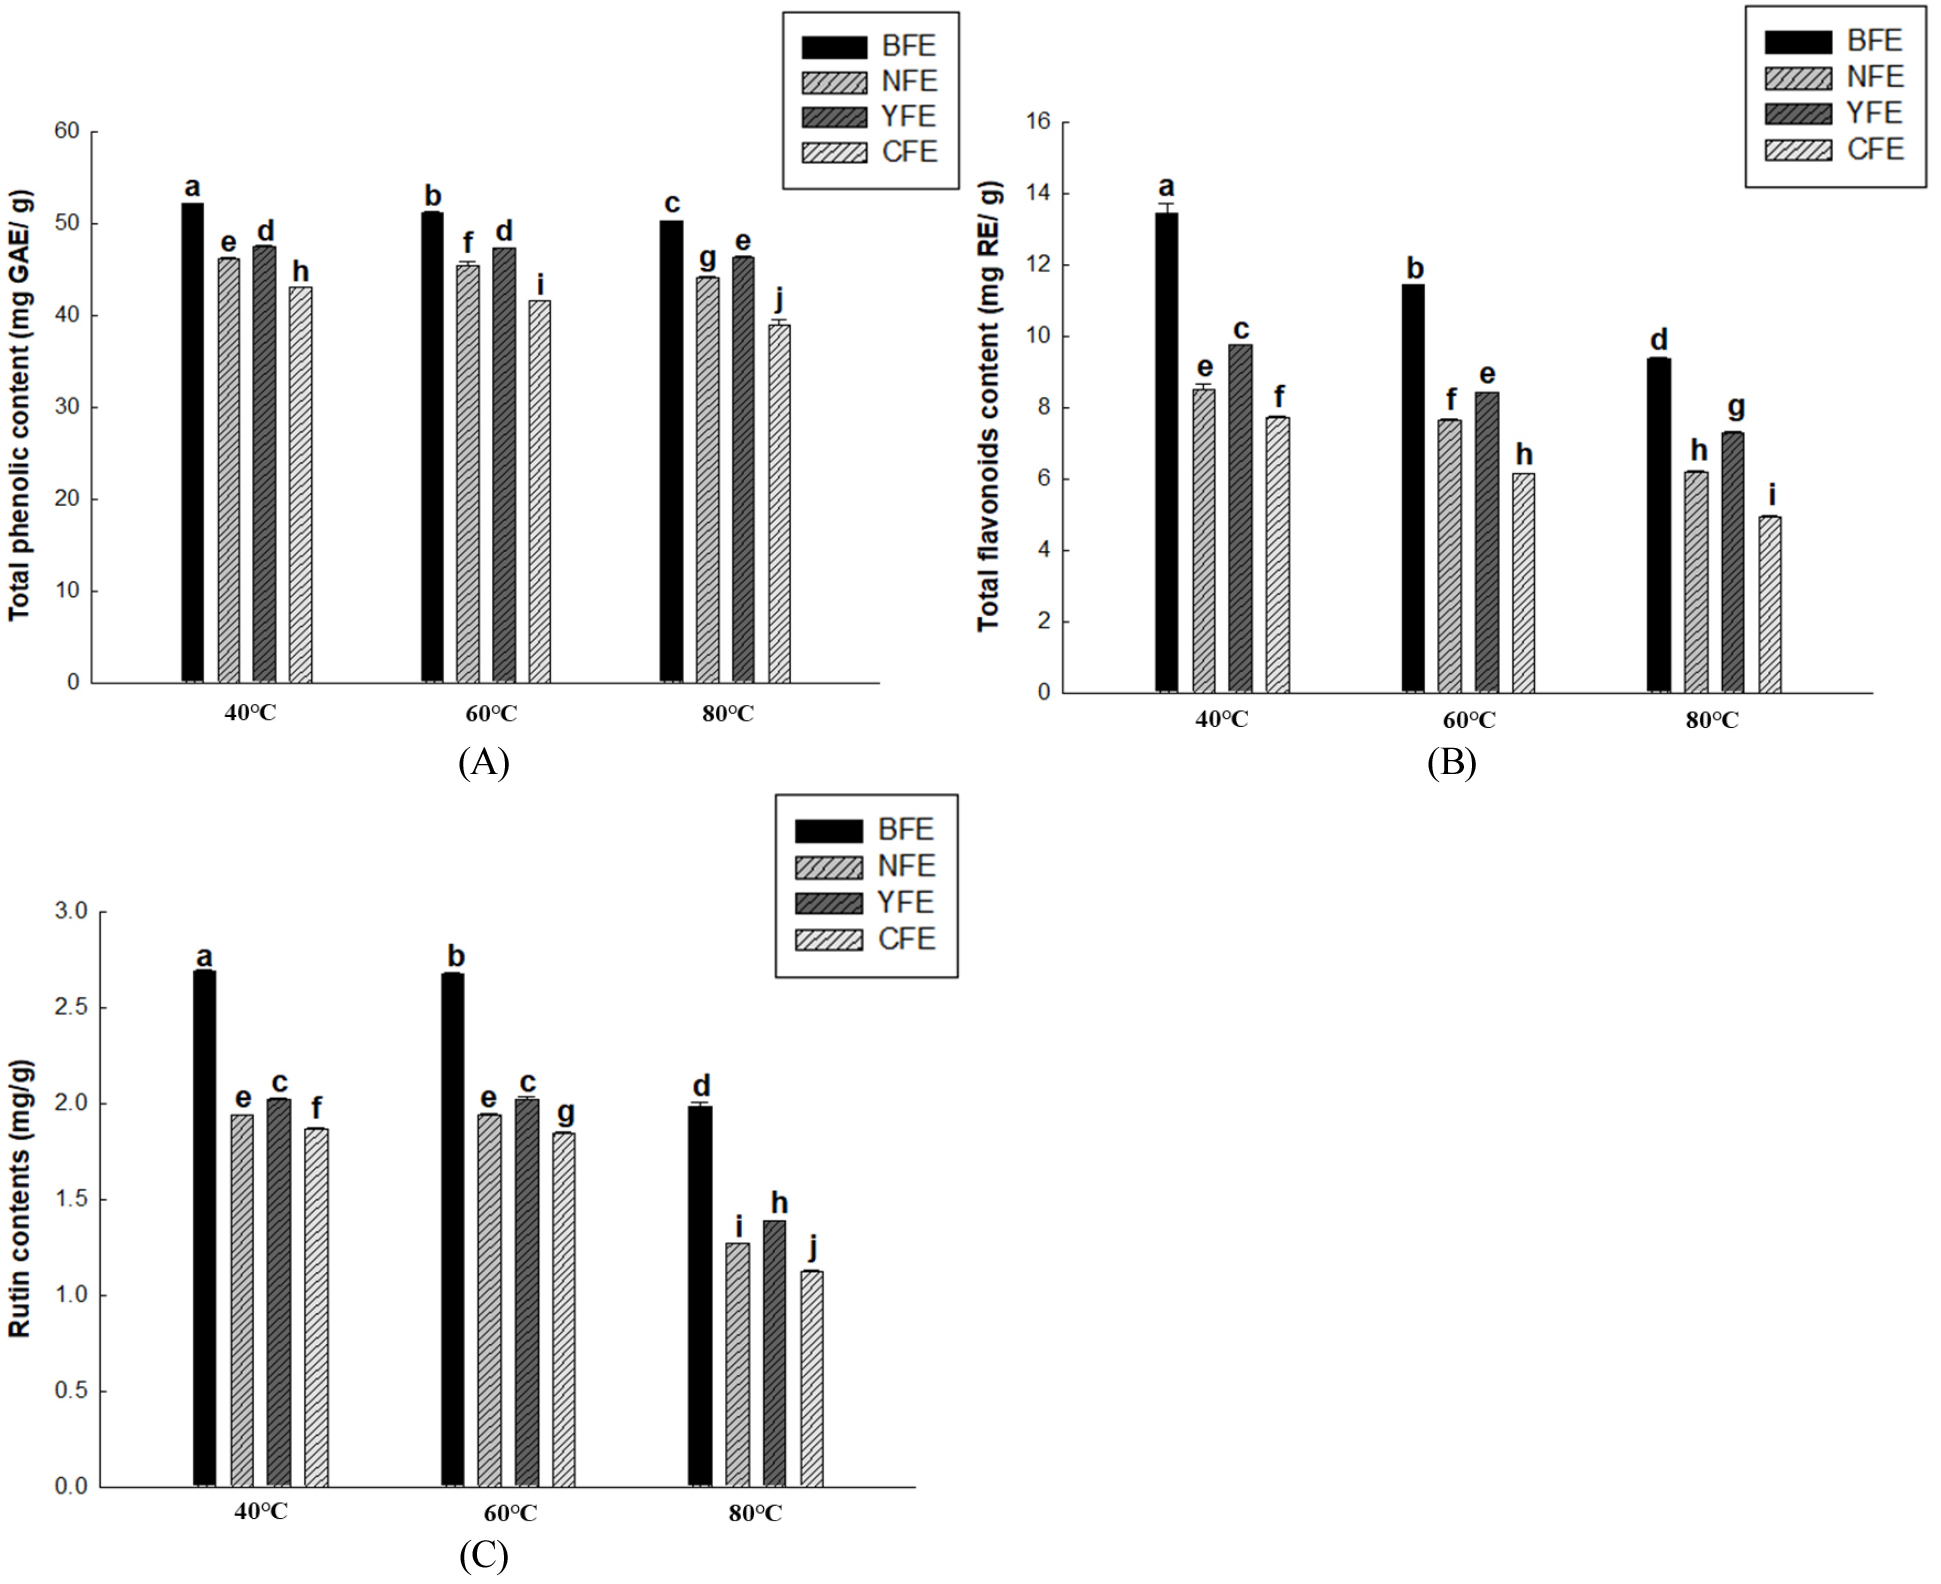
Fig. 2.
Total phenolic content (mg GAE/g) (A), Total flavonoid content (mg RE/g) (B), and rutin contents (mg/g) (C) of samples from BFE, NFE, YFE, and CFE with extraction at 40°C, 60°C, or 80°C. Results are presented as the mean ± standard deviation of three independent experiments performed in triplicate. Means with different letters indicate significant differences at p & 0.05 according to Duncan’s multiple range test.
Evaluation of the Antioxidant Capacity of F. esculentum Extracts
The antioxidant activity of F. esculentum extracts were evaluated through DPPH radical scavenging activity, ABTS radical scavenging activity, FRAP activity, and reducing power analysis. Among these, the DPPH radical scavenging assay is a representative colorimetric method used to evaluate the free radical scavenging capacity of antioxidants. It is a simple and standardized method widely used for evaluating the antioxidant properties of pure compounds (Mishra et al., 2012). In the present study, the DPPH radical scavenging activity of BFE, NFE, YFE, and CFE extracts was measured at concentrations of 0.1, 0.5, and 1 mg/mL. The results showed that scavenging activity increased in a concentration-dependent manner for all samples. BFE exhibited the highest activity, followed by YFE and NFE, whereas CFE showed the lowest activity (Fig. 3A). These results appear to reflect the differences in composition based on the origin and variety of F. esculentum. In particular, the highest activity observed in BFE may be attributed to the relatively high polyphenol and flavonoid contents in that sample. Meanwhile, Kang (2014) reported lower DPPH radical scavenging activity when using hydrothermal extraction, relative to the present study, and this may be due to the difference in extraction solvents affecting the leaching efficiency of antioxidant components. Furthermore, the ABTS assay measures antioxidant effects by utilizing the decolorization of the characteristic blue-green radical color, which occurs when the ABTS radical generated by reaction with potassium peroxymonosulfate is quenched by the active substances in the extract (Santos-Sánchez et al., 2019). The ABTS radical scavenging activity was concentration-dependent in the treatment groups at 0.1, 0.5, and 1 mg/mL (Fig. 3B). The FRAP method is an antioxidant verification technique with a different mechanism from that of the method described earlier that measures DPPH radical scavenging activity. While the DPPH method evaluates antioxidant activity by directly scavenging free radicals, the FRAP method is a measurement technique utilizing oxidation-reduction reactions. It determines the antioxidant potential of a given sample by comparing changes in absorbance at 600 nm to a standard substance. Higher antioxidant activity results in higher absorbance values (Student et al., 1980). The FRAP activity of F. esculentum extracts by origin showed absorbance values of 0.13-0.37 for BFE, 0.11-0.35 for NFE, 0.13-0.36 for YFE, and 0.09-0.34 for CFE at concentrations of 0.1, 0.5, and 1 mg/mL (Fig. 3C). The reducing power increased in a concentration-dependent manner, leading to enhanced antioxidant activity. BFE exhibited the highest activity, followed by YFE and NFE, while CFE showed the lowest activity. The reducing power method measures the antioxidant capacity of a sample by determining the antioxidant’s ability to reduce ferricyanide (Fe3+) to ferrous ions (Fe2+) (Vasyliev et al., 2020). At concentrations of 0.1, 0.5, and 1 mg/mL for F. esculentum extracts from different origins, BFE exhibited the highest activity (absorbance of 0.05-0.24), followed by NFE (0.05-0.22), YFE (0.05-0.24), and CFE (0.04-0.22) (Fig. 3D). Furthermore, similar to the FRAP assay, antioxidant activity increased as reducing power rose in a concentration-dependent manner. After compiling the results of the four antioxidant activity assays, BFE exhibited the highest activity across all indicators and CFE showed the lowest activity. This trend reflects that the content and composition of antioxidant components may vary depending on the origin and variety of F. esculentum. In particular, the results of this study showed consistent correlations with total polyphenol and total flavonoid contents, as well as with the content of rutin—a key indicator compound; this result reveals that differences in antioxidant activity stem from variations in the composition of functional components across different origins and varieties. Overall, this study suggests that when evaluating the potential of F. esculentum as a functional food ingredient, it is important to consider the origin and variety-specific composition of its components.
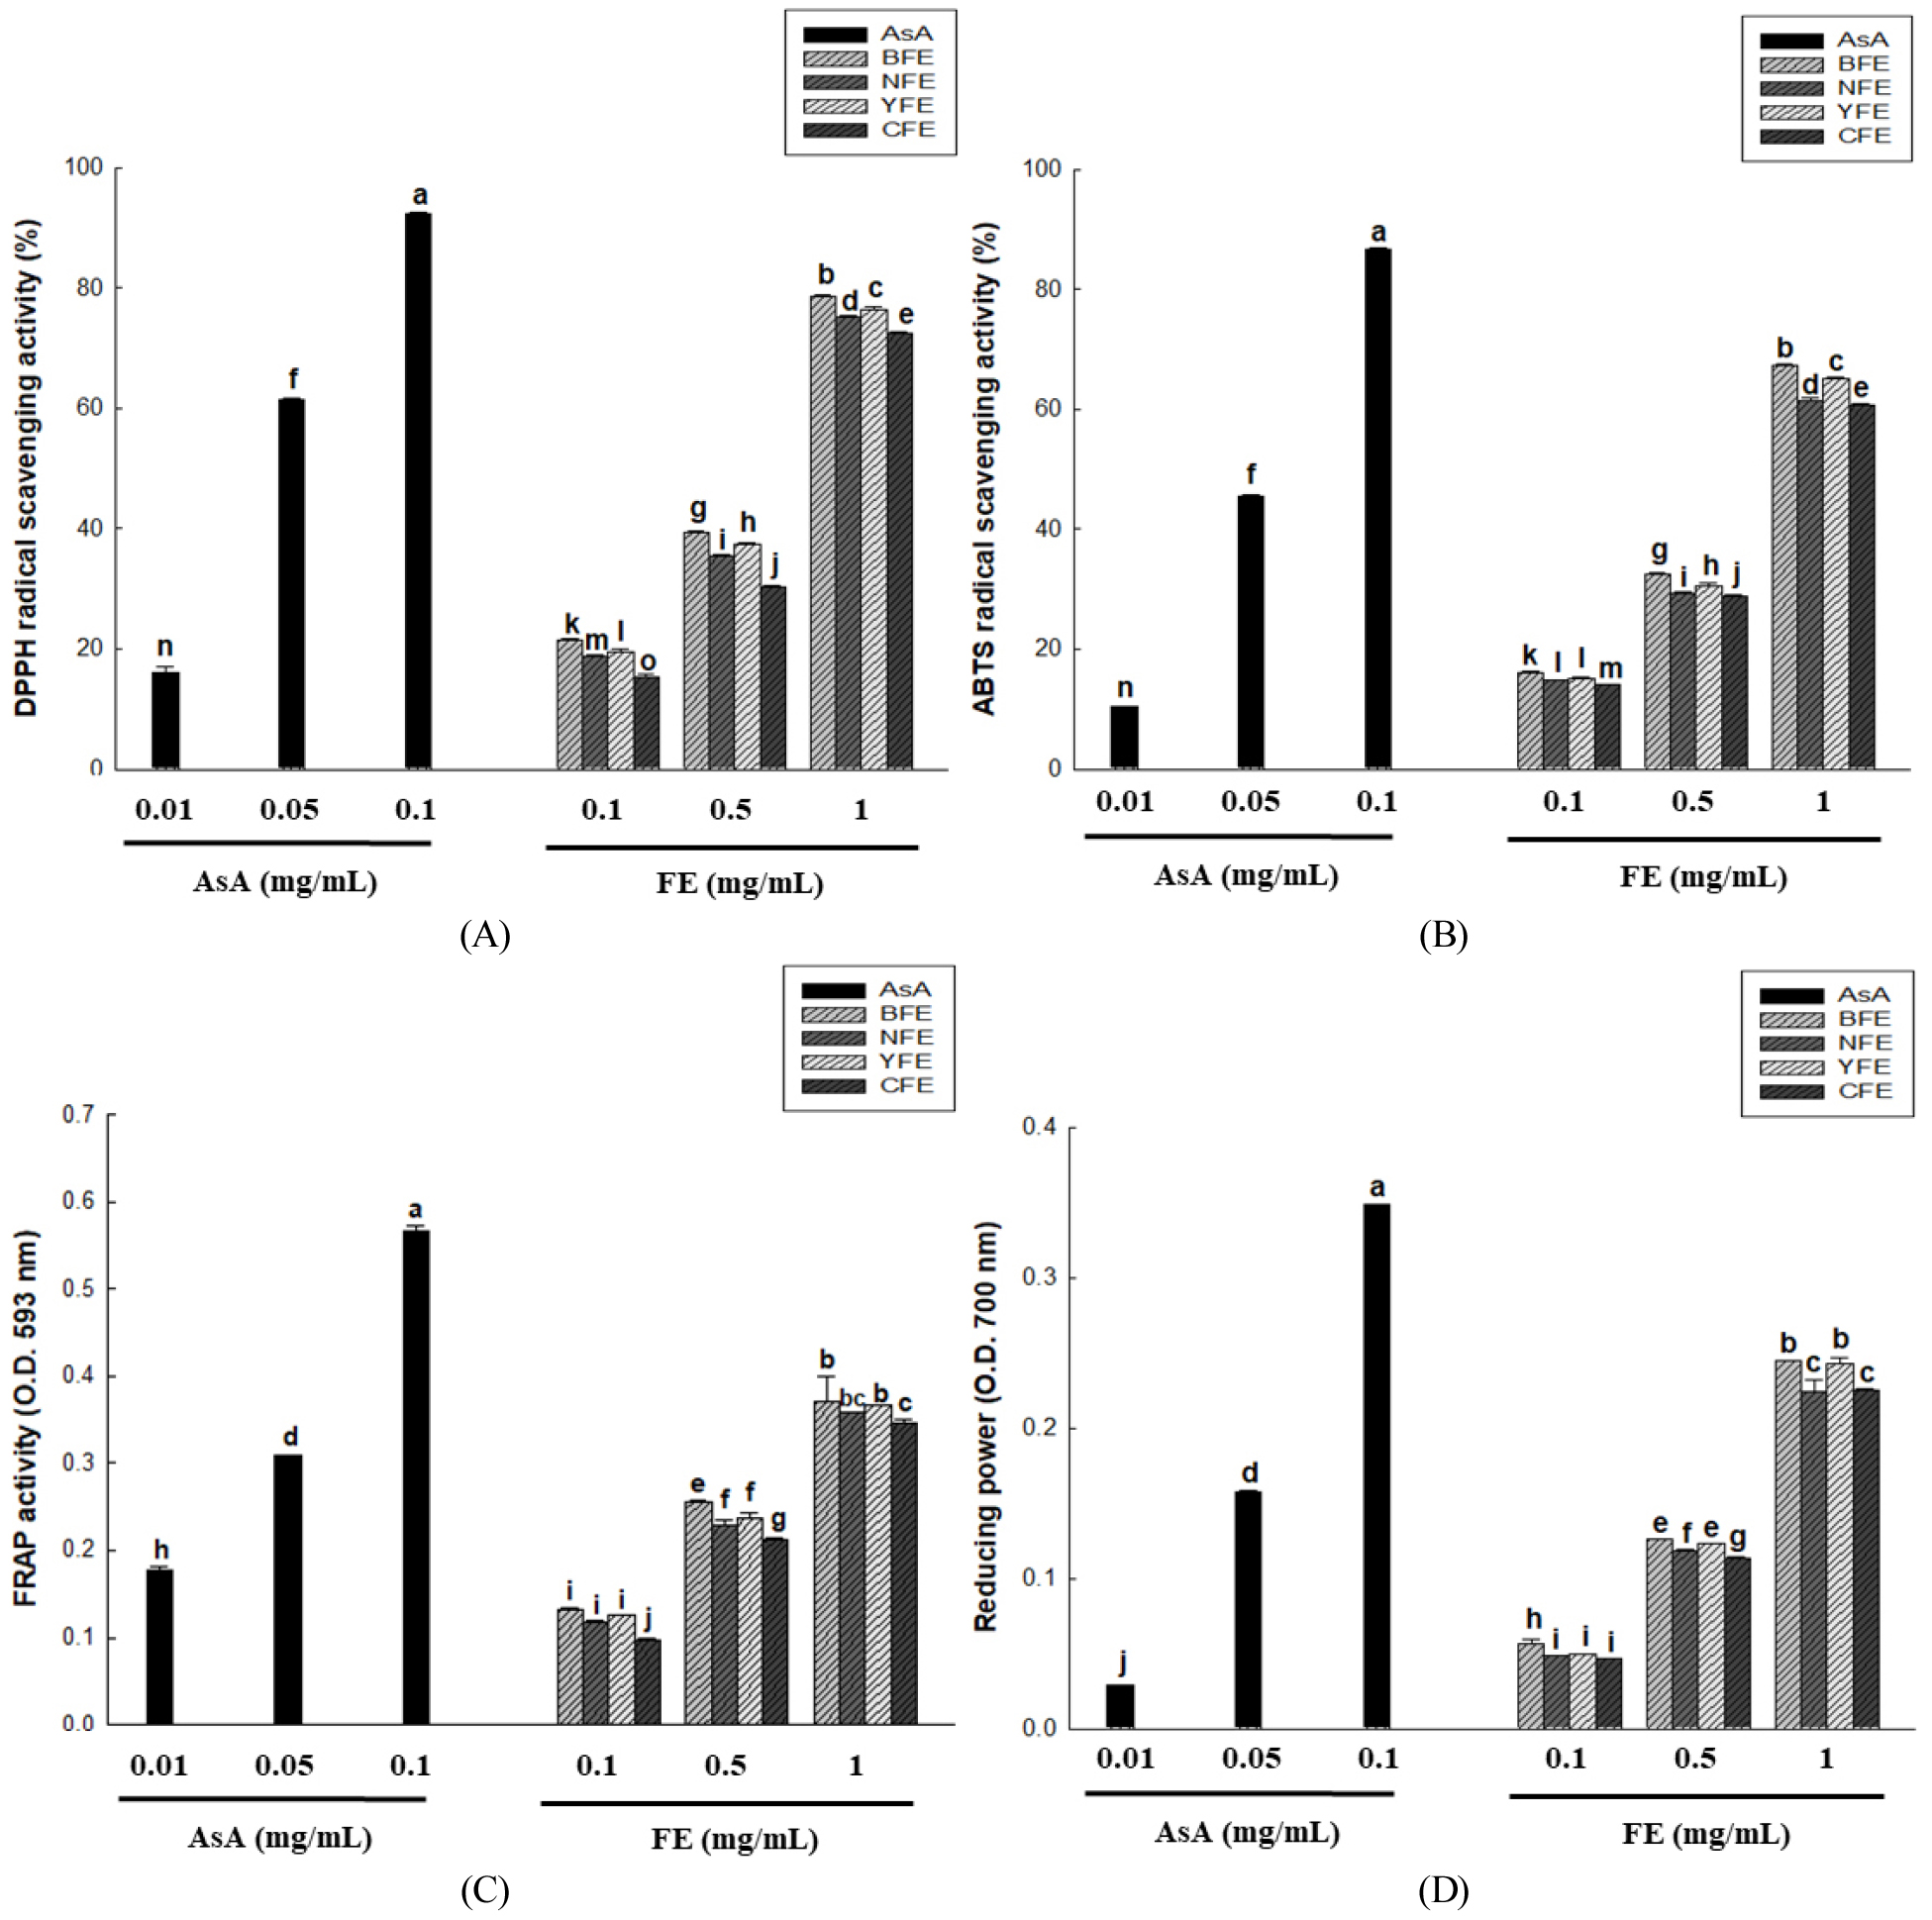
Fig. 3.
DPPH radical scavenging activity (A), ABTS radical scavenging activity (B), FRAP activity (C), and reducing power (D) of BFE, NFE, YFE, and CFE, as well as ascorbic acid (AsA). Results are presented as the mean ± standard deviation of three independent experiments performed in triplicate. Means with different letters indicate significant differences at p & 0.05 according to Duncan’s multiple range test.
Conclusion
This study compared and analyzed the general components, total phenols, total flavonoids, rutin content, and antioxidant activity of three domestic F. esculentum varieties (Bongpyeong, Yecheon, and Nonsan) and one Chinese F. esculentum variety. It also established optimal extraction conditions to maximize the extraction efficiency of bioactive components. Analysis results showed that the 70% EtOH solution, temperature of 40°C, and extraction time of 2 h yielded the highest levels of total phenol, total flavonoid, and rutin contents in all samples. Antioxidant activity (DPPH, ABTS, FRAP, reducing power) was also found to be most potent under the same conditions. Notably, Bongpyeong F. esculentum exhibited the highest content and activity, whereas Chinese F. esculentum showed relatively low values, suggesting the possible differences in functional components based on origin and variety. These results indicate that the 70% EtOH solution, temperature of 40°C, and extraction time of 2 h are the optimal extraction conditions for preserving the bioactive components of F. esculentum and maximizing functionality, supporting the need for standardized studies that account for component differences by origin. Furthermore, this study holds academic significance as foundational data for utilizing F. esculentum as a functional food ingredient, and it can also serve as scientific evidence for future industrial applications and origin-based quality control.
